In the 1990s, a new industry was created in Australia. It produced nothing. But it…
Australia – January labour market update – rising employment and participation sees underutilisation rise modestly
Today (February 20, 2025), the Australian Bureau of Statistics released the latest – Labour Force, Australia – for January 2025. Employment growth was relatively strong and concentrated on full-time employment, which is a good sign. It was, however, unable to keep pace with the underlying population growth and the rising participation rate and as a result the unemployment rate rose by a point. Had the participation rate not risen by 0.2 points, the unemployment rate would have been 3.9 per cent rather than the official rate of 4.1 per cent. We should not disregard the fact that there is still 10.1 per cent of the working age population (over 1.5 million people) who are available and willing but cannot find enough work – either unemployed or underemployed and that proportion is increasing. Australia is not near full employment despite the claims by the mainstream commentators and it is hard to characterise this as a ‘tight’ labour market.
The summary ABS Labour Force (seasonally adjusted) estimates for January 2024 are:
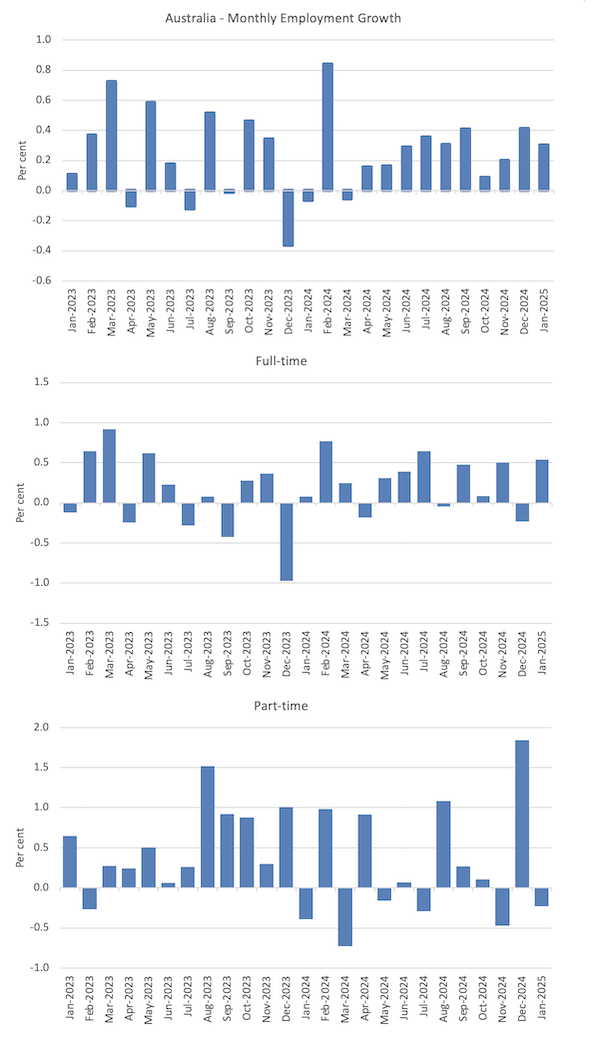
- Employment rose 44,000 (0.3 per cent) – full-time employment rose by 54,100 thousand (0.5 per cent) and part-time employment fell by 10.1 thousand (-0.2 per cent). Part-time share of total was 30.6 per cent.
- Unemployment rose 23,400 to 627,500 persons.
- The official unemployment rate rose 0.1 point to 4.1 per cent.
- The participation rate rose 0.2 points to 67.3 per cent.
- The employment-population ratio rose 0.1 point to 64.6 per cent.
- Aggregate monthly hours fell 7 million hours (-0.4 per cent).
- Underemployment rate was stable at 6 per cent – underemployment rose 6.4 thousand. Overall there are 914.3 thousand underemployed workers. The total labour underutilisation rate (unemployment plus underemployment) rose 0.2 points to 10.1 per cent. There were a total of 1,541.8 thousand workers either unemployed or underemployed.
The ABS Media Release (February 20, 2025) – Unemployment rate rises to 4.1% as participation grows – noted that:
The seasonally adjusted unemployment rate rose by 0.1 percentage point to 4.1 per cent in January …
With employment rising by 44,000 people and the number of unemployed increasing by 23,000 people, the unemployment rate rose to 4.1 per cent …
The rises in both the number of people employed and unemployed saw the participation rate rise by 0.1 percentage point, to a new record high of 67.3 per cent. This was 0.8 percentage points higher than a year ago and 1.8 percentage points higher than March 2020 …
Some of the increase in unemployment reflected more people than usual with jobs in January who were waiting to start or return to work …
The employment-to-population ratio rose 0.1 percentage point to a new record of 64.6 per cent …
The underemployment rate remained at 6.0 per cent in January 2025. This was 0.7 percentage points lower than January 2024, and 2.7 percentage points lower than March 2020.
The underutilisation rate, which combines the unemployment and underemployment rates, rose 0.1 percentage point to 10.1 per cent …
General conclusion:
1. Employment growth was relatively strong and concentrated on full-time employment, which is a good sign.
2. Employment growth was unable to keep pace with the underlying population growth and the rising participation rate and as a result the unemployment rate rose by a point.
3. Had the participation rate not risen by 0.2 points, the unemployment rate would have been 3.9 per cent rather than the official rate of 4.1 per cent.
Employment rose 44,000 (0.3 per cent) in January 2024
1. Full-time employment rose by 54,100 thousand (0.5 per cent) and part-time employment fell by 10.1 thousand (-0.2 per cent).
2. The employment-population ratio rose 0.1 point to 64.6 per cent.
The following graph show the month by month growth in total, full-time, and part-time employment for the 24 months to January 2024 using seasonally adjusted data.
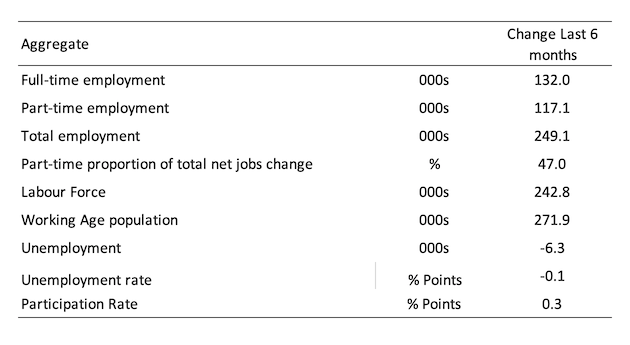
The following table provides an accounting summary of the labour market performance over the last six months to provide a longer perspective that cuts through the monthly variability and provides a better assessment of the trends.
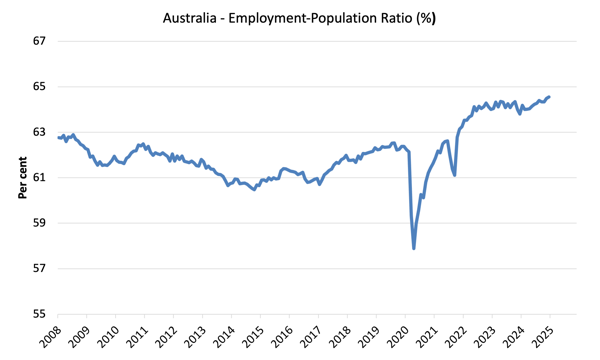
Given the variation in the labour force estimates, it is sometimes useful to examine the Employment-to-Population ratio (%) because the underlying population estimates (denominator) are less cyclical and subject to variation than the labour force estimates. This is an alternative measure of the robustness of activity to the unemployment rate, which is sensitive to those labour force swings.
The following graph shows the Employment-to-Population ratio, since April 2008 (that is, since the GFC).
The employment-to-population ratio has now reached its highest level on record.
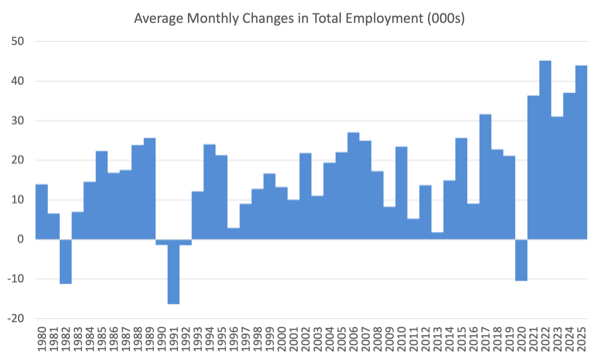
For perspective, the following graph shows the average monthly employment change for the calendar years from 1980 to 2024.
1. The average employment change over 2020 was -10.5 thousand which rose to 36.3 thousand in 2021 as the lockdowns eased.
2. For 2022, the average monthly change was 45.1 thousand, for 2023, the average change was 31 thousand, and for 2024, the average monthly change was 37 thousand.
3. The average (so far) for 2025 (one observation) is 44 thousand – a brighter start compared to last year.
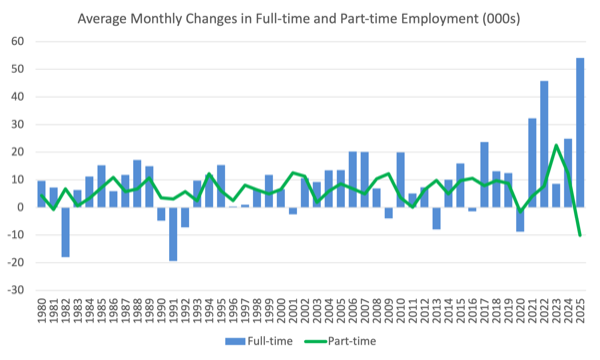
The following graph shows the average monthly changes in Full-time and Part-time employment in thousands since 1980.
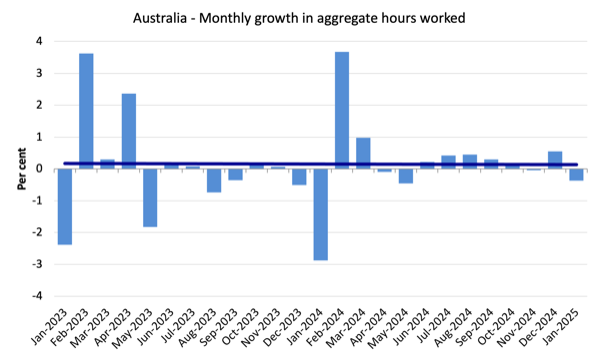
Aggregate monthly hours fell 7.3 million or 0.37 per cent
The following graph shows the monthly growth (in per cent) over the last 24 months.
The dark linear line is a simple regression trend of the monthly change.
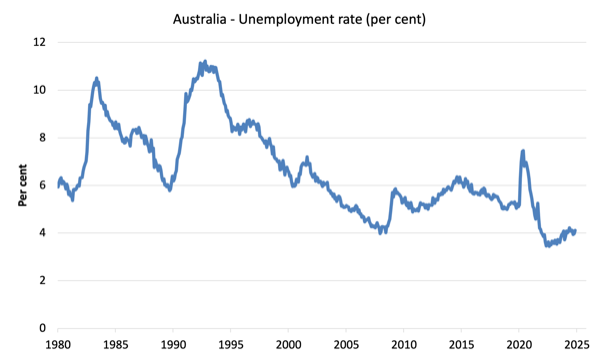
Unemployment rose 23,400 to 627,500 persons in January 2024
The relatively strong employment growth could not keep up with the underlying population growth and the rising participation rate and as a result unemployment rose.
See below for the participation effect.
The following graph shows the national unemployment rate from April 1980 to January 2024. The longer time-series helps frame some perspective to what is happening at present.
What was the impact of the rising participation rate on unemployment in January 2025
The question is what would the unemployment rate have been, given the significant employment growth in January, if the participation rate had not risen and dragged more workers in to the labour force?
These concepts help us answer this type of question:
- The labour force is a subset of the working-age population (those above 15 years old). The proportion of the working-age population that constitutes the labour force is called the labour force participation rate. Thus changes in the labour force can impact on the official unemployment rate, and, as a result, movements in the latter need to be interpreted carefully. A rising unemployment rate may not indicate a recessing economy.
- The labour force can expand as a result of general population growth and/or increases in the labour force participation rates (and vice versa).
The following Table shows the breakdown in the changes to the main aggregates (Labour Force, Employment and Unemployment) and the impact of the fall in the participation rate.
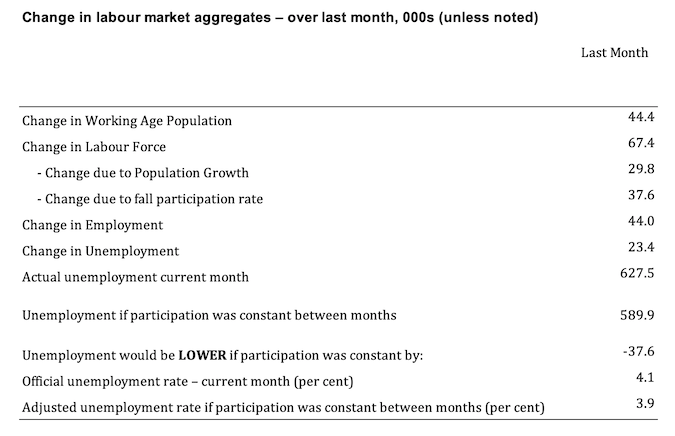
The change in the labour force in January 2025 was the outcome of two separate factors:
- The underlying population growth added 29.8 thousand persons to the labour force. The population growth impact on the labour force aggregate is relatively steady from month to month; and
- The rise in the participation rate meant that there were 37.6 thousand MORE workers entering the labour force (relative to what would have occurred had the participation rate remained unchanged).
- The net result was that the labour force rose by 67.4 thousand.
Assessment:
1. If the participation rate had not have risen in January 2025, total unemployment, given the current employment level, would have been 589.9 thousand rather than the official count of 627.5 thousand as recorded by the ABS – a difference of 37.6 thousand workers (the ‘participation effect’).
2. Without the rise in the participation rate, the official unemployment rate would have been 3.9 per cent (rounded) rather than its current official value of 4.1 per cent).
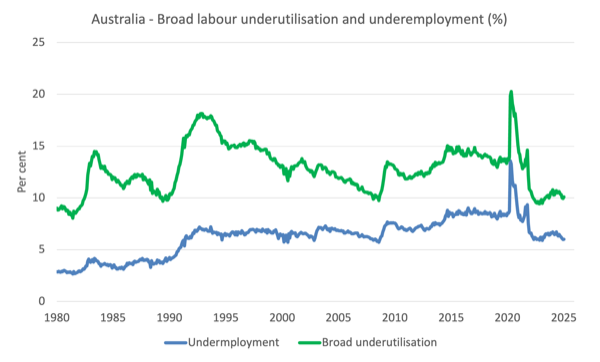
Broad labour underutilisation rose 0.2 points to 10.1 per cent in January 2024
1. Underemployment rate was stable at 6 per cent – underemployment rose 6.4 thousand.
2. Overall there are 914.3 thousand underemployed workers.
3. The total labour underutilisation rate (unemployment plus underemployment) rose 0.2 points to 10.1 per cent.
4. There were a total of 1,541.8 thousand workers either unemployed or underemployed.
Assessment:
The rising participation drove the rise in unemployment while underemployment was stable.
The following graph plots the seasonally-adjusted underemployment rate in Australia from April 1980 to the January 2024 (blue line) and the broad underutilisation rate over the same period (green line).
The difference between the two lines is the unemployment rate.
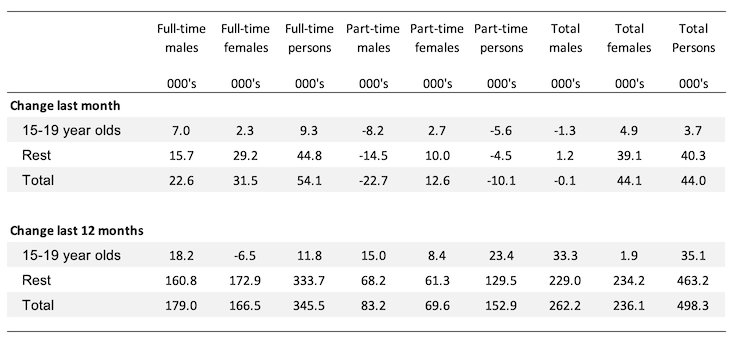
Teenage labour market – modest improvement in January 2024
Overall teenage employment rose by 3.7 thousand with full-time employment rising by 9.3 thousand and part-time employment declining by 5.6 thousand.
The following Table shows the distribution of net employment creation in the last month and the last 12 months by full-time/part-time status and age/gender category (15-19 year olds and the rest).
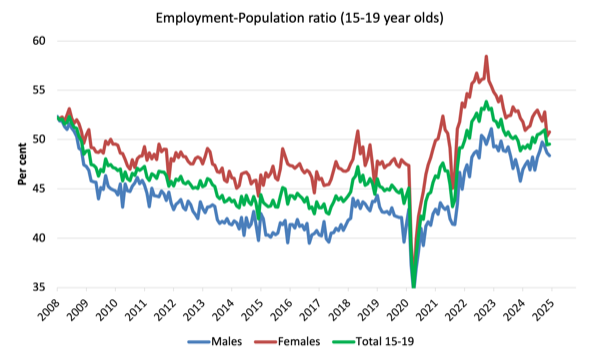
To put the teenage employment situation in a scale context (relative to their size in the population) the following graph shows the Employment-Population ratios for males, females and total 15-19 year olds since July 2008.
You can interpret this graph as depicting the change in employment relative to the underlying population of each cohort.
In terms of the recent dynamics:
1. The male ratio fell 0.1 point over the month.
2. The female ratio rose 0.4 points over the month.
3. The overall teenage employment-population ratio rose 0.1 point over the month.
Conclusion
My standard monthly warning: we always have to be careful interpreting month to month movements given the way the Labour Force Survey is constructed and implemented.
My overall assessment is:
1. Employment growth was relatively strong and concentrated on full-time employment, which is a good sign.
2. Employment growth was unable to keep pace with the underlying population growth and the rising participation rate and as a result the unemployment rate rose by a point.
3. Had the participation rate not risen by 0.2 points, the unemployment rate would have been 3.9 per cent rather than the official rate of 4.1 per cent.
3. We should not disregard the fact that there is still 10.1 per cent of the working age population (over 1.5 million people) who are available and willing but cannot find enough work – either unemployed or underemployed and that proportion is increasing.
5. Australia is not near full employment despite the claims by the mainstream commentators and it is hard to characterise this as a ‘tight’ labour market.
That is enough for today!
(c) Copyright 2025 William Mitchell. All Rights Reserved.
Neil Wilson on Reddit:
“ Marginalism isn’t a thing in any economy with actual businesses in it. It’s another of those concepts that is neat, plausible and wrong.
In reality firms face falling marginal costs and mostly sell to other businesses. There would be a real revolution in economics if economists studied and understood the accounting notion of a contribution.
The Blinder book is the eye-opener here, although Galbraith had reality pinned down long before that.
Blinder, Alan S. 1998. Asking about prices: a new approach to understanding price stickiness(Russell Sage Foundation: New York).
Galbraith, John Kenneth, and James K. Galbraith. 1967. The new industrial state (The James Madison library in American politics) (Princeton University Press: Princeton).”
Please write a blog on this