The Reserve Bank of Australia (RBA) increased the policy rate by 0.25 points on Tuesday…
Underlying inflation in Australia continues to decline
Today (November 27, 2024), the Australian Bureau of Statistics (ABS) released the latest – Monthly Consumer Price Index Indicator – for November 2024, which showed that the annual underlying inflation rate, which excludes volatile items continues to fall – from 3.5 per cent to 3.2 per cent. The overall CPI rate (including the volatile items) rose slightly from 2.1 per cent to 2.3 per cent, but that was mostly due to the timing of government electricity rebates between October and November. In other words, the slight rise cannot be interpreted as signalling a renewed inflationary spiral is underway. All the indicators are suggesting inflation is declining and the major drivers are abating. The overall rate has been at the lower end of the RBA’s inflation targetting range (2 to 3 per cent) for four successive months now, yet the RBA continues to claim they fear a wages breakout and that unemployment needs to increase. The RBA has gone rogue and its public statements bear little relationship with reality. It is clear that the residual inflationary drivers are not the result of excess demand but rather reflect transitory factors like weather events, institutionally-driven price adjustments (such as indexation arrangements), and abuse of anti-competitive, corporate power. The general conclusion is that the global factors that drove the inflationary pressures have largely resolved and that the outlook for inflation is for continued decline. There is also evidence that the RBA has caused some of the persistence in the inflation rate through the impact of the interest rate hikes on business costs and rental accommodation.
The latest monthly ABS CPI data shows for November 2024 that the annual price movements are:
- The All groups CPI measure rose 2.3 per cent over the 12 months (+0.2 on October).
- Food and non-alcoholic beverages rose 2.9 per cent (down from 3.3).
- Alcohol and tobacco rose 6.7 per cent (from 6)
- Clothing and footwear 2 per cent (from 0.6 per cent).
- Housing 1.2 per cent (0.2). Rents (6.6 per cent (6.7).
- Furnishings and household equipment 1.6 per cent (steady).
- Health 3.9 per cent (steady).
- Transport -2.4 per cent (-2.8).
- Communications 0.1 per cent (-0.7).
- Recreation and culture 3.2 per cent (4.3).
- Education 6.3 per cent (steady)
- Insurance and financial services 5.5 per cent (6.3).
The ABS Media Release (January 8, 2024) – Monthly CPI indicator rises 2.3% in the year to November 2024 – noted that:
The monthly Consumer Price Index (CPI) indicator rose 2.3 per cent in the 12 months to November 2024, up from a 2.1 per cent rise in the 12 months to October …
The largest contributors to the annual movement were Food and non-alcoholic beverages (+2.9 per cent), Alcohol and tobacco (+6.7 per cent), and Recreation and culture (+3.2 per cent). Partly offsetting the rise in the CPI were annual falls for Electricity (-21.5 per cent) and Automotive fuel (-10.2 per cent) …
Annual CPI inflation has risen since last month, in part due to the timing of electricity rebates. In some states and territories, households received two rebate payments in October in lieu of not receiving a payment in July. From November most households received one payment. As a result, electricity prices fell 21.5 per cent in the 12 months to November, compared to a fall of 35.6 per cent to October …
Annual trimmed mean inflation was 3.2 per cent in November, down from 3.5 per cent in October …
Rents rose 6.6 per cent in the 12 months to November, following a similar annual rise of 6.7 per cent to October
So a few observations:
1. The underlying inflation rate that excludes volatile items continues to fall.
2. The overall CPI figure remains towards the bottom of the RBA’s targetting range, although they will claim it is the underlying figure that matters, which is still slightly higher than the upper limit they artificially impose on their policy decisions.
3. The on-going rent inflation is partly due to the RBA’s own rate hikes as landlords in a tight housing market just pass on the higher borrowing costs – so the so-called inflation-fighting rate hikes are actually driving inflation. There is now international research supporting this view, which I will comment on in a different blog post.
4. The monthly rise in the CPI was mostly due to the institutional timing of electricity rebates rather than being due to an acceleration in underlying driving forces. The electricity component is still significantly lower after the introduction of the federal and state government rebates offsetting the profit-gouging in the energy sector. This demonstrates how expansionary fiscal policy can be an effective tool in combatting inflation.
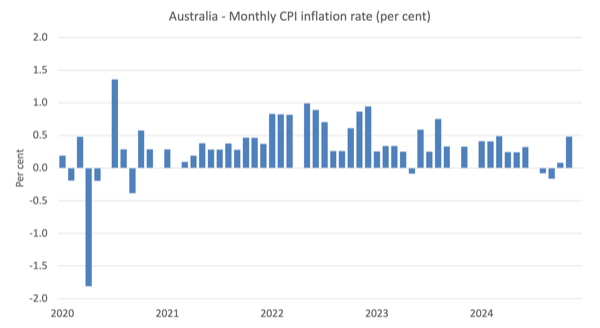
The next graph shows the monthly rate of inflation which fluctuates in line with special events or adjustments (such as, seasonal natural disasters, annual indexing arrangements etc).
There is no hint from this data that the inflation rate is accelerating or needs any special policy attention.
As noted above, there were timing issues relating to electricity rebates that influenced the month-to-month outcomes.
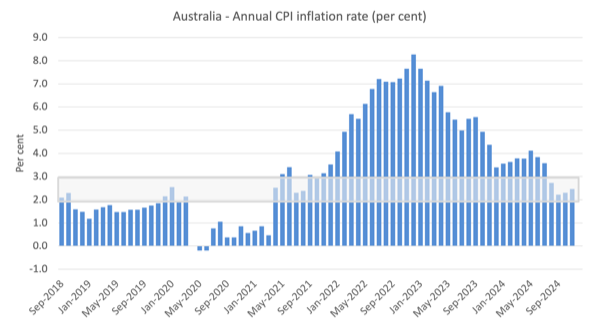
The next graph shows the annual movement with the shaded area showing the RBA targetting range.
The overall inflation rate was consistently within the targetting range for 4 months leading to November 2024
Inflation peaked in December 2022 as the supply factors pertaining to the pandemic, Ukraine and OPEC started to abate.
The RBA kept hiking through 2023 claiming that there was a danger that wages growth would ‘breakout’ despite the fact that the data was showing no such thing with growth at record or near record lows.
It is also useful to note that prior to the inflationary episode, the RBA largely failed to keep the annual inflation rate within their target zone, which tells us about the effectiveness of the monetary policy tool in relation to its stated objective.
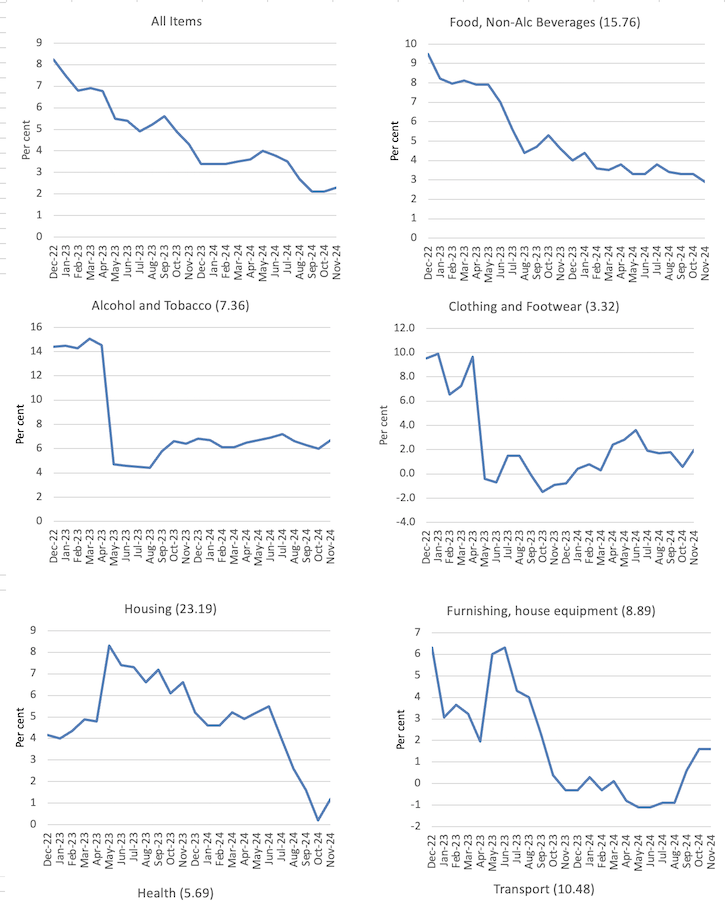
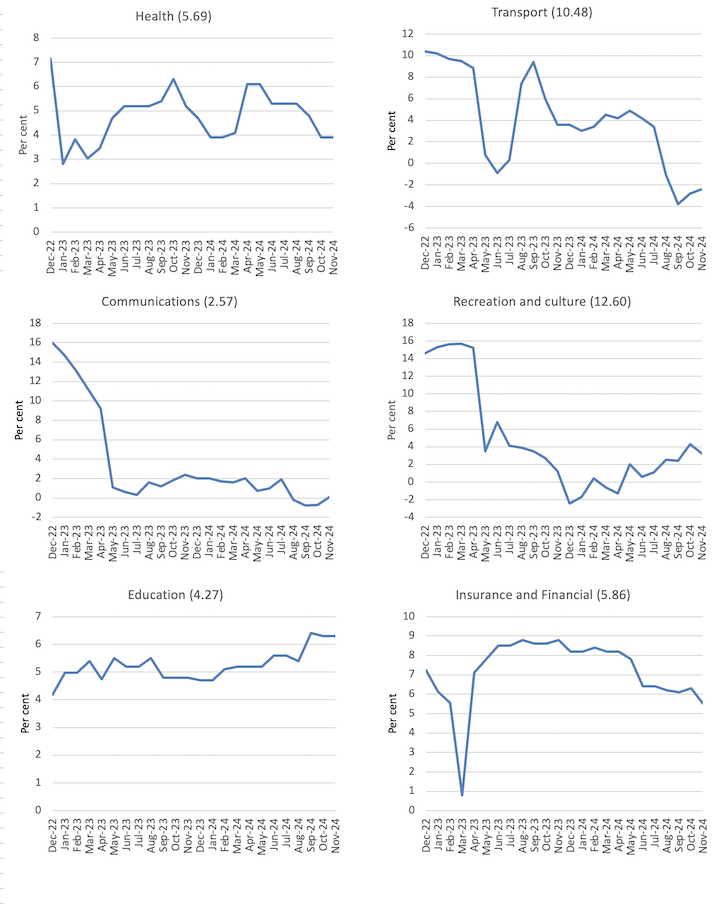
The next graphs show the movements between December 2022 and November 2024 for the main components of the All Items CPI (the decimal number next to the component title represent the weight of that component in the overall CPI where the sum is 100).
In general, most components are seeing dramatic reductions in price rises as noted above and the exceptions do not provide the RBA with any justification for further interest rate rises.
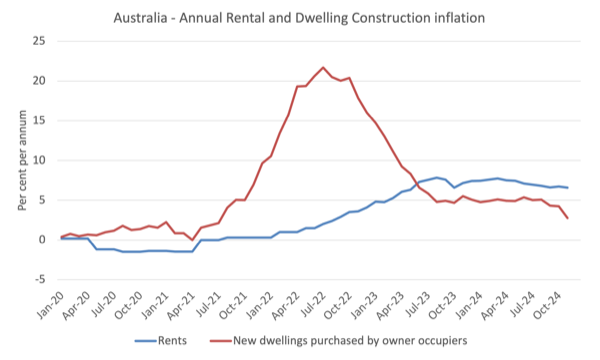
The next graph shows the movements in the housing component (with rents separated out from the new dwelling purchase by owner-occupiers.
The RBA started hiking interest rates in May 2022 and ended in November 2023.
The rent component has risen almost in sync with the RBA interest rate hikes and now the rate hikes have ended (for now), the rent inflation has levelled off.
The construction costs for new dwellings have been in retreat since early 2022 as the supply constraints arising from natural disasters (fire burning down forests), the pandemic (building supply disruptions), and the Ukraine situation have eased.
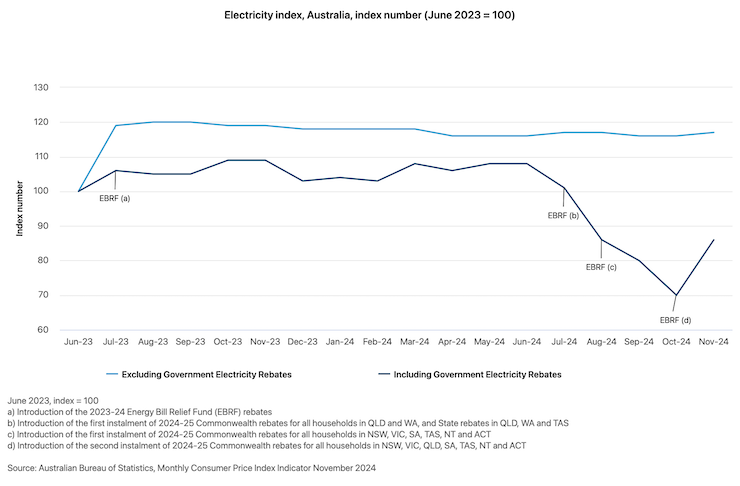
The ABS also publishes an interesting graph, which compares the electricity prices under the Federal government’s – Energy Bill Relief Fund – rebates which were introduced in July 2023 and what they would have been in the absence of that fiscal intervention.
The Relief Fund provided subsidies to households and small businesses depending on the locality.
The ABS report that:
The EBRF rebates were first introduced in July 2023 and were expanded to all households in July 2024. These rebates have had the effect of reducing electricity prices for households. Including government electricity rebates, electricity prices for households have fallen by 14.6% since June 2023. Excluding these rebates, electricity prices for households would have increased 16.9% since June 2023.
Here is the impact of that simple and very modest fiscal intervention.
It demonstrates that targetted expansionary fiscal policy can indeed be anti-inflationary, which means that the spending-inflation nexus is never straightforward as the mainstream narratives might have you believe.
This was the approach the Japanese government took to quickly contain the cost-of-living increases for households.
It works.
Austerity is not required when the inflation is sourced from the supply-side as it was in 2021 and 2022.
Migration from Twitter to Bluesky
As I have previously noted I have quit Twitter and am now using Bluesky to post information about my work.
My Bluesky address is: @williammitchell.bsky.social
That should be easy to find.
I hope you will follow me over to Bluesky as my Twitter account is now gone forever.
It seems that Bluesky now has critical mass and is a much saner place to be than Twitter had become.
Announcement
I have a very heavy workload at present with a range of projects needing progress and a lot of travel commitments scheduled.
To make all that possible, I have decided to cut out the Wednesday blog post this year unless there is a special event – for example, National Accounts data always comes out on a Wednesday in Australia or the inflation data (as today).
So for 2025, my blog will publish posts on Monday’s and Thursdays with exceptions.
The exceptions include the (current) monthly update of our Manga series – The Smith Family and their Adventures with Money – the next instalment (Episode 10), which is due out this Friday, January 10, 2025.
And, when I return to Japan later in 2025 for a few months, the regular weekly Kyoto Update will resume on Tuesdays.
This is music …
This is what I have been listening to while working this morning.
This song – Flamingo – is taken from the 1959 Blue Note album – The Sermon.
This was a monster recording and featured:
1. Jimmy Smith – Hammond B3 organ.
2. Lee Morgan – Trumpet.
3. Art Blakey – Drums.
4. Kenny Burrell – guitar.
It was recorded on February 25th, 1958 at the Manhattan Towers in New York City.
At the time – Lee Morgan – was just 19 years old and only lasted to 33 years of age.
He was shot by his de facto wife in a jazz club where he was performing.
That is enough for today!
(c) Copyright 2025 William Mitchell. All Rights Reserved.
Art Blakey and the Jazz Messengers Moanin’ (blue note 4003) gets played at least once a week at home. For me it’s the definitive Hard Bop sound.