Over the last several years, I have been indicating that I think we are in…
Australian labour market – positive shift in September 2024
Today (October 17, 2024), the Australian Bureau of Statistics released the latest – Labour Force, Australia – for September 2024, which shows that the labour outlook shifted towards the positive in September 2024. Employment growth was above the year’s average and was biased towards the net creation of full-time jobs and underemployment fell. The unemployment rate was slightly lower because employment growth outstripped the underlying population growth and the rising participation rate. But we should not disregard the fact that there is now 10.4 per cent of the working age population (over 1.6 million people) who are available and willing but cannot find enough work – either unemployed or underemployed and that proportion is increasing. Australia is not near full employment despite the claims by the mainstream commentators and it is hard to characterise this as a ‘tight’ labour market.
The summary ABS Labour Force (seasonally adjusted) estimates for September 2024 are:
- Employment rose 64,100 (0.4 per cent) – full-time employment rose 51.6 thousand and part-time employment rose by 12.5 thousand. Part-time share of total was 30.6 per cent.
- Unemployment fell 9.2 thousand to 615,700 persons.
- The official unemployment rate was steady at 4.1 per cent.
- The participation rate rose 0.1 point to 67.2 per cent.
- The employment-population ratio rose 0.1 point to 64.3 per cent.
- Aggregate monthly hours rose 5 million (0.3 per cent).
- Underemployment rate fell 0.2 points to 6.3 per cent – underemployment fell by 16.1 thousand. Overall there are 960.4 thousand underemployed workers. The total labour underutilisation rate (unemployment plus underemployment) fell 0.2 points to 10.4 per cent. There were a total of 1,576.1 thousand workers either unemployed or underemployed.
In the ABS Media Release – Unemployment rate steady at 4.1% in September – the ABS noted that:
The unemployment rate was steady at 4.1 per cent in September, in line with the revised figure for August …
Despite the slight fall in the number of unemployed people, the strong rise in employment saw the participation rate rise by 0.1 percentage point to a record high of 67.2 per cent …
Seasonally adjusted monthly hours worked rose by 0.3 per cent …
The underemployment rate fell by 0.1 percentage point to 6.3 per cent. This was 0.1 percentage point lower than September 2023, and 2.4 percentage points lower than March 2020.
The underutilisation rate, which combines the unemployment and underemployment rates, fell 0.2 percentage points to 10.4 per cent.
General conclusion:
1. Employment growth continues to absorb the new entrants leaving the unemployment rate unchanged at the elevated level of 4.1 per cent.
2. Participation is also rising which makes it harder to reduce the unemployment rate.
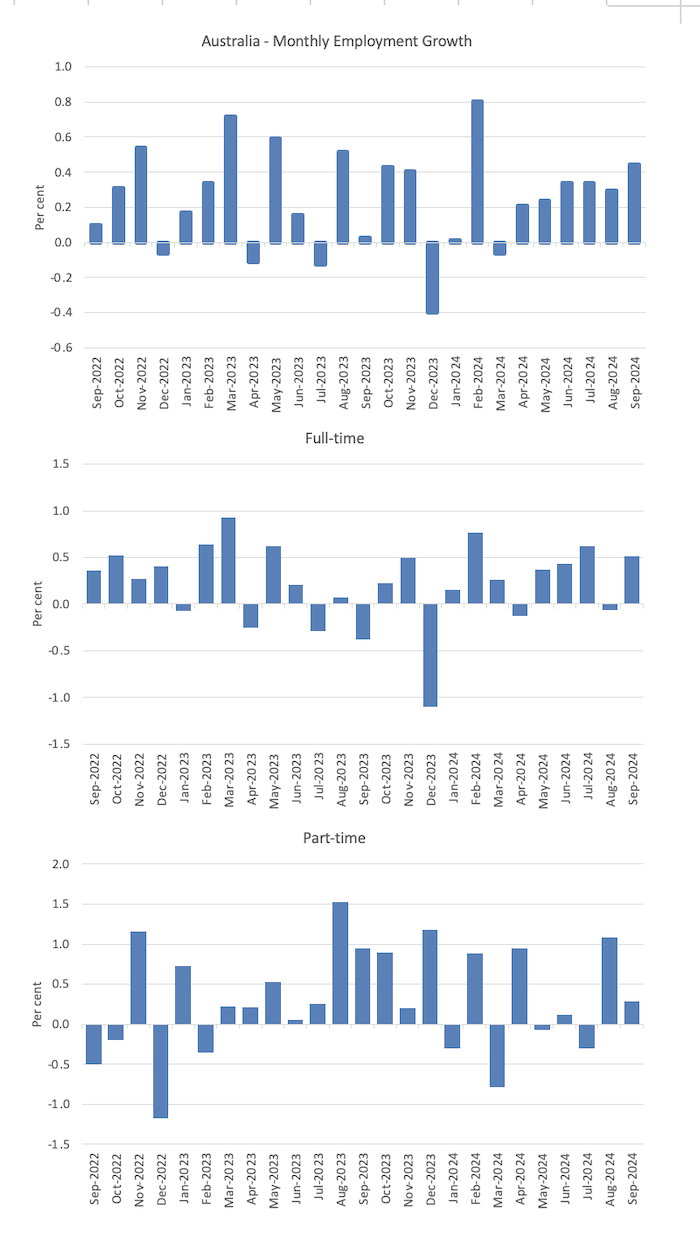
Employment rose 64,100 (0.4 per cent) in September 2024
1. Employment rose 64,100 (0.4 per cent) – full-time employment rose 51.6 thousand and part-time employment rose by 12.5 thousand. Part-time share of total was 30.6 per cent
2. The employment-population ratio rose 0.1 point to 64.4 per cent.
The following graph show the month by month growth in total, full-time, and part-time employment for the 24 months to September 2024 using seasonally adjusted data.
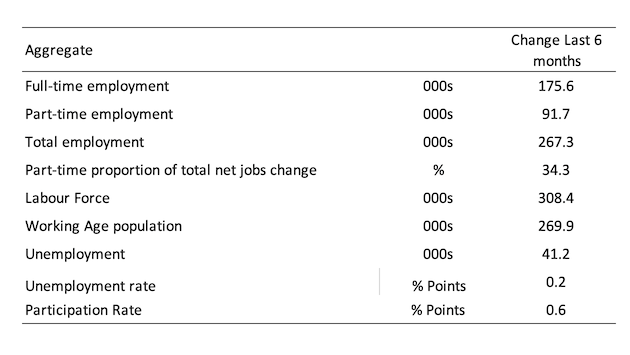
The following table provides an accounting summary of the labour market performance over the last six months to provide a longer perspective that cuts through the monthly variability and provides a better assessment of the trends.
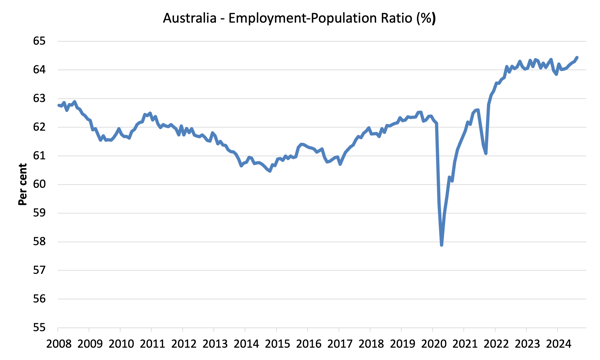
Given the variation in the labour force estimates, it is sometimes useful to examine the Employment-to-Population ratio (%) because the underlying population estimates (denominator) are less cyclical and subject to variation than the labour force estimates. This is an alternative measure of the robustness of activity to the unemployment rate, which is sensitive to those labour force swings.
The following graph shows the Employment-to-Population ratio, since April 2008 (that is, since the GFC).
The employment-to-population ratio is still demonstrating stability with minor fluctuations around the current level.
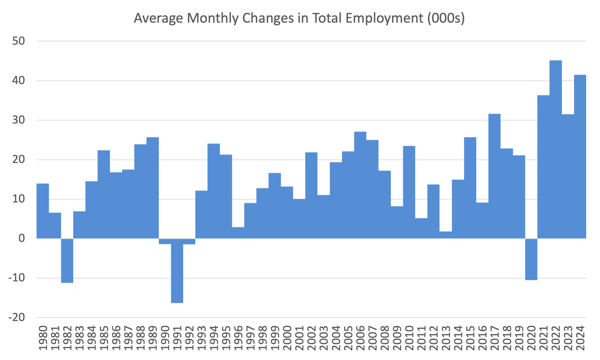
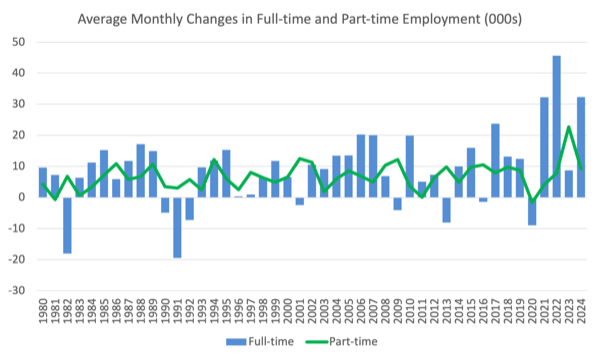
For perspective, the following graph shows the average monthly employment change for the calendar years from 1980 to 2024.
1. The average employment change over 2020 was -10.5 thousand which rose to 36.3 thousand in 2021 as the lockdowns eased.
2. For 2022, the average monthly change was 45.1 thousand, and for 2023, the average change was 31.5 thousand.
3. So far in 2024, the average monthly change is 41.5 thousand.
The following graph shows the average monthly changes in Full-time and Part-time employment in thousands since 1980.
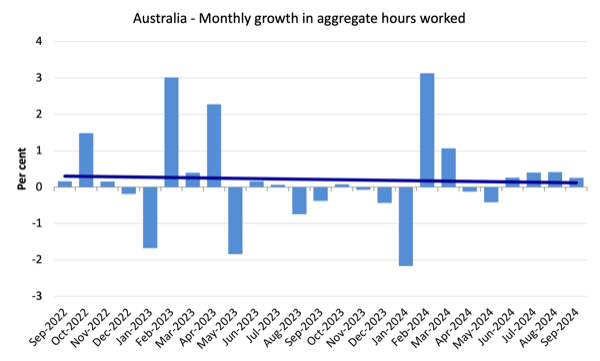
Aggregate monthly hours rose by 5.1 million hours (0.26 per cent)
The following graph shows the monthly growth (in per cent) over the last 48 months (with the pandemic restriction period omitted).
The dark linear line is a simple regression trend of the monthly change.
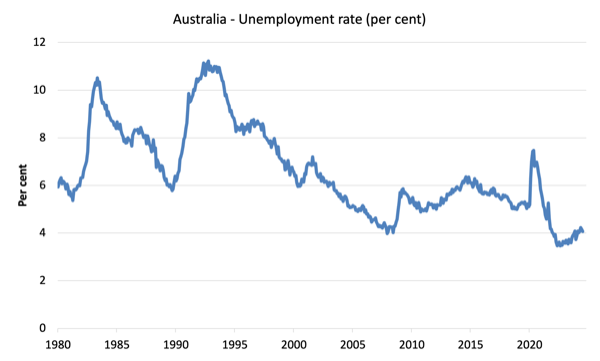
Unemployment fell 9.2 thousand to 615,700 persons in September 2024
The very modest decline unemployment was due to employment growth outpacing the underlying population growth and the rising participation rate.
The following graph shows the national unemployment rate from April 1980 to September 2024. The longer time-series helps frame some perspective to what is happening at present.
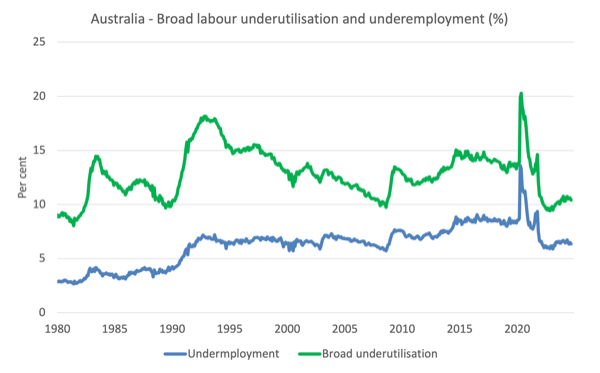
Broad labour underutilisation fell 0.2 points to 10.4 per cent in September 2024
1. Underemployment rate fell 0.2 points to 6.3 per cent – underemployment fell by 16.1 thousand.
2. Overall there are 960.4 thousand underemployed workers.
3. The total labour underutilisation rate (unemployment plus underemployment) fell 0.2 points to 10.4 per cent.
4. There were a total of 1,576.1 thousand workers either unemployed or underemployed.
Assessment:
The strong employment growth was dominated by full-time employment and the rise in monthly hours worked led to underemployment dropping by 0.2 points.
That is a good sign.
The following graph plots the seasonally-adjusted underemployment rate in Australia from April 1980 to the September 2024 (blue line) and the broad underutilisation rate over the same period (green line).
The difference between the two lines is the unemployment rate.
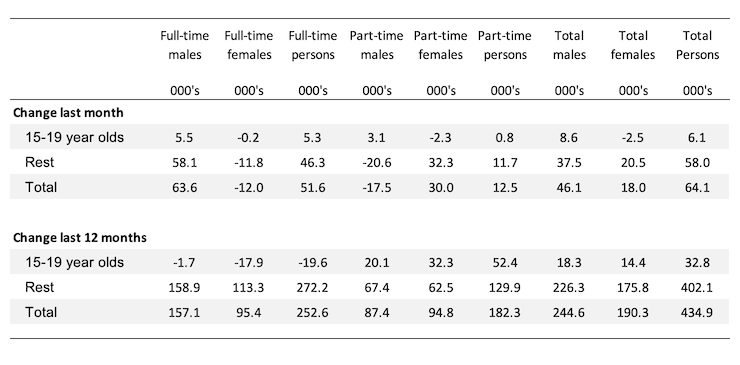
Teenage labour market improves in September 2024
Overall teenage employment rose by 6.1 thousand and full-time employment rose by 5.3 thousand, which is a good sign.
The following Table shows the distribution of net employment creation in the last month and the last 12 months by full-time/part-time status and age/gender category (15-19 year olds and the rest).
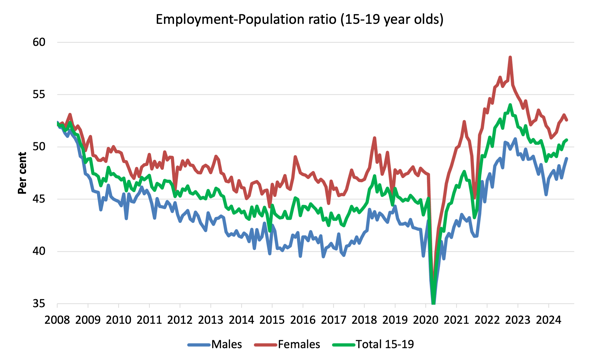
To put the teenage employment situation in a scale context (relative to their size in the population) the following graph shows the Employment-Population ratios for males, females and total 15-19 year olds since July 2008.
You can interpret this graph as depicting the change in employment relative to the underlying population of each cohort.
In terms of the recent dynamics:
1. The male ratio rose 0.8 points over the month.
2. The female ratio fell 0.5 points over the month.
3. The overall teenage employment-population ratio rose 0.2 points over the month.
Conclusion
My standard monthly warning: we always have to be careful interpreting month to month movements given the way the Labour Force Survey is constructed and implemented.
My overall assessment is:
1. The labour outlook shifted towards the positive in September 2024.
2. Employment growth was above the year’s average and was biased towards the net creation of full-time jobs and underemployment fell.
3. The unemployment rate was slightly lower because employment growth outstripped the underlying population growth and the rising participation rate.
4. But we should not disregard the fact that there is now 10.4 per cent of the working age population (over 1.6 million people) who are available and willing but cannot find enough work – either unemployed or underemployed and that proportion is increasing.
5. Australia is not near full employment despite the claims by the mainstream commentators and it is hard to characterise this as a ‘tight’ labour market.
That is enough for today!
(c) Copyright 2024 William Mitchell. All Rights Reserved.
This Post Has 0 Comments