Today (June 3, 2026), the Australian Bureau of Statistics (ABS) released the latest - Australian…
US spending data not demonstrating effectiveness of monetary policy
I have been looking for signs that the concerted efforts by most central banks (bar the eminently more sensible Bank of Japan) to kill growth and force unemployment up have actually been effective. My prior, of course, is that the interest rates will not significantly reduce growth in the short run, but may if they go high enough start to impact on spending patterns of low income households. The next data that will help us associate the interest rate effects on spending by income quintile in the US comes out in September 2023, so I will watch out for that. The most recent national accounts data from the US, however, does not support the mainstream belief that monetary policy is the most effective tool for suppressing expenditure. Far from it.
The ineffectiveness of monetary policy – US economy
On June 29, 2023, the US Bureau of Economic Analysis published the latest US National Accounts figures – Gross Domestic Product (Third Estimate), Corporate Profits (Revised Estimate), and GDP by Industry, First Quarter 2023 – which showed that “Real gross domestic product (GDP) increased at an annual rate of 2.0 percent in the first quarter of 2023”.
The December-quarter 2022 growth rate was 2.6 per cent.
The ‘third estimate’ 2 per cent figure is a revision on the earlier announcement of 1.3 per cent and reflects the receipt of “more complete data” being available.
The US Bureau of Economic Analysis said that:
The increase in real GDP in the first quarter reflected increases in consumer spending, exports, state and local government spending, federal government spending, and nonresidential fixed investment that were partly offset by decreases in private inventory investment and residential fixed investment. Imports increased.
Note that the BEA is using the annualised quarterly figure here (multiplying the March-quarter growth of 0.5 per cent by 4) rather than the actual annual (year-on-year) growth rate which is the percentage shift from the March-quarter 2019 to the March-quarter 2020.
That aggregate was 1.8 per cent up from 0.88 per cent in the December-quarter 2022.
The following sequence of graphs captures the story.
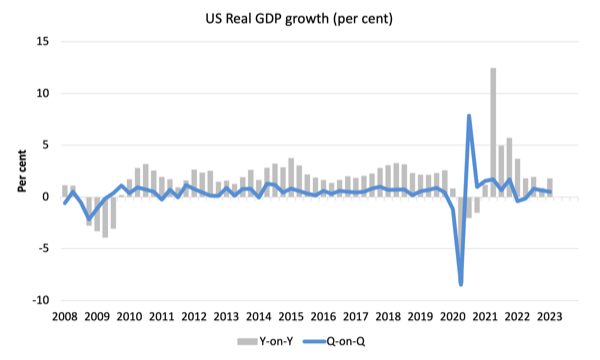
The first graph shows the annual real GDP growth rate (year-to-year) from the peak of the last cycle (December-quarter 2007) to the March-quarter 2020 (grey bars) and the quarterly growth rate (blue line). Note the date line starts at March-quarter 2008.
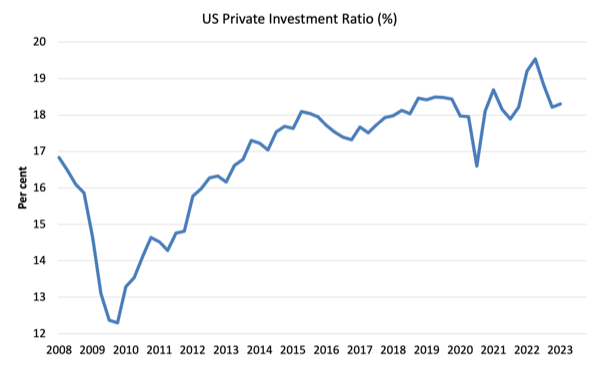
The next graph shows the evolution of the Private Investment to GDP ratio from the March-quarter 2008 (real GDP peak prior to GFC downturn) to the March-quarter 2023.
Business investment is one of the national accounting aggregates that mainstream economists believe would be highly sensitive to interest rate movements.
The data doesn’t suggest that.
The chaos caused by the pandemic is evident as is the stalling performance after the initial GFC recovery.
But the investment rate is around the pre-pandemic value now and now showing anything like a dramatic ‘fall of the cliff’ dynamic.
Contributions to growth
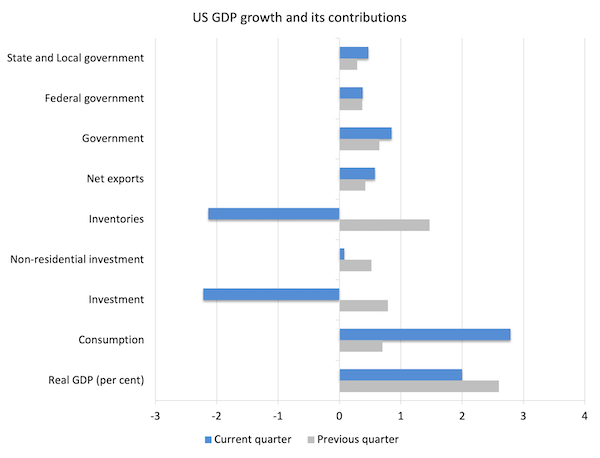
The next graph compares the December-quarter 2022 (grey bars) contributions to real GDP growth at the level of the broad spending aggregates with the March-quarter 2023 (blue bars).
The major driver of the GDP rebound has been the strengthening personal consumption spending, which is also probably driven the run down in retail trade inventories.
The US government at all levels is also driving growth as is net exports.
Business investment undermined growth in the March-quarter – which might be taken as a sign that the interest rate hikes have started to impact (see below).
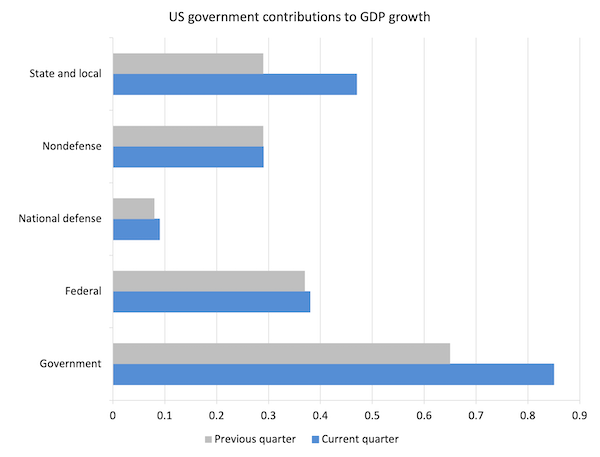
The next graph decomposes the government sector and shows that Federal non-defense spending has dominated.
There were strong growth contributions from all levels of government.
To better understand what is happening with investment expenditure, the next graph breaks down the contributions to real GDP growth of the various components of investment.
The overall decline was driven by the inventory reductions, while other capital formation expenditure components were mostly positive and contributed to production.
Spending on equipment was a brake on overall GDP growth.
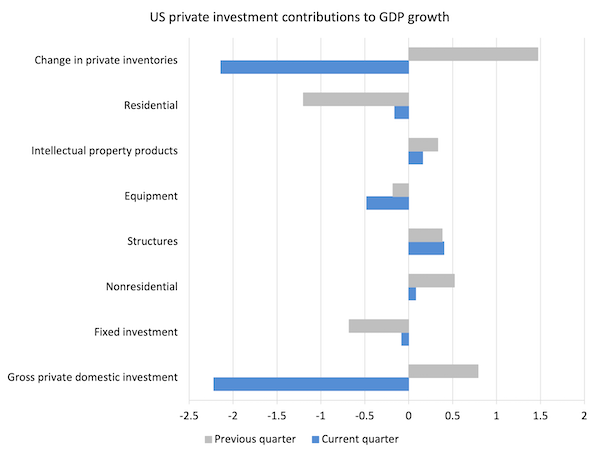
My tentative assessment is that the inventory cycle is mostly driving the negative contribution of investment expenditure to GDP growth.
But we have to be careful to understand what that means.
There was a strong uplift in household consumption expenditure, which I suspect has caught the producers by surprise somewhat and led to the decline in unsold inventories.
FIrms will most likely seek to replenish their stocks in the June-quarter reinforcing the positive sentiment in the other investment categories.
The point is that I cannot see any substantial negative interest rate effect in this data.
US Household consumption and debt
The Federal Reserve Bank of New York publication – Household Debt and Credit Report – was last updated for the March-quarter 2023 (published May 2023) – (PDF Download).
It shows:
… Aggregate household debt balances increased by $148 billion in the first quarter of 2023, a 0.9% rise from 2022Q4. Balances now stand at $17.05 trillion and have increased by $2.9 trillion since the end of 2019, just before the pandemic recession …
Mortgage balances shown on consumer credit reports increased by $121 billion during the first quarter of 2023 and stood at $12.04 trillion at the end of March, a modest increase …
Credit card balances were flat in the first quarter, at $986 billion, bucking the typical trend of balance declines in first quarters. Auto loan balances increased by $10 billion in the first quarter, continuing the upward trajectory that has been in place since 2011.
So while there has been a “slow-down in home sales” there doesn’t appear to be a massive hit on consumer borrowing.
The data also shows that:
Aggregate delinquency rates were roughly flat in the first quarter of 2023 and remained low, after declining sharply through the beginning of the pandemic.
Once again no sign of a meltdown.
Housing shortage in Australia – from bad to worse
There is a huge housing scandal in Australia at present – summarised by not enough of it.
But it is more complex than that.
It also concerns the total inadequacy of much of the new housing and apartment stock for the environmental challenges ahead.
There are many large apartment developments now that are demonstrating major construction flaws – some already finished, some already finished and now abandoned, and some in construction phase.
The NSW State government building standards boss was in Newcastle recently and shut down two construction sites for major breaches of the building code.
I conjecture that in 20 years many buildings that have been erected over the last 20 years will be abandoned because they are unsafe and falling apart.
Several high profile apartment towers in Sydney, for example, are already in that state and they haven’t even been occupied after construction, despite the developers making off with millions in profits and then declaring bankruptcy.
The problem here is that governments privatised the building inspection role that used to be done by public sector officials.
Now we have all these profit-seeking characters doing the checks and there is strong evidence that they get paybacks from the developers to turn a blind eye.
Some inspections of complex constructions are apparently done via Facetime, with the builder holding up a mobile phone while the inspector sits in his/her comfortable office kilometers away.
The other problem is that the constructions are not fit for purpose – highly energy inefficient.
We have hectares of farming land now being taken over by concrete and roofs with little green space left for suburbs to breathe.
The houses leak and are generally too large to be efficient.
But how is that relevant to the housing shortage?
Well, the shortage arose because neoliberal economists took over government infrastructure departments and all the ‘fiscal’ KPIs demanded surpluses.
How to pursue them?
Well, just cut back on social housing investment, which has been a major responsibility of state governments since day 1.
As the states cut back the stock of social housing – that is, housing for lower income households – has fallen way behind the demand for it.
There is an estimated gap of some 800,000 units – that is, supply shortfall relative to demand.
That is causing huge issues – rental demand is very high and the landlords are reaping massive returns, thereby reinforcing the income inequalities.
And more people are now sleeping in cars, tents and under bridges – in one of the wealthiest nations on Earth (in material terms).
So the solution is to abandon the austerity pursuit and actually start taking care of those who need our collective help.
But that would be too straight foreward for the neoliberals.
Their solution is to deregulate zoning, construction standards and all the rest of the restrictions that attempt to ensure buildings actually stay up and don’t swarm everywhere and eat up green spaces etc.
The neoliberal solution that the developers are now demanding be introduced will just make things worse and line the pockets of the developers and leave more urban blight and horrific streetscapes.
Bad decisions leading to further bad decisions.
Neoliberalism.
Music – Max Richter – The Young Mariner
This is what I have been listening to while working this morning.
It is off the soundtrack released by Deutsche Grammophone for the film Henry May Long OST, which was released on October 27, 2017 and recorded in Berlin.
The film was released in 2008 and the music scored in 2007.
This track – The Young Mariner – was number 13 of 14 on the album.
Post minimalist composer and pianist – Max Richter – is joined by:
1. Chris Worsey – cello.
2. Ian Burdge – cello.
3. John Metcalfe – viola.
4. Natalie Fuller – violin.
That is enough for today!
(c) Copyright 2023 William Mitchell. All Rights Reserved.
This Post Has 0 Comments