The Australian Bureau of Statistics (ABS) released the latest labour force data today (June 25,…
US labour market weakening – job openings fall and underemployment rises
Last Friday (July 7, 2023), the US Bureau of Labor Statistics (BLS) released their latest labour market data – Employment Situation Summary – June 2023 – which revealed that the the US labour market has probably reached a turning point but is certainly not contracting at a rate consistent with an imminent recession. There was a continuing weakening of net employment growth. Further, the weaker conditions are evidenced by the decrease in new job openings and rising underemployment (workers forced into part-time work for economic reasons).
Overview for June 2023 (seasonally adjusted):
- Payroll employment increased by 209,000 (down from 339,000 last month).
- Total labour force survey employment fell by 273 thousand net (0.17 per cent).
- The labour force rose 133 thousand net (0.08 per cent).
- The participation rate was unchanged at 62.6 per cent – third consecutive month.
- Total measured unemployment fell by 140 thousand to 5,597 thousand.
- The official unemployment rate fell 0.1 point to 3.6 per cent (on rounding).
- The broad labour underutilisation measure (U6) rose 0.2 points to 6.9 per cent – so underemployment rose.
- The employment-population ratio was unchanged at 60.3 per cent (still well below the June 2020 peak of 61.2).
For those who are confused about the difference between the payroll (establishment) data and the household survey data you should read this blog post – US labour market is in a deplorable state – where I explain the differences in detail.
Some months the difference is small, while other months, the difference is larger.
Payroll employment trends
The BLS noted that:
Total nonfarm payroll employment increased by 209,000 in June, as employment in government, health care, social assistance, and construction continued to trend up. Nonfarm employment has grown by an average of 278,000 per month over the first 6 months
of 2023, lower than the average of 399,000 per month in 2022 …Employment in government increased by 60,000 in June. Employment continued to trend up in state government (+27,000) and local government (+32,000). Overall, government has added an average of 63,000 jobs per month thus far in 2023, more than twice the average of 23,000 per month in 2022. However, government employment is below its pre-pandemic February 2020 level by 161,000, or 0.7 percent.
Health care added 41,000 jobs in June … Health care has added an average of 42,000 jobs per month thus far this year, similar to the average gain of 46,000 per month in 2022.
Social assistance added 24,000 jobs in June … averaged 22,000 per month thus far in 2023, in line with the average of 19,000 per month in 2022.
Employment in construction continued to trend up in June (+23,000). Employment in the industry has increased by an average of 15,000 per month thus far this year, compared with an average of 22,000 per month in 2022 …
Employment in professional and business services changed little in June (+21,000). Monthly job growth in the industry has averaged 40,000 thus far in 2023, down from 62,000 per month in 2022 …
In June, employment in leisure and hospitality was little changed (+21,000). This marks the third consecutive month of little employment change for this industry. Employment in the industry remains below its February 2020 level by 369,000, or 2.2 percent.
Retail trade employment changed little in June (-11,000) … Overall, employment in retail trade has shown little net change over the year.
Employment in transportation and warehousing changed little in June (-7,000) and has shown no clear trend in recent months …
In summary, a much slower month and in line with the slowdown observed from February this year, with the slightly stronger result in
May 2023 now looking like an exception.
While there is no sign of an impending recession average monthly job creation in net terms is well down on 2022.
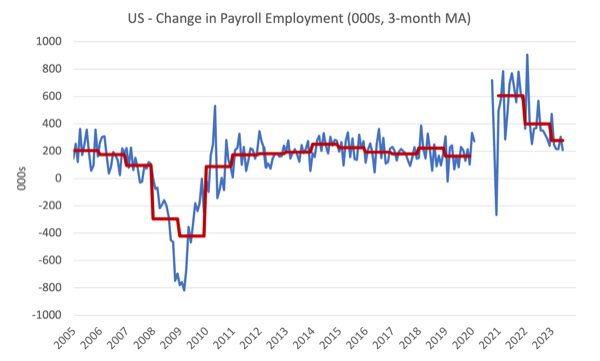
The first graph shows the monthly change in payroll employment (in thousands, expressed as a 3-month moving average to take out the monthly noise). The red lines are the annual averages. Observations between January 2020 and January 2020 were excluded as outliers.
You can see a distinct slowdown over the last two years after the surge after the initial Covid restrictions.
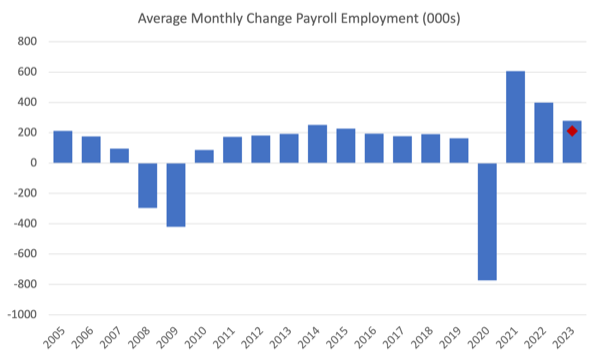
The next graph shows the same data in a different way – in this case the graph shows the average net monthly change in payroll employment (actual) for the calendar years from 2005 to 2023.
The red marker on the column is the current month’s result.
Average monthly change – 2019-2023 (000s)
| Year | Average Monthly Employment Change (000s) |
| 2019 | 163 |
| 2020 | -774 |
| 2021 | 606 |
| 2022 | 399 |
| 2023 (so far) | 278 |
Labour Force Survey data – employment up 273 thousand and unemployment down
The seasonally-adjusted data for June 2023 reveals:
1. Total labour force survey employment fell by 273 thousand net (0.17 per cent) – more or less in line with the payroll data.
2. The labour force rose 133 thousand net (0.08 per cent).
3.The participation rate was unchanged at 62.6 per cent.
4. As a result (in accounting terms), total measured unemployment fell by 140 thousand to 5,597 thousand and the official unemployment rate fell 0.1 point to 3.6 per cent (on rounding).
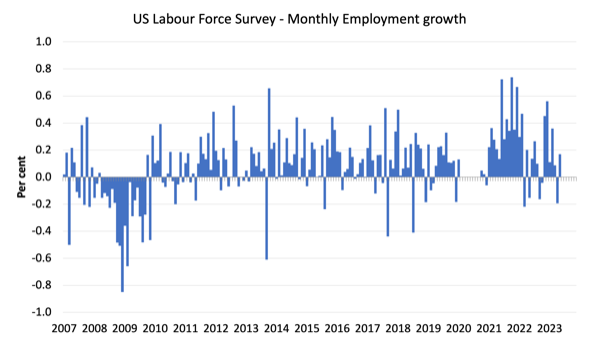
The following graph shows the monthly employment growth since January 2008 and excludes the extreme observations (outliers) between June 2020 and January 2020, which distort the current period relative to the pre-pandemic period.
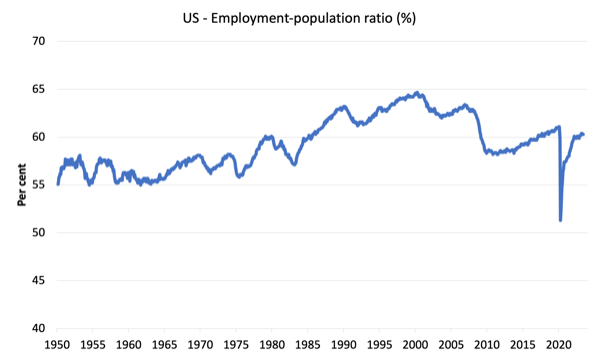
The Employment-Population ratio is a good measure of the strength of the labour market because the movements are relatively unambiguous because the denominator population is not particularly sensitive to the cycle (unlike the labour force).
The following graph shows the US Employment-Population from January 1950 to June 2023.
In June 2023, the ratio fwas unchanged at 60.3 per cent.
The peak level in June 2020 before the pandemic was 61.1 per cent.
Unemployment and underutilisation trends
The BLS note that:
Both the unemployment rate, at 3.6 percent, and the number of unemployed persons, at 6.0 million, changed little in June. The unemployment rate has ranged from 3.4 percent to 3.7 percent since March 2022 …
The number of long-term unemployed (those jobless for 27 weeks or more), at 1.1 million, changed little in June and accounted for 18.5 percent of the total unemployed …
The number of persons employed part time for economic reasons increased by 452,000 to 4.2 million in June, partially reflecting an increase in the number of persons whose hours were cut due to slack work or business conditions. Persons employed part time for economic reasons are individuals who would have preferred full-time employment but were working part time because their hours had been reduced or they were unable to find full-time jobs.
So you can see the slight weakening is first showing up in terms of restricted hours of work on offer and the rise in underemployment.
Businesses typically adjust hours of work before they start laying off workers because they can initially avoid the costs of redundancy while they assess whether the slowing sales are temporary or more entrenched.
It looks like we are seeing the first stages of the adjustment to a low level of activity.
The first graph shows the official unemployment rate since January 1994.
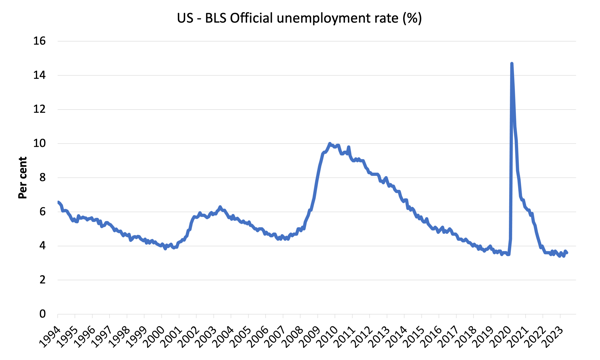
The official unemployment rate is a narrow measure of labour wastage, which means that a strict comparison with the 1960s, for example, in terms of how tight the labour market, has to take into account broader measures of labour underutilisation.
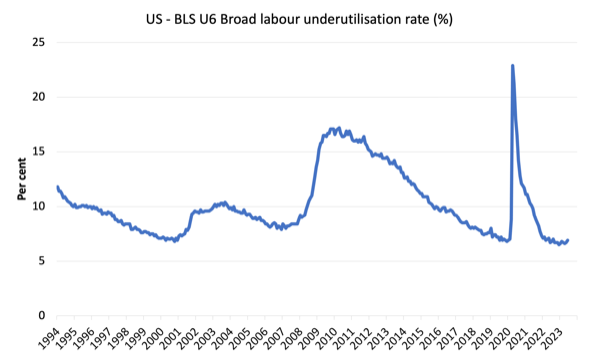
The next graph shows the BLS measure U6, which is defined as:
Total unemployed, plus all marginally attached workers plus total employed part time for economic reasons, as a percent of all civilian labor force plus all marginally attached workers.
It is thus the broadest quantitative measure of labour underutilisation that the BLS publish.
Pre-COVID, U6 was at 6.8 per cent (January 2019).
In June 2023 the U6 measure was 6.9 per cent, up by 0.2 points. It is now 0.4 points above the December 2022 level.
It has risen because of the rise in ’employed for economic reasons’, which is the US category for hours-based underemployment.
What about wages growth in the US?
The BLS reported that:
In June, average hourly earnings for all employees on private nonfarm payrolls rose by 12 cents, or 0.4 percent, to $33.58. Over the past 12 months, average hourly earnings have increased by 4.4 percent. In June, average hourly earnings of private-sector production
and nonsupervisory employees rose by 11 cents, or 0.4 percent, to $28.83.
The latest – BLS Real Earnings Summary – May 2023 (published June 13, 2023) – tells us that:
Real average hourly earnings for all employees increased 0.3 percent from April to May … This result stems from an increase of 0.3
percent in average hourly earnings combined with an increase of 0.1 percent in the Consumer Price Index for All Urban Consumers (CPI-U) …Real average hourly earnings increased 0.2 percent, seasonally adjusted, from May 2022 to May 2023.
Overall, the inflationary pressures are moderating fast, and nominal wages growth is starting to deliver modest real wage increases. A good sign
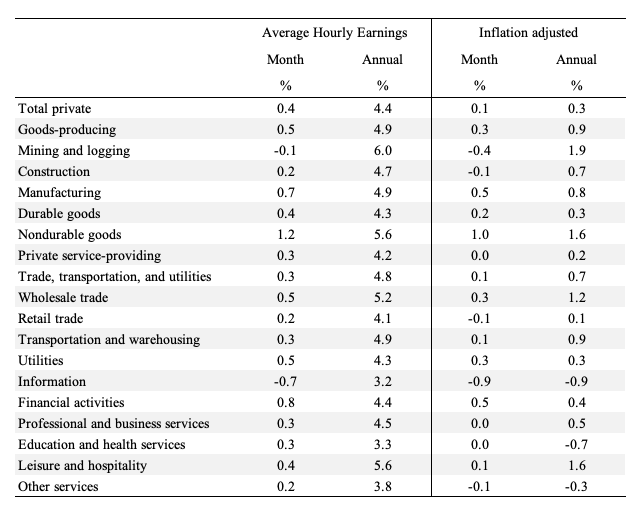
The following table shows the movements in nominal Average Hourly Earnings (AHE) by sector and the inflation-adjusted AHE by sector for June 2023 (note we are adjusting using the May CPI – the latest available).
This months marks the first since the inflationary episode began were a large number of sectors are now delivering real wage increases.
Some sectors, however, are still lagging behind.
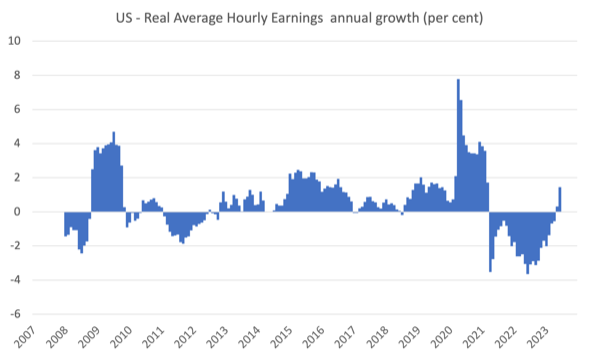
The following graph shows annual growth in real average hourly earnings from 2008 to June 2023.
The other indicator that tells us whether the labour market is turning in favour of workers is the quit rate.
The most recent BLS data – Job Openings and Labor Turnover Summary (released July 6, 2023) – shows that:
The number of job openings decreased to 9.8 million on the last business day of May … Over the month, the number of hires and total separations were little changed at 6.2 million and 5.9 million, respectively. Within separations, quits (4.0 million) increased, while layoffs and discharges (1.6 million) changed little …
In May, the number and rate of quits increased to 4.0 million (+250,000) and 2.6 percent, respectively.
So as of May 2023, the quit rate was still rising but the number of job openings has started to turn negative.
Conclusion
In June 2023, the latest US labour market data confirmed that it is now slowing although there are no immediate signs of a looming recession.
The weaker conditions are evidenced by the decrease in new job openings and rising underemployment (workers forced into part-time work for economic reasons).
That is enough for today!
(c) Copyright 2023 William Mitchell. All Rights Reserved.
Government is becoming a kind of dummy institution, as they have resigned from governing.
Everything they do is conditioned to something imposed to them by some non-elected institution (think about the EU).
In the case of the US, the true ruler is the FED, the only private central bank in the world, run by a lawyer, owned by wall street banks.
So, if interest rates damage the economy, take a toll on unemployment but wall street is happy, no big deal.
They will keep up with it.
I wonder how long will this endure, before government becomes a laughing matter?