Today (June 3, 2026), the Australian Bureau of Statistics (ABS) released the latest - Australian…
Australia national accounts – economic growth slumps to below 1 per cent annualised – unemployment on the rise
The Australian Bureau of Statistics released the latest – Australian National Accounts: National Income, Expenditure and Product, March 2023 – today (March 1, 2023), which shows that the Australian economy grew by just 0.2 per cent in the March-quarter 2023 and by 2.3 per cent over the 12 months. If we extend the March result out over the year then GDP will grow by 0.8 per cent, well below the rate required to keep unemployment from rising. Working hours dropped in the March-quarter and I expect that trend to accelerate in the coming quarters given the conduct of the central bank and treasury. The March-quarter result represents a significant decline in growth, Households cut back further on consumption expenditure while at the same time saving less relative to their disposable income in an effort to maintain consumption growth in the face of rising interest rates and temporary inflationary pressures. I expect growth to decline further and we will be left with rising unemployment and declining household wealth as a result of the RBA’s poor judgement.
The main features of the National Accounts release for the March-quarter 2023 were (seasonally adjusted):
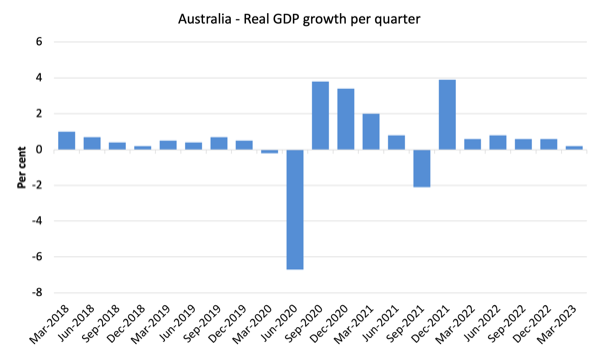
- Real GDP increased by 0.2 per cent for the quarter (down from 0.5 per cent last quarter). The annual growth rate was 2.3 per cent but the annualised March-quarter rate would only be 0.8 per cent – heading towards recession.
- Australia’s Terms of Trade (seasonally adjusted) rose by 2.8 per cent and by 0.1 per cent over the 12 month period.
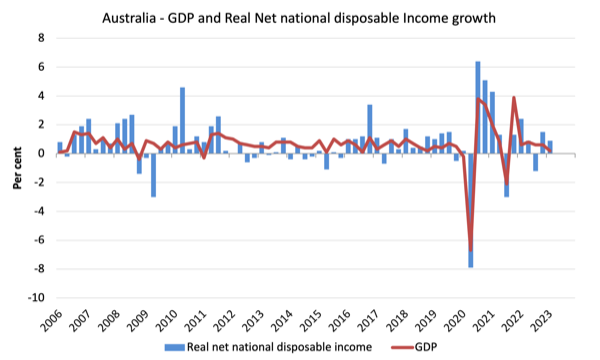
- Real net national disposable income, which is a broader measure of change in national economic well-being, rose by 0.9 per cent for the quarter and by 2.1 per cent over the 12 months, which means that Australians are better off (on average) than they were at that point 12 months ago.
- The Household saving ratio (from disposable income) fell to 3.7 per cent from 4.4 per cent. So the squeeze on household wealth is having an effect with consecutive declines in the ratio.
Overall growth picture – growth continues at much slower rate
The ABS – Media Release – said that:
Australian gross domestic product (GDP) rose 0.2 per cent (seasonally adjusted, chain volume measure) in the March quarter 2023 and by 2.3 per cent compared to March quarter 2022 …
This is the sixth straight rise in quarterly GDP but the slowest growth since the COVID-19 Delta lockdowns in September quarter 2021 …
Private and public gross fixed capital formation were the main drivers of GDP growth this quarter …
Household spending continued to slow in the March quarter 2023 …
The household saving to income ratio fell to 3.7 per cent, its lowest level since June quarter 2008 …
Net trade detracted 0.2 percentage points from GDP, as exports increased 1.8 per cent and imports rose 3.2 per cent.
The first graph shows the quarterly growth over the last five years.
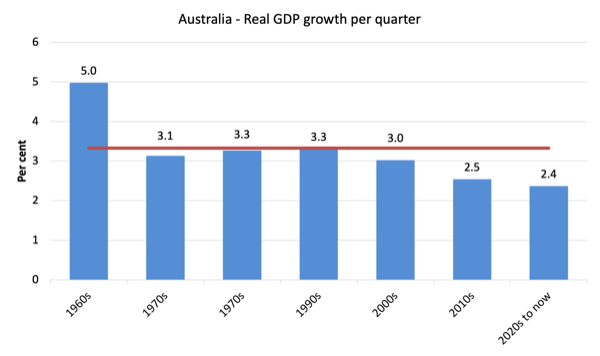
To put this into historical context, the next graph shows the decade average annual real GDP growth rate since the 1960s (the horizontal red line is the average for the entire period (3.26 per cent) from the March-quarter 1960 to the March-quarter 2008).
The 2020-to-now average has been dominated by the pandemic.
But, it is also obvious how far below historical trends the growth performance of the last 2 decades have been as the fiscal surplus obsession has intensified on both sides of politics.
Even with a massive household credit binge and a once-in-a-hundred-years mining boom that was pushed by stratospheric movements in our terms of trade, our real GDP growth has declined substantially below the long-term performance.
The 1960s was the last decade where government maintained true full employment.
Analysis of Expenditure Components
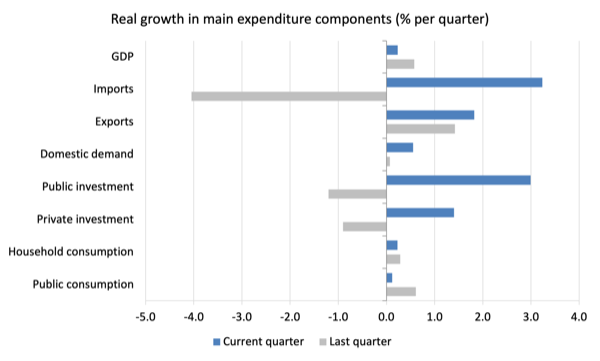
The following graph shows the quarterly percentage growth for the major expenditure components in real terms for December-quarter 2022 (grey bars) and the March-quarter 2023 (blue bars).
Points to note for the March-quarter:
1. Household Consumption expenditure rose by just 0.23 per cent (down from 0.29 per cent) – spending growth has now declined for the last three quarters at the same time that household saving is being rundown to support the current declining growth.
2. General government consumption expenditure rose by 0.12 per cent (down from 0.61 per cent). Recurrent government spending now tightening as well.
3. Private investment expenditure growth rose by 1.4 per cent after declining by 0.9 per cent in the last quarter.
4. Public investment rose by 2.99 per cent on the back of big state and local government infrastructure projects.
5. Export expenditure rose by 1.8 per cent. Imports growth was 3.2 per cent).
6. Real GDP rose by just 0.23 per cent (down from 0.6 per cent).
Contributions to growth
What components of expenditure added to and subtracted from the 0.2 per cent rise in real GDP growth in the March-quarter 2023?
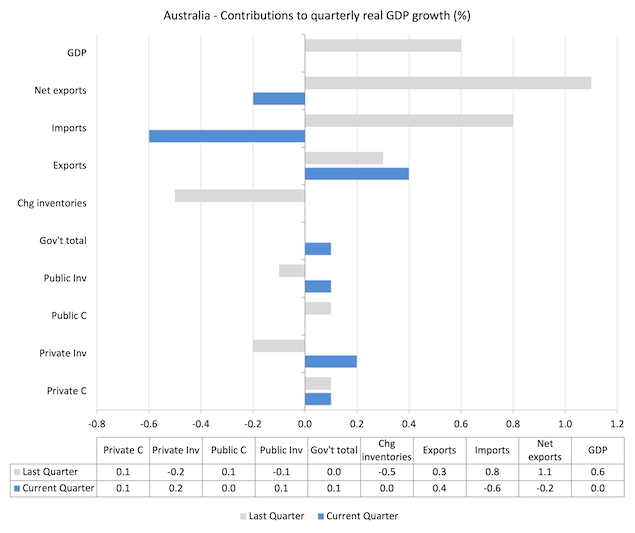
The following bar graph shows the contributions to real GDP growth (in percentage points) for the main expenditure categories. It compares the March-quarter 2023 contributions (blue bars) with the previous quarter (gray bars).
In no order:
1. Household consumption expenditure added 0.1 points to the overall growth rate (steady).
2. Private investment expenditure added 0.2 points (after subtracting 0.2 points last quarter).
3. Public consumption added 0.0 points this quarter after adding 0.1 points last quarter.
4. Public Investment added 0.1 point this quarter (after subtracting 0.1 points last quarter).
5. Overall, the government sector added 0.1 point to growth (after adding nothing last quarter).
6. Growth in inventories added nothing (after subtracting 0.5 points last quarter).
7. Net exports subtracted 0.2 points to growth with exports (+0.4 points) being overridden by rise in imports (-0.6 points) – remember imports are a drain on expenditure.
Material living standards rose modestly in March-quarter
The ABS tell us that:
A broader measure of change in national economic well-being is Real net national disposable income. This measure adjusts the volume measure of GDP for the Terms of trade effect, Real net incomes from overseas and Consumption of fixed capital.
While real GDP growth (that is, total output produced in volume terms) rose by 0.2 per cent in the March-quarter, real net national disposable income growth rose by 0.9 per cent.
How do we explain that?
Answer: The terms of trade rose from 0.3 per cent in the December-quarter to 2.8 per cent for the quarter.
The ABS noted that “The fall in import prices was driven by the global fall in oil prices and the appreciation of the Australian dollar. This was the largest quarterly fall in import prices since December 2010. The fall in export prices was led by rural and mining commodities.”
Household saving ratio fell by 0.7 points to 3.7 per cent
The ABS noted that:
The household saving to income ratio fell to 3.7 per cent, its lowest level since June quarter 2008 … This was driven by higher income tax payable and interest payable on dwellings, and increased spending due to the rising cost of living pressures … Household consumption grew faster this quarter than the rise in gross disposable income.
With inflation temporarily at elevated levels and interest rates now being pushed up by the RBA, the squeeze on income is seeing households maintaining (moderating) growth in consumption expenditure by reducing their saving rate.
Digging into savings to maintain the flow of consumption spending undermines household wealth and is a finite process, especially given the record levels of household debt.
The following graph shows the household saving ratio (% of disposable income) from the March-quarter 2000 to the current period. It shows the period leading up to the GFC, where the credit binge was in full swing and the saving ratio was negative to the rise during the GFC and then the most recent rise.
The current position is that households are being squeezed by a combination of rising living costs and interest rates and flat wages growth, which is driving a gap between income and expenditure.
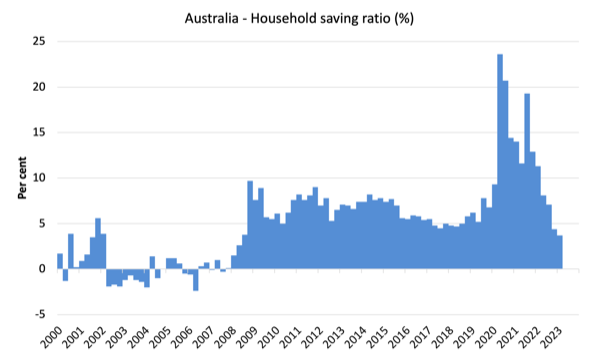
If this trend continues, Australia will go back to the pre-GFC period when the household saving ratio was negative and consumption growth was sustained by increasing debt.
However, with household debt so high, it is likely that households will cut back consumption spending and the economy will head towards recession.
It will be a deliberate act of sabotage engineered by the RBA.
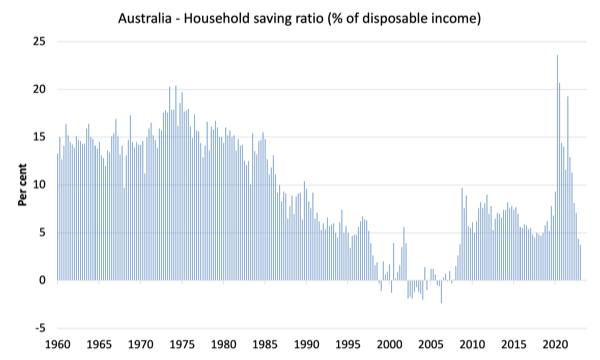
The next graph shows the household saving ratio (% of disposable income) from the March-quarter 1960 to the current period.
Back in the full employment days, when governments supported the economy and jobs with continuous fiscal deficits (mostly), households saved significant proportions of their income.
In the neoliberal period, as credit has been rammed down their throats, the saving rate dropped (to negative levels in the lead-up to the GFC).
Hopefully, households are paying off the record levels of debt they are now carrying and improving their financial viability.
The following table shows the impact of the neoliberal era on household saving. These patterns are replicated around the world and expose our economies to the threat of financial crises much more than in pre-neoliberal decades.
The result for the current decade (2020-) is the average from March 2020.
| Decade | Average Household Saving Ratio (% of disposable income) |
| 1960s | 14.4 |
| 1970s | 16.2 |
| 1980s | 11.9 |
| 1990s | 5.0 |
| 2000s | 1.4 |
| 2010s | 6.5 |
| 2020- | 12.3 |
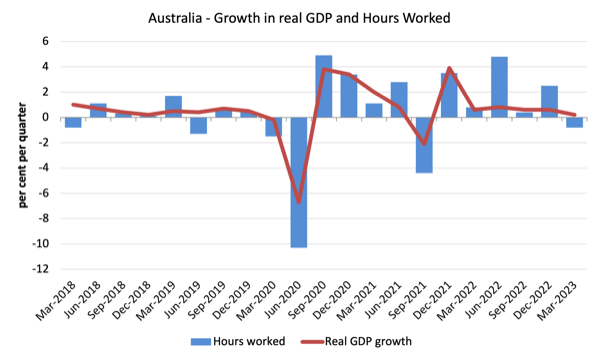
Real GDP growth rose but working hours fell
Real GDP rose 0.2 points in the quarter, while working hours fell by 0.8 per cent.
The ABS report that GDP per hours worked fell (although the previous sentence would imply that productivity rose). So there is something fishy with the data here and I expect next quarter revisions will occur.
The following graph presents quarterly growth rates in real GDP and hours worked using the National Accounts data for the last five years to the March-quarter 2023.
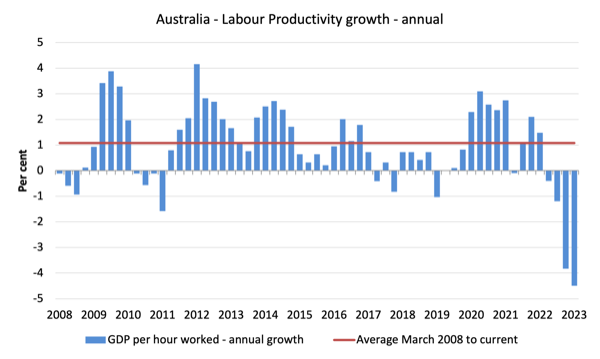
To see the above graph from a different perspective, the next graph shows the annual growth in GDP per hour worked (labour productivity) from the March-quarter 2008 quarter to the March-quarter 2023. The horizontal red line is the average annual growth since March-quarter 2008 (1.1 per cent), which itself is an understated measure of the long-term trend growth of around 1.5 per cent per annum.
The relatively strong growth in labour productivity in 2012 and the mostly above average growth in 2013 and 2014 helps explain why employment growth was lagging given the real GDP growth. Growth in labour productivity means that for each output level less labour is required.
GDP per hours worked has now fallen for the last four-quarters – a poor outcome.
The distribution of national income – mostly stable
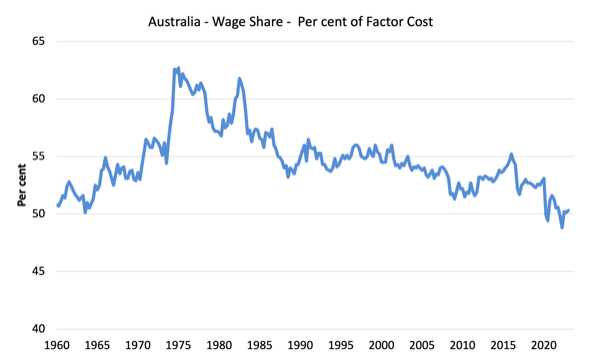
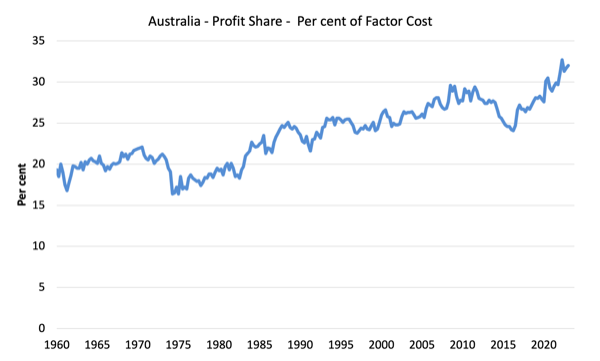
The wage share in national income rose slightly to 50.3 per cent while the profit share rose by 0.3 points as the terms of trade improved and corporations recorded record profit levels.
The share of other claimants (such as government) thus declined slightly.
But as the following graphs show, this shift is minor in the face of the recent trends.
The first graph shows the wage share in national income while the second shows the profit share.
The declining share of wages historically is a product of neoliberalism and will ultimately have to be reversed if Australia is to enjoy sustainable rises in standards of living without record levels of household debt being relied on for consumption growth.
Conclusion
Remember that the National Accounts data is three months old – a rear-vision view – of what has passed and to use it to predict future trends is not straightforward.
The data tells us that after the initial rebound from the lockdowns, growth continued to be moderate in the March-quarter.
Households are now saving less relative to their disposable income in an effort to maintain consumption growth in the face of rising interest rates and temporary inflationary pressures.
I expect growth to decline further and we will be left with rising unemployment and declining household wealth as a result of the RBA’s poor judgement.
That is enough for today!
(c) Copyright 2023 William Mitchell. All Rights Reserved.
QE was drawn to offset the losses of the elites in the aftermath of the GFC.
Massive quantities of newly “printed” money, designed to refurbish the 1% assets portfolios.
That it would end up in inflation, everyone already new back in 2008 (just imagine the Fed, the ECB, the BoE, BoJ, BoA and so on, all “printing, day and night” for 10 years).
With the help of the collaborative media (all of them), the cause could be ascribed to wage-price-spiral pressures.
All that money ended up in the real-estate business, as we should know by now, and all that asset inflation ended up spiling to the “99%’s” economy.
Many of us are earning less than we did before 2008, but the charlatans keep saying it’s a wage-price spiral.
But inflation can’t be let to run wild, because assets portfolios will crumble again if it does.
And so interest rates hiking began like crazy last year.
No point of equilibrium is beeing sought: CBs are alternating between negative rates and excessive rates, in a exceptional short period of time.
And high rates are having their toll.
Many people, already too deep into debt, fail to pay their loans.
And banks falter and fail, as we are withnessing already.
What we didn’t know yet is the role the media is having in the “failed bank” business.
The magnificient Pam Martens and Russ Martens (“Wall street on parade”) gave us a new picture of what was going on in the US banking system in 2022 (The banking crisis for the biggest US banks began In April 2022. By December 14 they had shed 457 billion of deposits, published in May 22.)
It happens that the ones that were having bank runs were not small banks, but the mega wall street banks.
Then, the media began a coordinated campaign to intoxicate minds, telling everybody that their money was not safe in the small banks, but it could be safer in the too-big-to-fail banks.
We’re living in a system that depends on lies to survive.
I wonder for how long can it hold.
Dear Bill,
Would the private banks get to a point whereby they refused to pass on the interest rate rises due to fears of mass defaults on loans? Or is it a case that they know the RBA / Government will always protect / bail them out at the expense of everyone else?
Kind Regards
Alan Dunn
@ Alan Dunn
Banks and RBA have jointly stress tested their mortgage books.
The conclusion was that if rates remain high or go higher around 25% of those loans on the books that are minimum deposit/max loan will fail. But the banks will be alright!
Just those 25% who won’t be alright. The ethical wasteland that is regulatory policy and banking sees no issue with that outcome.
So no, they are not afraid and in fact they will profit from the destruction.