The recent extreme weather in the northern hemisphere, the twin monster tropical storms in Japan,…
US labour market continues to grow as more working age people find jobs
Well, happy 2023 to all my readers. We are back for another year – the 19th in this blog’s existence. All the observers have been waiting for a sign that the US interest rate hikes are slowing the US economy down, which is the mainstream logic that has been used to justify the regressive policy shift. The data, so far, suggests that the inflationary pressures are subsiding as a consequence of the factors other than the interest rate changes which seem to have done little other than redistribute income to the rich away from the poor. The latest labour market data release from the Bureau of Labor Statistics supports that view. Last Friday (January 6, 2022), the US Bureau of Labor Statistics (BLS) released their latest labour market data – Employment Situation Summary – December 2022 – which revealed on-going employment growth, rising participation and falling unemployment. These are good signs for American workers. Further, as inflation is subsiding the modest nominal wages growth is now providing real wages growth – another virtuous sign. The latest data is certainly not consistent with the Federal Reserve type narratives. But who should be surprised by that.
Overview for December 2022 (seasonally adjusted):
- Payroll employment increased by 223,000 – slightly slower than in the previous three months.
- Total labour force survey employment rose by 717 thousand net (0.45 per cent) – a rebound on two consecutive monthly declines.
- The labour force rose by 439 thousand net (0.27 per cent).
- The participation rate rose by 0.1 point to 62.3 per cent.
- Total measured unemployment fell by 278 thousand to 5,722 thousand.
- The official unemployment rate fell by 0.1 point to 3.5 per cent.
- The broad labour underutilisation measure (U6) fell by 0.2 points to 6.5 per cent.
- The employment-population ratio rose by 0.2 points to 60.1 per cent (still well below the May 2020 peak of 61.2).
For those who are confused about the difference between the payroll (establishment) data and the household survey data you should read this blog post – US labour market is in a deplorable state – where I explain the differences in detail.
Some months the difference is small, while other months, the difference is larger.
The differences were quite large this month.
Payroll employment trends
The BLS noted that:
Total nonfarm payroll employment increased by 223,000 in December. Notable job gains occurred in leisure and hospitality, health care, construction, and social assistance. Payroll employment rose by 4.5 million in 2022 (an average monthly gain of 375,000), less than the increase of 6.7 million in 2021 (an average monthly gain of 562,000 …
In December, employment in leisure and hospitality rose by 67,000 … Employment in the industry remains below its pre-pandemic February 2020 level by
932,000, or 5.5 percent.Health care employment increased by 55,000 in December … Job growth in health care averaged 49,000 per month in 2022, considerably above the 2021
average monthly gain of 9,000.Employment in construction increased by 28,000 in December … Construction employment increased by an average of 19,000 per month in 2022, little different than the average of 16,000 per month in 2021.
Social assistance added 20,000 jobs in December … Job growth in social assistance averaged 17,000 per month in 2022, compared with the 2021 average of 13,000 per month.
Employment in the other services industry continued to trend up in December (+14,000) … Employment in other services is below its February 2020 level by 174,000, or 2.9 percent.
In December, mining employment increased by 4,000 … Since a recent low in February 2021, mining employment has grown by 104,000.
Employment in retail trade changed little in December (+9,000). Job growth in retail trade averaged 16,000 per month in 2022, less than half the average growth of 35,000 per month in 2021.
Over the month, employment in manufacturing changed little (+8,000) … In 2022, manufacturing added an average of 32,000 jobs per month, little different than the average of 30,000 jobs per month in 2021.
In December, employment in transportation and warehousing changed little (+5,000) … In 2022, average job growth in transportation and warehousing (+17,000) was about half the average job growth in 2021 (+36,000).
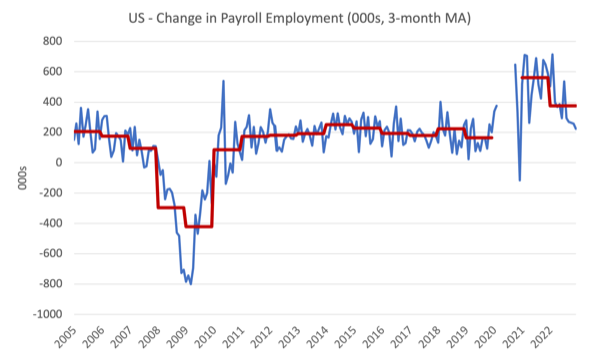
The first graph shows the monthly change in payroll employment (in thousands, expressed as a 3-month moving average to take out the monthly noise). The red lines are the annual averages. Observations between January 2020 and December 2020 were excluded as outliers.
The labour market is definitely more subdued as we enter 2023.
But no sign of collapse or significant slowdown is evident – more of an adjustment from the crazy recovery in 2021.
Further, the recovery since the pandemic job losses are not even across the sectors as detailed above.
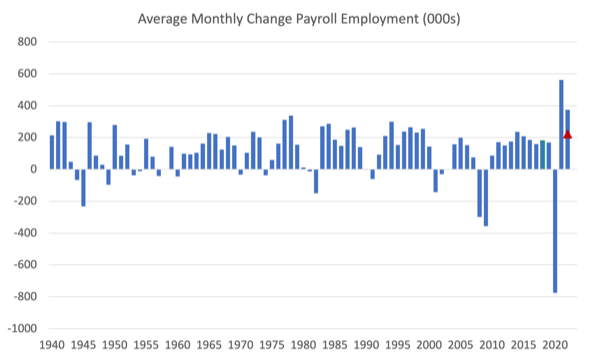
The next graph shows the same data in a different way – in this case the graph shows the average net monthly change in payroll employment (actual) for the calendar years from 2005 to 2021.
The red marker on the column is the current month’s result.
The final average for 2019 was 164 thousand.
The final average for 2020 was -774 thousand.
The final average for 2021 was 562 thousand.
The final average for 2022 is 375 thousand and fell quite quickly towards the latter part of the year.
Labour Force Survey data – employment rises and more working age people in jobs
The seasonally-adjusted data for December 2022 reveals:
1. Total labour force survey employment rose by 717 thousand net (0.45 per cent) – a rebound on two consecutive monthly declines.
2. The labour force rose by 439 thousand net (0.27 per cent).
3. The participation rate rose by 0.1 point to 62.3 per cent.
4. As a result (in accounting terms), total measured unemployment fell by 278 thousand to 5,722 thousand and the official unemployment rate fell by 0.1 point to 3.5 per cent.
It is hard to say that the labour market is tanking when we see these numbers.
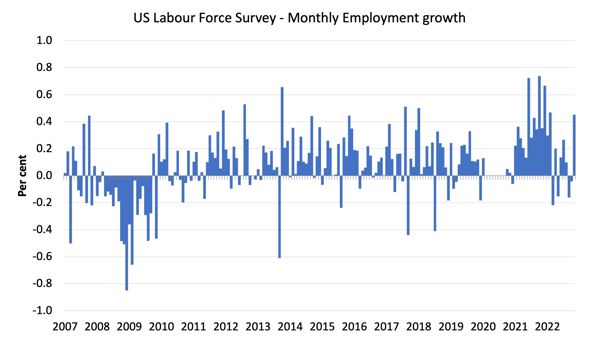
The following graph shows the monthly employment growth since January 2008 and excludes the extreme observations (outliers) between May 2020 and December 2020, which distort the current period relative to the pre-pandemic period.
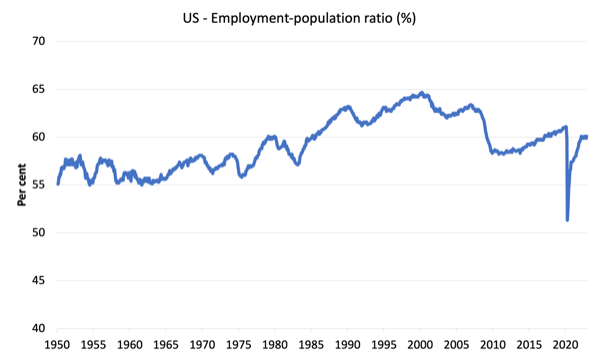
The Employment-Population ratio is a good measure of the strength of the labour market because the movements are relatively unambiguous because the denominator population is not particularly sensitive to the cycle (unlike the labour force).
The following graph shows the US Employment-Population from January 1950 to December 2022.
In December 2022, the ratio rose by 0.2 points to 60.1 per cent.
The peak level in May 2020 before the pandemic was 61.1 per cent.
But more of the working age population are now in work than at the start of 2022.
Unemployment and underutilisation trends
The BLS note that:
The unemployment rate edged down to 3.5 percent in December and has remained in a narrow range of 3.5 percent to 3.7 percent since March. The number of unemployed persons edged down to 5.7 million in December …
The number of long-term unemployed (those jobless for 27 weeks or more) declined by 146,000 to 1.1 million in December. This measure is down from 2.0 million a year earlier. The long-term unemployed accounted for 18.5 percent of all unemployed persons …
The number of persons employed part time for economic reasons, at 3.9 million, changed little in December …
The number of persons not in the labor force who currently want a job fell by 352,000 to 5.2 million in December and is little different from its February 2020 level of 5.1 million …
Unemployment fell in December because employment growth was stronger than the growth in the labour force (given the participation rate increase).
The first graph shows the official unemployment rate since January 1994.
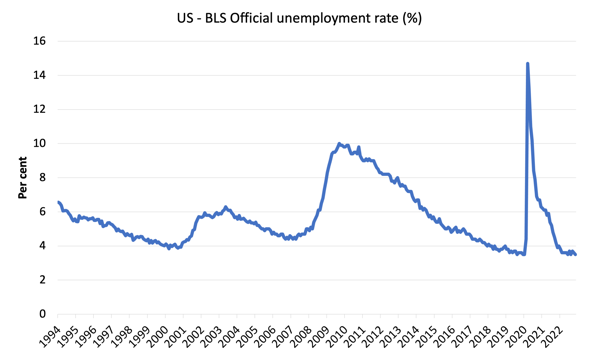
The official unemployment rate is a narrow measure of labour wastage, which means that a strict comparison with the 1960s, for example, in terms of how tight the labour market, has to take into account broader measures of labour underutilisation.
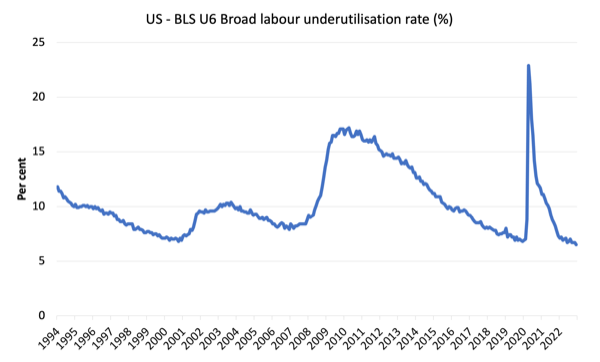
The next graph shows the BLS measure U6, which is defined as:
Total unemployed, plus all marginally attached workers plus total employed part time for economic reasons, as a percent of all civilian labor force plus all marginally attached workers.
It is thus the broadest quantitative measure of labour underutilisation that the BLS publish.
Pre-COVID, U6 was at 6.8 per cent (December 2019).
In December 2022 the U6 measure was 6.5 per cent, an decrease of 0.2 points.
What are wages doing in the US?
So the employment data doesn’t suggest that the interest rate hikes have damaged job creation in the US.
What about wages growth?
The BLS reported that:
In December, average hourly earnings for all employees on private nonfarm payrolls rose by 9 cents, or 0.3 percent, to $32.82. Over the past 12 months, average hourly earnings have increased by 4.6 percent. In December, average hourly earnings of private-sector production and nonsupervisory employees rose by 6 cents, or 0.2 percent, to $28.07.
These are modest increases.
However, the latest – BLS Real Earnings Summary (published December 13, 2022) – tells us that:
Real average hourly earnings for all employees increased 0.5 percent from October to November, seasonally adjusted … This result stems from an
increase of 0.6 percent in average hourly earnings combined with an increase of 0.1 percent in the Consumer Price Index for All Urban Consumers (CPI-U) …Real average hourly earnings decreased 1.9 percent, seasonally adjusted, from November 2021 to November 2022.
Overall, over the 12 month period while inflationary pressures were rising, wages growth failed to catch up and real wages fell. But as inflation has subsided, the wages growth is now stronger and in December real wages rose.
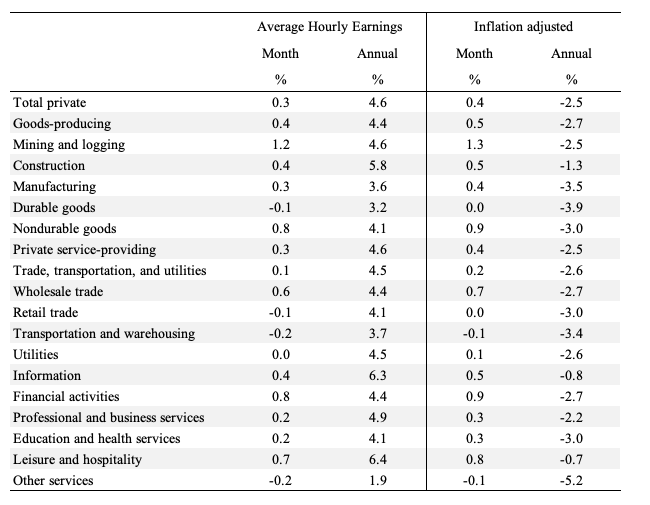
The following table shows the movements in nominal Average Hourly Earnings (AHE) by sector and the inflation-adjusted AHE by sector for December 2022 (note we are adjusting using the November CPI – the latest available).
There is considerable disparity across the sectors, with some still unable to translate nominal wage gains into real outcomes.
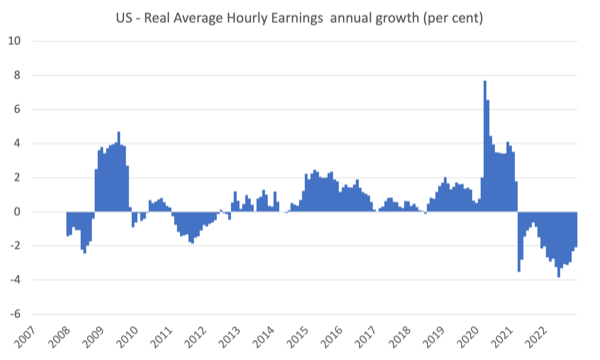
The following graph shows annual growth in real average hourly earnings from 2008 to September 2022.
The other indicator that tells us whether the labour market is turning in favour of workers is the quit rate.
The most recent BLS data – Job Openings and Labor Turnover Summary (released January 4, 2023) – shows that:
The number of job openings was little changed at 10.5 million on the last business day of November … Over the month, the number of hires and total eparations changed little at 6.1 million and 5.9 million, respectively. Within separations, quits (4.2 million) and layoffs and discharges (1.4 million) changed little …
In November, the number and rate of quits were little changed at 4.2 million and 2.7 percent, respectively.
So the US labour market is still not contracting at any significant rate which would have pushed the quit rate down.
Conclusion
In December 2022, the US labour market resisted the moderation that we had seen in the previous months and provided employment growth and a higher proportion of the working age in jobs.
Participation rose and unemployment fell – the two virtuous signs.
There are also no fundamental wage pressures emerging as the inflationary pressures subside.
That is enough for today!
(c) Copyright 2023 William Mitchell. All Rights Reserved.
In the US, an UNELECTED organ of government – the only private Central Bank in the world – is actively trying to ignite another crisis, on top of all the other crisis we’re already enduring.
In the eurozone, an UNELECTED organ of government is lobbying for commercial banks (see David Hollanders https://www.socialeurope.eu/ecb-lobbies-for-banks-instead-of-supervising-them).
Did anyone noticed the demise of democracy?
Are 6/1/2022 in the US and 8/1/2023 in Brasil that awkward?
Or is our democracy that is awkward?
A very insightful blog.
When the German industry arrives it will be even better for the US !
I’m listening to the crickets outside my window, as I imagine all the mainstream economists rushing to credit deficit spending for creating the conditions for this job-filled pandemic recovery…
When I reflected an issue with a few people I know in China, they told me that their monetary policy is not so much concerning about the inflation and hence, increasing interest rates like in the US (and many other parts of the world). They are concerned with the pandemics, the weak domestic consumptions and the GDP growth. Therefore, we see them lowering interest rates from time to time of late.
This brings us to ponder on the recent inflation phenomenon domestically and across the world, which many, and us here in this blog have attributed it to oil price rises, logistics, lack of able bodies and etc. and not so much of the wages pressure.
There, we came to understand that different countries perceived inflation differently – some as a problem, some not, when there are other more urgent issues, which is related to their macroeconomic contexts.
Now, the question still remains in general though, is there a relationship between the interest rates and inflation level? Based on the discussion above alone, one would assume yes and on, it depends solely on the context. If the inflation phenomenon is about cheap mortgages and property prices bubbles (like in 2008-9), then, raising interest rates might help. But is it the situation for the US now? Not really.
The next question is why the US in raising interest rates contradictory to the common logic and data and cause of inflation?
The only explanation one can think of is through a global context – the US has many military complexes and other interests around the world, they are paid in dollars, and to remain relevant as the currency of choice, she must keep up with the general inflation level, in this case, the ‘global inflation level’. The average around the world maybe say 5-10%, so the interest rate setting has to more or less keep up with that, so to speak.
The amount that the FED has to pay interest or the domestic economic situations are very small compared to the value and status it holds across the globe. she must remain relevant in the global financial world some how.
So I would say, in effects, the FED has to see itself as the world’s CB and it will remain so for the foreseeable future. Otherwise, someone will step in to replace, this is normal.
We end up with joking to one another ‘please pay us our military/security services bills and use our loans when you are in economic troubles, you will always be ok.
” is there a relationship between the interest rates and inflation level? ”
🙂 There are probably a few different ones.
The first remedy I can think of for supply-shock inflation is to re-grow the failed subsystetms. Those may be suppliers, supply chains, raw materials, whatever. That usually takes investment, which is stunted by high interest rates. So the reflex action by the usual suspects in financial policy is precisely the wrong one.