The recent extreme weather in the northern hemisphere, the twin monster tropical storms in Japan,…
US labour market improves but slack still remains with no wage pressures emerging
Last Friday (March 4, 2022), the US Bureau of Labor Statistics (BLS) released their latest labour market data – Employment Situation Summary – February 2022 – which reported a total payroll employment rise of only 678,000 jobs and a rise in the participation rate. Fortunately, employment growth was strong enough to drive the unemployment rate down by 0.2 points to 3.8 per cent. The US labour market is still 2,105 thousand jobs short from where it was at the end of February 2020, which helps to explain why there are no wage pressures emerging. Real wages continued to decline. Any analyst who is claiming the US economy is close to full employment hasn’t looked at the data.
Overview for February 2022:
- Payroll employment increased by 678,000.
- Total labour force survey employment rose by 1,199 thousand net (0.77 per cent).
- The seasonally adjusted labour force 1,393 thousand net (0.86 per cent).
- The employment-population ratio rose 0.2 points to 59.9 per cent (down from February 2020 peak of 61.1 per cent).
- Official unemployment fell by 243 thousand to 6,270 thousand.
- The official unemployment rate fell by 0.2 points to 3.8 per cent.
- The participation rate rose by 0.1 points to 62.3 per cent.
- The broad labour underutilisation measure (U6) rose by 0.1 points to 7.2 per cent as underemployment increased.
For those who are confused about the difference between the payroll (establishment) data and the household survey data you should read this blog post – US labour market is in a deplorable state – where I explain the differences in detail.
Some months the difference is small, while other months, the difference is larger.
Payroll employment trends
The BLS noted that:
Total nonfarm payroll employment rose by 678,000 in February but is down by 2.1 million, or 1.4 percent, from its pre-pandemic level in February 2020. Job growth was widespread over the month, led by gains in leisure and hospitality, professional and business services, health care, and construction …
Employment in leisure and hospitality continued to increase, with a gain of 179,000 in February … Since February 2020, employment in leisure and hospitality is down by 1.5 million, or 9.0 percent …
Professional and business services added 95,000 jobs in February … is 596,000 higher than in February 2020 …
Employment in health care rose by 64,000 in February … is down by 306,000, or 1.9 percent, from its level in February 2020.
Construction added 60,000 jobs in February … is slightly below (-11,000) its February 2020 level.
Employment in transportation and warehousing increased by 48,000 in February and is 584,000 higher than in February 2020 …
Employment in retail trade rose by 37,000 in February … is 104,000 above its level in February 2020.
Manufacturing added 36,000 jobs in February … … Since February 2020, manufacturing employment is down by 178,000, or 1.4 percent.
In February, employment in financial activities rose by 35,000 … is 31,000 above its level in February 2020.
Social assistance added 31,000 jobs in February … Since February 2020, employment in social assistance is down by 152,000, or 3.5 percent.
Employment increased by 25,000 in the other services industry in February … is down by 317,000, or 5.3 percent, from its level in February 2020.
Wholesale trade added 18,000 jobs in February; employment in the industry is 113,000, or 1.9 percent, lower than in February 2020.
Mining employment rose by 9,000 in February … has grown by 62,000 since a recent low in February 2021.
Employment showed little or no change over the month in information and government.
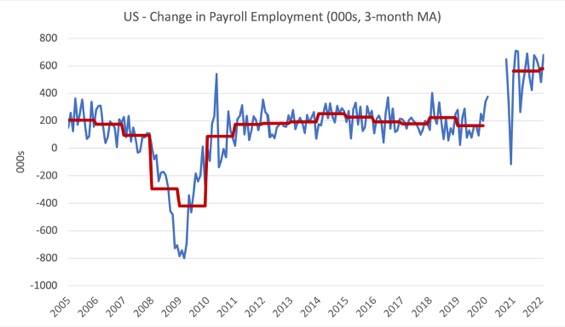
The first graph shows the monthly change in payroll employment (in thousands, expressed as a 3-month moving average to take out the monthly noise). The red lines are the annual averages. I left out the observations between January 2020 and September 2020, which were so extreme that they make it harder to compare the current period with the pre-pandemic history.
The US labour market is still 2,105 thousand jobs short from where it was at the end of February 2020 and the commentary from the BLS above tells us how this shortfall is distributed across the sectors.
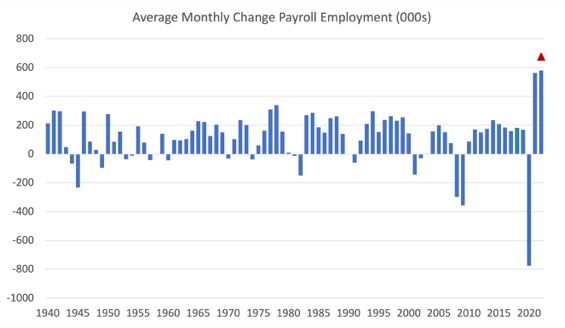
The next graph shows the same data in a different way – in this case the graph shows the average net monthly change in payroll employment (actual) for the calendar years from 2005 to 2021.
The red marker on the column is the current month’s result.
The final average for 2019 was 164 thousand.
The final average for 2020 was -774 thousand.
The final average for 2021 was 562 thousand.
The average so far in 2022 is 580 thousand.
Labour Force Survey – employment growth accelerates as does participation
The data for February 2022 reveals:
1. Total labour force survey employment rose by 548 thousand net (0.35 per cent).
2. The seasonally adjusted labour force 304 thousand net (0.19 per cent).
3. The participation rate rose by 0.1 points to 62.3 per cent.
4. As a result (in accounting terms), total measured unemployment fell by 243 thousand to 6,270 thousand and the unemployment rate fell by 0.2 points to 3.8 per cent.
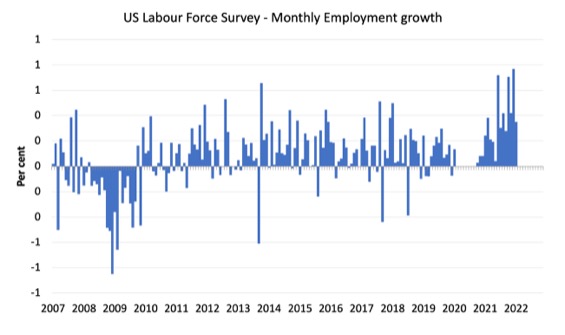
The following graph shows the monthly employment growth since January 2008 and excludes the extreme observations (outliers) between March 2020 and October 2020, which distort the current period relative to the pre-pandemic period.
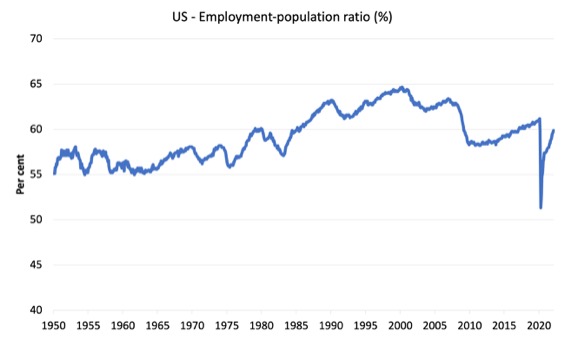
The Employment-Population ratio is a good measure of the strength of the labour market because the movements are relatively unambiguous because the denominator population is not particularly sensitive to the cycle (unlike the labour force).
The following graph shows the US Employment-Population from January 1950 to February 2022.
While the ratio fluctuates a little, the April 2020 ratio fell by 8.6 points to 51.3 per cent, which is the largest monthly fall since the sample began in January 1948.
In February 2022, the ratio rose by 0.2 points to 59.9 per cent.
It is still well down on the level in February 2020 (61.1 per cent).
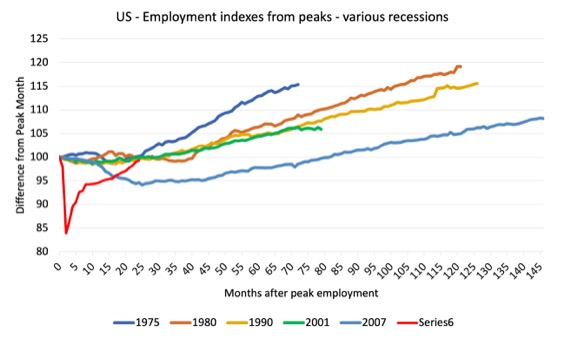
As a matter of history, the following graph shows employment indexes for the US (from US Bureau of Labor Statistics data) for the five NBER recessions since the mid-1970s and the current 2020-COVID crisis.
They are indexed at the employment peak in each case and we trace the data out for each episode until one month before the next peak.
So you get an idea of:
1. The amplitude (depth) of each cycle in employment terms.
2. The length of the cycle in months from peak-trough-peak.
The early 1980s recession was in two parts – a short downturn in 1981, which was followed by a second major downturn 12 months later in July 1982 which then endured.
Other facts:
1. Return to peak for the GFC was after 78 months.
2. The previous recessions have returned to the 100 index value after around 30 to 34 months.
3. Even at the end of the GFC cycle (146 months), total employment in the US had still only risen by 8.3 per cent (since December 2007), which is a very moderate growth path as is shown in the graph.
The COVID collapse was something else but the recent gains are evident.
After 24 months, total employment is still 0.7 points below the February 2020 level.
Unemployment and underutilisation trends
The BLS note that:
In February, the unemployment rate edged down to 3.8 percent, and the number of unemployed persons edged down to 6.3 million. In February 2020, prior to the coronavirus (COVID-19) pandemic, the unemployment rate was 3.5 percent, and the number of unemployed persons was 5.7 million …
The number of long-term unemployed (those jobless for 27 weeks or more) was essentially unchanged at 1.7 million. This measure is 581,000 higher than in February 2020. The long-term unemployed accounted for 26.7 percent of the total unemployed in February 2022 …
The number of persons employed part time for economic reasons increased by 418,000 to 4.1 million in February but remains below its February 2020 level of 4.4 million …
In February, employment growth was strong enough to outpace the growth in the labour force driven by a slight rise in the participation rate and so unemployment fell.
It is clear that the unemployment rate can go lower yet before wage pressures emerge (see below).
The first graph shows the official unemployment rate since January 1994.
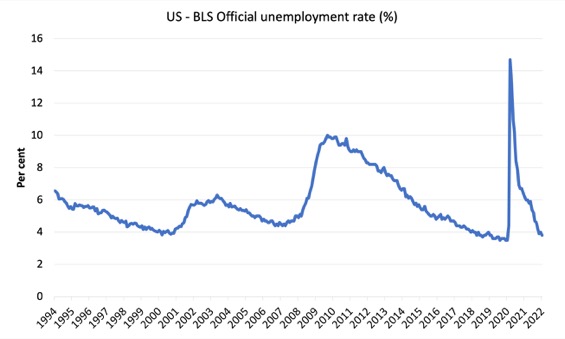
The official unemployment rate is a narrow measure of labour wastage, which means that a strict comparison with the 1960s, for example, in terms of how tight the labour market, has to take into account broader measures of labour underutilisation.
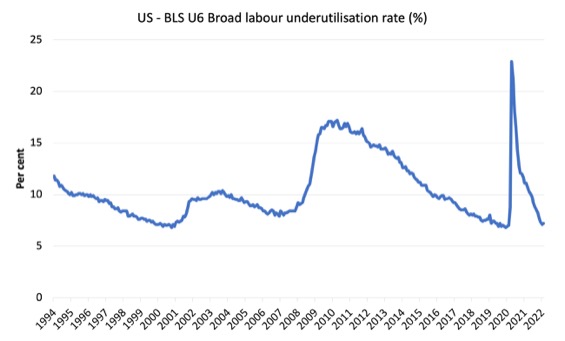
The next graph shows the BLS measure U6, which is defined as:
Total unemployed, plus all marginally attached workers plus total employed part time for economic reasons, as a percent of all civilian labor force plus all marginally attached workers.
It is thus the broadest quantitative measure of labour underutilisation that the BLS publish.
Pre-COVID, U6 was at 6.8 per cent (December 2019).
In February 2022 the U6 measure was 7.2 per cent, a rise of 0.1 points on the previous month.
The rise is mostly due to the rise in the workers in the ‘part-time for economic reasons’ cohort (the US indicator of underemployment).
So while official unemployment fell, underemployment rose.
Ethnicity and Education
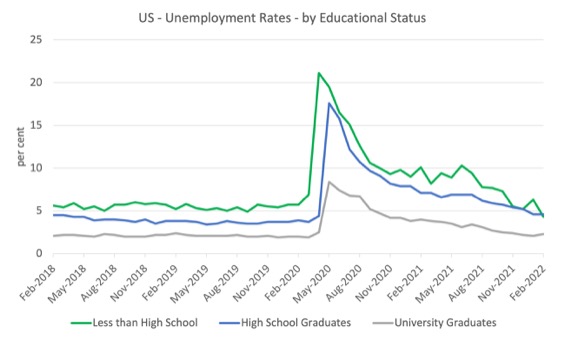
The next graph shows the evolution of unemployment rates for three cohorts based on educational attainment: (a) those with less than high school completion; (b) high school graduates; and (c) university graduates.
The unemployment rate for a person with a university degree is 2.2 per cent, while the other groups are around double that rate.
In the collapse in employment in the early months of the pandemic, the unemployment rates rose by:
- 14.2 points for those with less than high-school diploma.
- 13.2 points for high school, no college graduates.
- 5.9 points for those with university degrees.
The period since April 2020 has seen the unemployment rate fall by:
- 16.8 points for those with less than high-school diploma meaning the unemployment rate is now 1.7 points below the March 2020 level.
- 13.2 points for high school, no college graduates meaning the unemployment rate is now 0.2 points above the March 2020 level.
- 5.9 points for those with university degrees meaning the unemployment rate is now 0.4 points below the March 2020 level.
In the last month, the change in the unemployment rate has been:
- a fall of 2 points for those with less than high-school diploma.
- a fall of 0.1 points for high school, no college graduates.
- a fall of 0.1 points for those with university degrees.
In the US context, the trends in trends in unemployment by ethnicity are interesting.
Two questions arise:
1. How have the Black and African American and White unemployment rate fared in the post-GFC period?
2. How has the relationship between the Black and African American unemployment rate and the White unemployment rate changed since the GFC?
Summary:
1. All the series move together as economic activity cycles. The data also moves around a lot on a monthly basis.
2. The Black and African American unemployment rate was 6.8 per cent in March 2020, rose to 16.6 per cent in May 2020 and is at 6.6 per cent in February 2022. In the last month, it was fell by 0.3 points, the second consecutive month of decline.
3. The Hispanic or Latino unemployment rate was 6 per cent in March 2020, rose to 18.9 per cent in April and is at 4.4 per cent in February 2022. In the last month, it fell by 0.5 points.
4. The White unemployment rate was 3.9 per cent in March 2020, rose to 14.1 per cent in April and rose to 3.3 per cent in February 2022. In the last month, it rose by 0.1 points.
5. As the labour market tightens, the more disadvantaged groups get sucked back into employment as employers are forced to abandon prejudices.
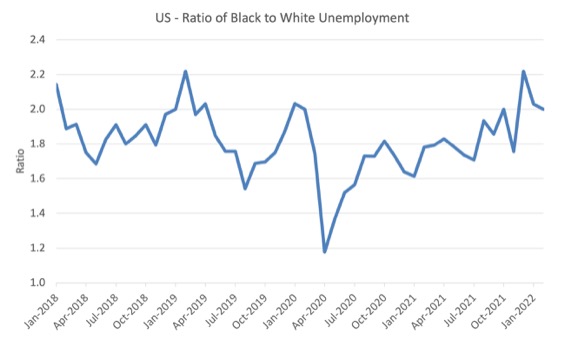
The next graph shows the Black and African American unemployment rate to White unemployment rate (ratio) from January 2018, when the White unemployment rate was at 3.5 per cent and the Black or African American rate was at 7.5 per cent.
This graph allows us to see whether the relative position of the two cohorts has changed since the crisis.
If it is rising, then the unemployment rate of the Black and African American cohort is either rising faster than the white unemployment rate or falling more slowly (or a combination of that relativity).
While there is month-to-month variability, the data shows that, in fact, through to mid-2019, the position of Black and African Americans had improved in relative terms (to Whites), although that just reflected the fact that the White unemployment was so low that employers were forced to take on other ‘less preferred’ workers if they wanted to maintain growth.
In April 2019, the ratio was 2.1 (meaning the Black and African American unemployment rate was more than 2 times the White rate).
By April 2020, the ratio had fallen to its lowest level of 1.2, reflecting the improved relative Black and African American position.
As the pandemic hit, the ratio rose and peaked at 1.8 in October 2020.
In February 2022, the ratio was 2, which is just below the observation from the previous month, which indicates that the relative position of the Black and African American cohort has improved a little further.
Special analysis this month – What are wages doing in the US?
Inflation mania is loose now and the economic media is running stories about a return to the 1970s.
One of the ways of assessing whether the US economy is close to full employment is to examine the growth in wages, which tells us whether the supply-side of the labour market (workers) is enjoying gains in bargaining power.
With the unemployment rate continuing to fall, has this promoted an acceleration in wages growth, which might reinforce the supply chain price pressures?
The BLS reported that:
Average hourly earnings for all employees on private nonfarm payrolls, at $31.58 in February, were little changed over the month (+1 cent), after large increases in recent months. Over the past 12 months, average hourly earnings have increased by 5.1 percent. In February, average hourly earnings of private-sector production and nonsupervisory employees rose by 8 cents to $26.94.
The following graph shows the annual hourly earnings growth for all private employees since March 2007.
There is no accelerating trend.
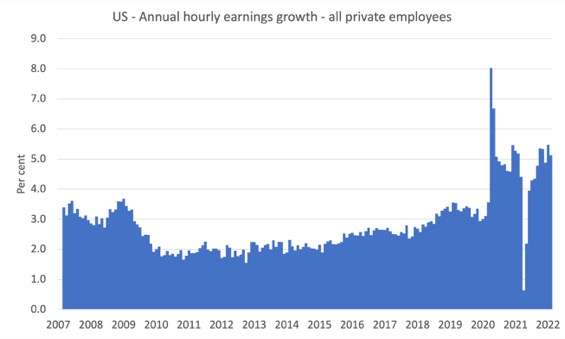
Note that the above graph is in nominal terms.
The – BLS Real Earnings Summary (published February 10, 2022) – tells us that:
Real average hourly earnings for all employees increased 0.1 percent from December to January, seasonally adjusted … This result stems from an
increase of 0.7 percent in average hourly earnings combined with an increase of 0.6 percent in the Consumer Price Index for All Urban Consumers (CPI-U) …Real average weekly earnings decreased 0.5 percent over the month due to the change in real average hourly earnings combined with a decrease of 0.6 percent in the average workweek.
Real average hourly earnings decreased 1.7 percent, seasonally adjusted, from January 2021 to January 2022. The change in real average hourly earnings combined with a decrease of 1.4 percent in the average workweek resulted in a 3.1-percent decrease in real average weekly earnings over this period.
So, over the year to January 2022, real earnings are significantly lower.
Workers are not catching up with the price level rises and can hardly be said to be pressuring inflation.
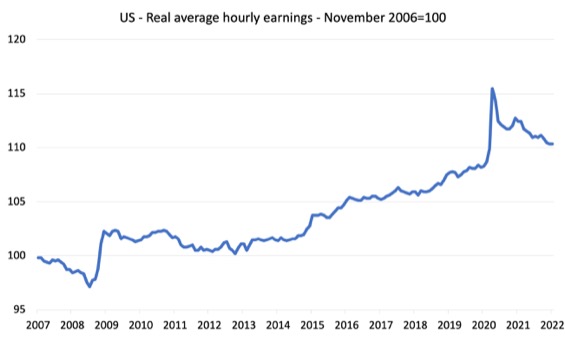
The following graph shows movements in real average hourly earnings (indexed at 100 the pre-GFC peak – November 2006) up to January 2022 tells the story.
The spike in the early period of the pandemic was the result of hours adjustments rather than earnings growth.
And, from the latest – Productivity and Costs, First Quarter 2021, Revised (published March 3, 2022) – report, we find that:
Nonfarm business sector labor productivity increased 6.6 percent in the fourth quarter of 2021 … as output increased 9.1 percent and hours worked
increased 2.4 percent … From the fourth quarter of 2020 to the fourth quarter of 2021, nonfarm business sector labor productivity increased 1.9 percent … Annual average productivity increased 1.9 percent from 2020 to 2021.
So real hourly earnings growth is still lagging behind the annual productivity growth, which is another sign of labour market slack and weak bargaining power.
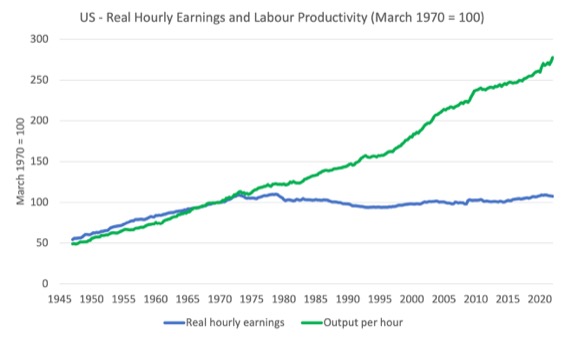
The following graph tells the story.
It showws real hourly earnings and labour productivity (output per hour) indexed at 100 in the March-quarter 1970 (around the time the two series started to diverge).
Workers have enjoyed hardly any real wages growth since 1970 (rising by just 7.6 per cent) whereas productivity growth has risen by 177 per cent.
There has been a massive redistribution of national income away from workers towards profits over this long period.
In one graph you see the failure of the US economy to serve its people.
Conclusion
The US labour market was much stronger in February 2022 with participation rates rising along with robust employment growth.
The lower unemployment rate was at the cost of rising underemployment.
The US labour market is still 2,105 thousand jobs short from where it was at the end of February 2020.
The employment-population ratio is still well down on the February 2020 peak.
There are no fundamental wage pressures emerging at present despite the spikes in inflation arising from supply chain constraints.
The US labour market is still some way from being at full employment.
That is enough for today!
(c) Copyright 2022 William Mitchell. All Rights Reserved.
Morning Bill,
I could be wrong and a million miles away but…….
It will be interesting to see the effect the war sanctions will have not just on Russia but on the West. If there is not a nuclear war as it is escalating quite quickly.
Russia and the West have become quite integrated over the years. There are some analysts saying the reason why Russia hasn’t set sanctions of their own yet is because of this relationship.
However, the brutality of the sanctions imposed, has now given Russia the chance to decouple and completely pivot towards Asia. Which politically a month ago would have been quite a hard thing to have pushed through. Once the decoupling is complete then we might see some sanction imposed by Russia.
The Ukrainian army and the neo Nazi battalions care completely surrounded in 3 different cauldrons across Eastern Ukraine and in many different cities. So the war is just about over. Even with a peace deal this week or sometime in the near future. I simply can’t see a return to normal.
There will be no peace deal until Ukraine agree to completely denazify the country in the West and get rid of all the weapons and sign something like the Minsk agreement. Of course this funding from Washington will have to stop. With another ban in place that was removed in Jan 2016.
https://www.thenation.com/article/politics/congress-has-removed-a-ban-on-funding-neo-nazis-from-its-year-end-spending-bill/
I can’t see how Russia will allow the ” far right ” areas of Western Ukraine to keep being funded and armed by NATO. Or we will all be back here in a few years time. With Eastern Ukraine constantly being under attack. It’s more likely that Russia will push the neo Nazi brigades back into Poland and Hungary as refugees if no peace deal is signed. Secure the Ukrainian border then exit.
Then try and create a neutral independent Ukraine as a buffer between Russia and Nato. Giving Western Ukraine a veto against joining Russia. Eastern Ukraine a veto against joining NATO. With both parts having equal membership in the parliament.
The world has changed from a month ago. I can’t see it going back to the way it was Bill. It is going to be very different and like the book 1984 we will now have 3 main areas. The world wide web is over it is going to become regional in nature after all the censorship and free speech that has been rolled back in the last fortnight.
Economic sanctions are going to work both ways. We just haven’t seen what they are going to be from Russia yet. The MMT lens is going to be a useful as ever.
Recently, Adam Tooze wrote one of his chartbooks, where he considered the eventual turn of the russian monetary system to MMT, now that russian banks have been cut off from the dollar system (https://adamtooze.substack.com/p/chartbook-91-what-if-putins-war-regime?s=r).
And so, the question of the “independence” of the Russian central bank sprung up immediately.
Nobody tries to deny it anymore: “independence” means dependence to the dollar system, and to the head of the dollar system – wall street banks, including the NY Fed, which is beeing run by wall street, since Volcker took charge, more than 40 years ago.
The Russian central bank is beeing run by very conservative people, which explains why interest rates have gone up to about 20% a few days ago.
But, what if Putin kicks of the lady that is running the Russian Central Bank and starts to ditch all of the mainstream fiction?
Maybe the sanctioners can’t see this as possibel. Too off the mark to be considered.
Trump was too off the mark too, and still… 6 of january of 2020 was unthinkable and still…
Everybody talks about the swift system, but there is already an alternative – the CIPS.
Wall street doens’t control CIPS and some say the CIPS might be getting big time, as too many people are getting sanctioned by wall street, which translates to “not very secure – anyone can be cut off of their savings accounts denominated in US dollars” (and remember that nobody gets rich with wages, so we are talking of a lot of “suspicious money”).
If it happens, what would become of the neoliberal system and its main tool of domination, the US dollar?
Could it withstand the shock?
Would Russia be country the first to apply MMT? (I don’t consider Japan to be applying MMT, as they are “printing money” to the elites, by the QE scheme, which is just a recycled form of the “trickle down” trope).
Would Russia be able to make it sucessful, as it would be implementing MMT in a war economy? (Keynes implemented Keynesianism in a war economy, so maybe it could…).
The Ukraine war goes far behond the human rights violation issue.
Many people that are now voicing their hate to the Russians, are the same that don’t give a damn about the African and Asian migrants, that are still getting drowned in the mediterranean, trying to get to europe.
And many of them are fleeing from wars promoted by the well intentioned western countries we see now imponsing sanctions on the Russians and selling weapons to Ukraine (and borrowing money, as the UE and the UK are doing, which will have to be repaid, with interest).
Maybe this war is a civilizational shock and maybe it won’t stop when (and if) the Russians get to Kyiv.
The media histerism is very worrying, as they are beeing used as a propaganda vehicle, to intoxicate, as they did during the pandemic (which is over now, as if some kind of miracle just happened).
Some say that the Ukrainian war began in 2014, and now we’re seeing it’s final episode.
Everything points that way.
Unfortunately and as ever happened before, it’s the people that suffers.
The ones that “cooked” this war are far away from the katyuskas, trying to make a profit out of it.
Derek,
“Then try and create a neutral independent Ukraine as a buffer between Russia and Nato.”
That one is worth a big belly laugh.
Prof Bill,
I don’t know how you find the time and energy to produce work like this. Some might think that the best thing to come out of Australia in the last 30 years is MMT. Maybe. There are some who would say Michele Jenneke.
That’s exactly what the Minsk agreement would have done Henry.
Maybe you should write to your MP or Senator and ask them why they didn’t agree to sign it. Decided to go down the route of funding Neo Nazis in Western Ukraine instead and allowing them to bomb Eastern Ukraine for 7 years.
If the Minsk agreement has been signed wouldn’t even be in this mess. Not turned the place into a an Ireland, India or Yugoslavia.
Divide and conquer is all they know Henry. Straight out of the British Empire handbook 101.
At least the children in Yemen and Syria and Palenstine are going to start waving Ukrainian flags now to see if they get noticed.
The sheer blatant hypocrisy has been gut wrenching to watch. Never mind free speech being rolled back the way it has been.
The facts that the US invaded several countries or that Israel is illegally occupying Palestinian land does not cancel the war crimes committed by Vladimir Putin’s regime, which are of a different order of magnitude. Just because there are neo-Nazis in Ukraine or because Russia has disputable historic rights to some areas in Ukraine does not mean that they can destroy Kyiv (Kiev), Kharkiv (Kharkov) and other cities, mass-murdering innocent civilians. On top of that Putin has threatened neighbouring countries with nukes and his troops have attacked nuclear power plants. I cannot comprehend the naivety of these armchair commentators, who still believe in Russian government propaganda about the presence of Nazis in Ukraine as the root cause of the war, giving the Russian troops an excuse to murder innocent people. Russian propagandists are seeding postmodern relativism among so-called progressive Westerners, who dislike the current global order. We don’t need this stuff here, I can read “Русская весна” (a Russian propaganda website) in original. The truth is that Putin is quickly becoming another Stalin, threatening not just Ukraine or Poland but the whole world with nuclear destruction. Putin needs to be stopped at any cost lower than the crimes against humanity he is committing. I also dislike the Americans and I am not a supporter of Ukrainian nationalists or oligarchs. We can attribute the turn towards the policies of Ivan the Terrible to the effects of exploitation of Russia by the West after 1991. But so what, one cannot sit on the fence and one must understand the gravity of situation. If there is no other choice, Pax Americana, neoliberalism and the global domination of capitalism are still better than the repetition of the siege of Leningrad being replayed in Ukrainian (and later, Lithuanian or Polish) cities. We can deal with neoliberalism later, once Putin is defeated… Arguing that as a result of the war, Russia may become a proving ground for MMT-inspired policies is as good as arguing that Albert Speer had sound understanding of economics. Putin still hasn’t reopened Gulag but if for example he nukes Warsaw, the number of victims will be of the same magnitude. There is a Polish saying that if one has nothing wise to say, it is better to say nothing.
Derek,
have you thought about reading what actual leftist ukranians have to say about their own country, and the far-right problem? Or you, Henry, about NATO? Just a thought.
https://crimethinc.com/2022/02/15/war-and-anarchists-anti-authoritarian-perspectives-in-ukraine
https://www.dissentmagazine.org/online_articles/a-letter-to-the-western-left-from-kyiv
As to MMT in Russia, you’d have to assume a level of competence and caring that Putin never showed, so, good luck with that. It obviously depends on what, exactly, are the day to day needs, because economics doesn’t survive without, say, food, water and power.
Paulo,
“Or you, Henry, about NATO? ”
Where do you think Europe would be without NATO?
Paulo
Can you not answer the question directly?
In the article you linked above (War and anarchists anti authoritarian perspectives in Ukraine), the writers say:
“Russia has long-term plans to destroy democracy in Europe.”
Should Europe allow Russia to destroy its democracy?
Henry,
I don’t think NATO existing proves TINA is real; countries could have had, and still can and should have, defense pacts without the ideological hegemonic bagage. European countries have more than enough resources for that that they don’t need to agree to go on quagmires against non-Europe.
“Should Europe allow Russia to destroy its democracy?”
You don’t need Putin to do that, the europhiles are great at destroying European democracies!
And there is no European democracy, there are European democracies, if you want an European democracy you have to create it first, but Germany will never allow such a thing, the current situation is what Germany’s oligarchs want, in this way Germany can continue to abuse its european “partners”…
I don’t think austerity is good enough glue to maintain the farce called “European Union”.
When the Euro farce falls apart, you can always blame Putin!
Paulo,
History proves otherwise and the Soviets had an equal of share of “ideological hegemonic bagage”.
Given the destruction, enmities and nature of WWII there is no way the Europeans would have been able to organize in the face of a nuclear armed Soviet Union.
As it was, even with NATO, the Soviets were able to occupy East Germany and effectively eastern Europe – they rolled the tanks into Hungary and Czechoslovakia at will.
In recent years, Russia took bits of Georgia with impunity and now is terrorizing and murdering Ukrainians in the face of a “powerful” NATO.
You comments are completely ill-considered.
Derek would be a local Commissar doing double work as the local business agent for the Moscow based kleptocrat who owned North Sea oil concessions offshore Scotland. He would have never sampled whiskey or haggis and would have a strong acquaintance with the pleasures of vodka and caviar. 🙂
Henry,
I have a hard time seeing Soviet/Russian leadership having much of an ideology for a long, long time, other than putting themselves first.
Distraction aside, the Cold War was a long time ago, and what Russia has to show is this pathetic logistical quagmire against one opponent who barely has any modern capability. I think European countries would be fine with their own alliance without having to sell their souls supporting the hegemony’s good sons of bitches, even if not officially due to the treaty, with accompanying costs and lost opportunities as well. It’s bad enough we support our own.