I started my undergraduate studies in economics in the late 1970s after starting out as…
GDP is growing but further stimulus is required
So today’s National Accounts data offers us a rear-vision mirror view of where the Australian was between April and June of this year. To some extent events have overtaken the relevance of this information. More recent news in the past week indicates that right now we are even further advanced in recovery than the June National Accounts data is indicating. But be warned. Not everything is what it seems to be.
First, here are the headlines this afternoon:
Rate rise looms after GDP spurt (Sydney Morning Herald)
Robust growth may spark RBA rate rise (The Australian)
Pre-Christmas rate rise likely (ABC News)
I didn’t read a single word about the fact that unemployment and underemployment will continue rise over the next 12 months due to the inadequate GDP growth rate. The GDP growth is marginally positive – yes but still appallingly low in terms of the requirements for people to have stable employment and steady incomes.
All the bank economists today are talking up rate rises because it gives their organisations wider spreads across the yield curve.
Anyway, the major points noted by the ABS in its release were
- GDP increased by 0.6 per cent (seasonally adjusted) in the June quarter with non-farm GDP growing by 1.1 percent. The terms of trade fell by 7.4 per cent which impacts on our export revenue.
- Real gross domestic income fell 1.1 per cent in the June quarter
- The main positive contributors to expenditure on GDP were New machinery and equipment (0.5 percentage points) and Household final consumption expenditure (0.5 percentage points). The largest negative contributors were New building construction (-0.3 percentage points) and Imports (-0.5 percentage points).
What this means is that our economy has officially avoided a recession because there has not been two consecutive quarters of negative GDP growth. However, this is moot in my opinion because the labour market deterioration is severe and warrants the descriptor – recession.
It also means that Australia is out of step with the other English-speaking economies and the major European economies.
So what is going on? You will not see the following graphs in the newspapers or in other blogs.
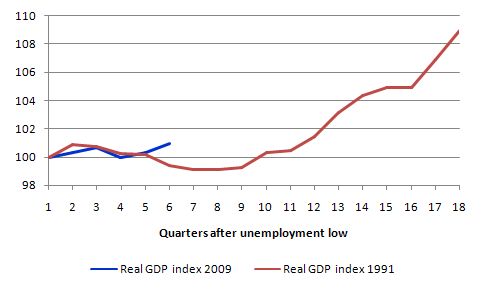
The first graph is simply the GDP level indexed at 100 at December 1989 (for the 1991 recession) and March 2008 (for the 2009 recession), which were the quarters when the labour market started to deteriorate, then traced out over the downturn and early recovery for each of those recessions.
It seems that around this quarter (6 into the episode) the economy started to turn sharply negative in 1991 but has turned up in June 2009, albeit very modestly.
So the economy came to the fork in the road this quarter and has taken the right option. For now.
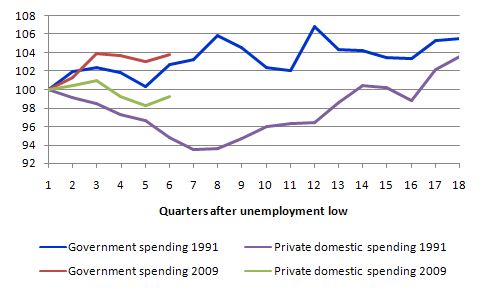
What might be responsible for this? The next graph is being tentatively titled (by me) The Tale of Two Recessions graph. It shows real private domestic demand and real government spending indexed to 100 at December 1989 (for the 1991 recession) and March 2008 (for the 2009 recession) as before.
The graph shows that in 1991 private domestic spending (household consumption and private investment) fell away dramatically from the outset which provoked the downturn. The automatic stabilisers are evident in the response of the government spending, which helped keep GDP growth positive for the first year of the downturn (among other things as we will see next).
Eventually, the fall away in private domestic spending was so significant and the public spending reaction too weak that the recession began in the fifth quarter. The response of the government was to reduce spending around 4 quarters into the downturn as it became obsessed with the growing deficits. That was a very poor macroeconomic strategy.
The response this time is clearly different. Government spending has accelerated since the onset of the downturn and is well above the growth rates that occurred in the 1991 episode. Further, private domestic demand is holding up much better now than in 1991 which has reduced the severity of the downturn.
It should also be noted that the emphasis (bias) of the government stimulus packages towards private consumption largely explain in my assessment the behaviour of private domestic demand.
So the tale of two recessions comes down heavily as being about different fiscal reactions.
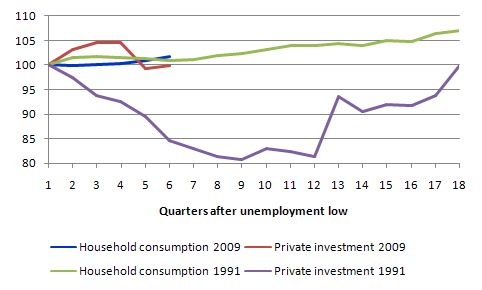
To understand the private domestic spending behaviour some more, here is the comparison between household final consumption and private investment spending for the same periods in the early 1990s and since the March quarter 2008. Again the graphs are indexes.
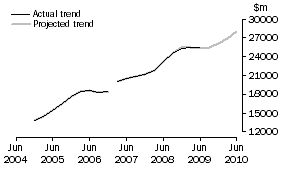
The sharp drop in investment in the early 1990s stands out in stark contrast to the current behaviour. While investment was looking shaky in the March quarter, things stabilised in the June quarter and additional ABS information that came out last week suggests that the stabilisation has turned into positive growth (see the next graph).
The behaviour of consumption is very similar and the major difference now is that the saving ratio has risen this time whereas it was starting to fall in 1991. This is largely a consequence of the dramatically different debt levels that households are now carrying.
This graph is taken from the Experimental ABS capital expenditure series and suggests that based on a sample survey of private businesses that investment is not about to collapse in the coming year.
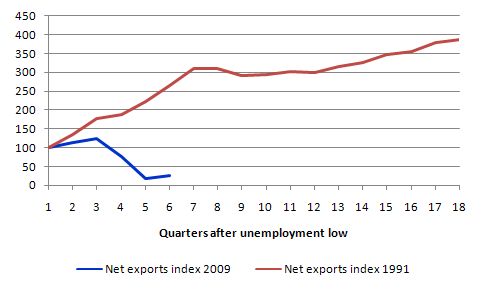
The final part of the story is the contribution of the external sector. This will surprise you I think. It shows indexes of net exports (exports minus imports) for the 1991 and 2009 downturns (using the same base quarters as described above). The contribution of net exports in 1991 remained positive throughout the recession while this time it is negative (taking away from demand). So some of the stimulus package spending is leaving our shores and not being offset by export revenue which is currently barely changing.
So this points to just how important the stimulus packages were in putting a floor under the failing economy.
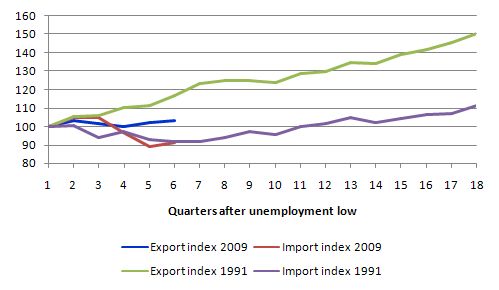
If we break the next exports down into exports and imports again over the same periods as before we get this graph. This allows you to understand the behaviour depicted in the previous graph. The decline in imports is about the same in 1991 and 2009. The major difference between the two recessions is in export behaviour. In 1991, it continued to contribute growth in spending to the national economy whereas in the current period nothing much is happening yet on the export side (in the June quarter).
But vigilance is still required …
While the news today is reasonable in output terms, there is no reason to conclude that we are out of the woods yet.
First, the loss of export revenue as contract prices for commodity exports fall will further reduce the contribution coming from the external sector to spending.
Second, consumers have been propped up by the government handouts. There is no sense that households will have revised their expectations of their permanent income upwards as a result of the handouts. Further, given the extent to which the household sector as a whole remains indebted I expect the main dynamic based on their expected permanent income will continue to be to increase the saving ratio and pay down debt.
Figures overnight reveal that in the UK consumers are not spending but paying down their debt as well. This will be a common trend around the globe.
Third, the impact of the deteriorating labour market have yet to be really felt. The loss of working hours and the zero employment growth (biased towards precarious part-time work) is deflationary. As households come to terms with their income losses and the glow of the government handouts fades, aggregate spending will reflect this pessimism.
Even with positive GDP growth (0.62 per cent over the last 12 months), official unemployment will continue to rise. Given productivity growth has started to move upwards again in the June quarter the rising unemployment will accelerate.
What this all adds up is that now is no time to be thinking of: (a) putting up interest rates; and (b) withdrawing the fiscal stimulus. The budget deficit will have to increase over the next 6 months at least to accommodate the rising household saving and loss of export revenues noted above.
Even though private capital formation is looking favourable, it will not be sufficient to fill the spending gap and drive GDP growth strongly enough to avoid the further deterioration in the labour market, which is, after all, where humans hang out.
The response from the Opposition Shadow Treasurer showed how little he understands these things. He said:
… Australia has been able to survive the economic downturn and we have gone into this downturn in far better shape than any other country, and we’ve come out in better shape because we have had the solid foundations of a strong government budget, of low unemployment and of a flexible economy that has helped to deliver the outcome. And of course if you throw enough money at a problem, some of it will stick, and it’s good. It’s good for Australia. It is fantastic for Australia that we are showing good economic growth today … Now’s the time to pull back on government spending because it’ll be political spending, not economic spending … Today’s a warning bell for Mr Rudd – stop spending so much money, otherwise we are going to end up with higher interest rates and higher taxes … We’ve always said the government’s been spending too much money, more than necessary, and if you want any proof, today it came in the national accounts.
So where do you start with that? Nowhere really.
The reason we have escaped (so far) the worst of the global downturn has nothing to do with the budget parameters inherited by the current government (huge surpluses). In fact, the decade of increasing surpluses made the country more vulnerable to the downturn than otherwise because it drove the household sector into increasing indebtedness. Household saving had to go up after years of dissaving and the withdrawal of spending from that source had a negative impact on our growth prospects.
Further, the ability of the government to prop up the economy with expanding deficits was not enhanced by the decade of surpluses. The Australian government is sovereign in its own currency and is not revenue-constrained. It would have been able to expand its net spending just as quickly and by as much if it had have been running deficits all those years. The private sector would certainly have been in better shape if the federal government had have avoided squeezing their liquidity via the surpluses.
Finally, the impact of the rapid fiscal intervention this time has clearly instilled positive sentiment into the private sector – confidence. This has probably helped contribute to the turnaround in business investment. We have been thinking positively about this downturn. Those who lived through the 1991 recession would never have said that. We had a federal government (Labor) blustering in all its arrogance about the “soft landing” and being therefore unwilling to expand fiscal policy. The results of that policy incompetence are for all to see and will be indelibly etched in our history as a very sorry period.
So today’s GDP figures are fine. But they just consolidate the need for a third stimulus package to really push GDP growth more strongly and eat into the declines in hours worked and arrest the rising jobless.
A new stimulus package should be directly aimed at the unemployed and provide public sector jobs in areas of community and environmental need. This would require a much lower net spending impulse (if they were paid minimum wages with adequate entitlements for leave, superannuation etc) than the cash handouts that characterised the first two stimulus exercises.
The impact on resource usage more widely would also be fairly modest. But the jobs would be incredibly valuable to those who are currently unable to find work in a stagnant (and deteriorating) labour market.
GDP growth is an abstract concept. Employment and adequate wages are experiential aspects of economic life and should take priority.
It is certainly amazing how quickly attitudes towards the stimulus have changed. It is also a shame that, as you say, the media seem far more interested in politics than economics.
There is one point you make, though, that I have to take issue with:
I don’t want to defend the penetrating insights of bank economists (after all, last week the Bloomberg economist survey of GDP forecasts was +0.6% but this week it was down to +0.2% – they should have stuck with their first thoughts!). However, in my experience, bank economists do not try to manipulate rates for the benefit of their bank’s balance sheet. They are effectively a form of marketing for the bank. They aim to get their face on TV with the bank’s logo in the background and they aim to be interesting for insitutional investors in the hope that those investors do more business with the bank as a reward. As a result, the way their bread is buttered, these economists do not care if rates go up or down, they just hope to make as many accurate forecasts as possible and, failing that (as they usually do), at least be as interesting as possible.
Furthermore, having interest rates go up doesn’t necessarily mean that banks’ margins go up. It is certainly good for their earnings on zero or low-interest bank deposit accounts (the equivalent of the old passbook account), but with credit spreads having widened so much over the last couple of years, bank margins are in fact better now than they were two years ago when interest rates were higher. With the economic “green shoots” becoming such a focus, credit spreads have come in a long way this year and, while this means bank funding costs are improving, the margin they can charge borrowrs (particularly corporates) is also reducing. So, it may well be that as interest rates head up again, bank margins may well be contracting.
It certainly is amazing how quickly attitudes toward the stimulus have changed – even in some right-wing newspapers – and if the country has not collapsed in a heap due to “excessive government borrowing and spending” by the next election campaign kick-off then the opposition will try to claim credit by arguing that the Howard government surpluses allowed the present government the “fiscal room” to spend. Odds on.
Dear Sean
Good point. I did some checking today on a variety of short-term-long-term spreads and the relationships with changing cash rates are not definitive. There is some evidence that spreads rise (against risk free assets and overnight money) as the cash rate rises in the Australian financial markets. But there is also some evidence on some maturities that there is no relationship.
best wishes
bill
“Second, consumers have been propped up by the government handouts. There is no sense that households will have revised their expectations of their permanent income upwards as a result of the handouts. ” – I think the government handouts go a long way to propping up confidence. You forget that confidence relies to a large extent on the most recent past.
“Figures overnight reveal that in the UK consumers are not spending but paying down their debt as well. This will be a common trend around the globe.” Why would the Australian consumer follow the UK consumer? The aussie consumer doesn’t read the financial press, doesn’t relate to the out-of-worker in Slough? Nothing backs this prediction except your negatvity! 🙂
Dear Craig
All households that are overextended with personal debt whether they live in Slough or Mayfield will be seeking to reduce their exposure at present. The household saving ratio is rising everywhere. The prediction has nothing to do with my negativity – it is in the national accounts data and now established as a three-quarter trend.
best wishes
bill
What you’ve got to remember is that the government has to borrow the money from somewhere- and in this case it is coming from overseas. That is why you see the difference in net exports.
The economy was in recession for all intents and purposes. Per capita GDP was negative or zero for five straight quarters. That’s as good as a recession.
When the government spends, it has to borrow the money.
When it borrows it from overseas, it reduces net exports.
That is because the balance of payments has to balance.
And so the only way that fiscal policy impacts the economy is through monetary variables.
Lefty makes a good point that the last government gave this government alot of fiscal room with its surplus.
But lets also remember, interest rates could’ve fallen another 3% from where they were. There was no need for so much stimulus when there was also a monetary option.