I am travelling today to Tokyo and have little time to write here. But with…
Australian growth outlook remains poor
The latest release by the Australian Bureau of Statistics of the – September-quarter 2019 National Accounts data (December 4, 2019) – confirms what we have been tracing for several quarters – the Australian economy is grinding to a halt, households are trying to increase saving, the Government’s tax cuts from July seem to have been largely saved to run down debt rather than spent, business investment is weak, and government spending and the terms of trade boost to exports are the only thing between now and a recession. And, the government is in denial, thinking its fiscal surplus obsession is more important than protecting incomes and growth. The problem is that if you don’t do the latter, you can kiss the former goodbye anyway. The data shows that annual GDP growth of 1.7 per cent is around 1/2 the historical trend rate. This is a very poor on-going result. The weaker performance started in the last 6 months of 2018 and has continued into the first six months of 2019. However, due to a fairly strong terms of trade, Real net national disposable income rose, which signifies rising material living standards. But those terms of trade gains will prove to be ephemeral. Overall, the quarterly growth rate was just 0.4 per cent. Net exports were strong (terms of trade effect) and government consumption expenditure was strong courtesy of some policy measures in disability, health and aged care coming on-line. Their boost will also dissipate fairly quickly. Longer-term worries include the weakening household consumption growth and the on-going negative business investment growth. The data now lets us appraise whether the small tax cut stimulus the government introduced from July have been very effective. In an environment where household debt is at record levels, the risks of unemployment are rising, and wages growth remains stagnant, it is no surprise that the households are using their tax savings to reduce their risk levels. This is borne out by the rising saving ratio. The overall picture is not good and the future is looking rather dim at present. A major shift in fiscal policy towards expansion is now definitely required.
The main features of the National Accounts release for the September-quarter 2019 were (seasonally adjusted):
- Real GDP increased by 0.4 per cent for the quarter – signalling further weakness. The annual growth rate was 1.7 per cent, well below historical trend.
- Real GDP per capita growth was zero per cent.
- The main positive contributors to real GDP growth were Net exports (0.3 percentage points), Government consumption expenditure (0.2 points) and government investment (0.1 points), and household consumption (0.1 points).
- Australia’s Terms of Trade (seasonally adjusted) rose by 0.4 per cent in the quarter and 7.8 per cent over the 12 month period.
- Real net national disposable income, which is a broader measure of change in national economic well-being rose by 0.9 per cent for the quarter and 4.8 per cent for the 12 months to the September-quarter 2019, which means that Australians are better off (on average) than they were at that point 12 months ago. This is being driven by the strong terms of trade at present.
- The Household saving ratio (from disposable income) rose sharply to 4.8 per cent (from 2.3 per cent) as household consumption expenditure slowed considerably. The saving ratio is still well below the levels that were observed following the GFC.
The fiscal surplus obsession
I will present a more detailed analysis of the latest fiscal data released yesterday by the ABS – (December 3, 2019) in a later blog post.
But, for now the data shows that for the September-quarter 2019:
1. “taxation revenue decreased 16.5% to $128,477m”.
2. “expenses exceeded revenue resulting in a net operating balance of -$13,469m”
3. Real “general government final consumption expenditure increased by $817m or 0.9%, and is expected to contribute 0.2 percentage points to growth in the September quarter 2019 volume measure of GDP”.
4. Real “public gross fixed capital formation increased by $459m or 1.9%, and is expected to contribute 0.1 percentage points to growth in the September quarter 2019 volume measure of GDP.”
So the surplus ambitions will not be realised.
And we should be thankful they were not, despite the government’s attempts, because together the government sector added 0.3 percentage points to over real GDP growth.
Without that government contribution, total growth would be close to zero in the September-quarter.
Overall growth picture poor
The ABS – Press Release – said that:
The Australian economy grew 0.4 per cent in seasonally adjusted chain volume terms in the September quarter 2019 and 1.7 per cent through the year
… “… the rate of growth remains well below the long run average.”
Net exports contributed 0.2 percentage points to growth this quarter. Domestic final demand remained subdued contributing 0.2 percentage points. Government spending was the main contributor to growth in domestic final demand, reflecting ongoing delivery of services in disability, health and aged care.
The household sector remained relatively subdued, with dwelling investment recording its fourth consecutive decline with a fall of 1.7 per cent during the quarter. Household expenditure increased 0.1 per cent, with weakness in spending on discretionary goods and services.
The household saving ratio rose to 4.8 … The reduction to tax payable did not translate to a rise in discretionary spending, which led to a visible impact to household saving …
Points to note:
1. Household consumption expenditure growth is moderating despite the July tax cuts and the saving ratio has risen sharply, signifying an unwillingness by households to continue to accumulate debt. Real discretionary consumption growth is now negative – as households concentrate their spending on essentials.
2. For all those mainstream economists out there who claim tax cuts will stimulate the economy and should be preferred to increased government spending you have a problem.
3. And for those same economists who teach your students that government spending does not create jobs, stop doing that.
It has been patently obvious that public works expenditure over the last year or so and the more recent expenditure on disability, health and aged care (long standing promises) have been the major difference between a positive (albeit tepid) growth rate and recession.
Public consumption growth has increased to 6.3 per cent over the last 12 months.
3. The big public infrastructure projects which are helping at present are obviously finite and are within an environment where the federal government is obsessed with recording a surplus. The public spending is coming from State governments (large transport projects mainly). The growth in public investment was negative in the current quarter.
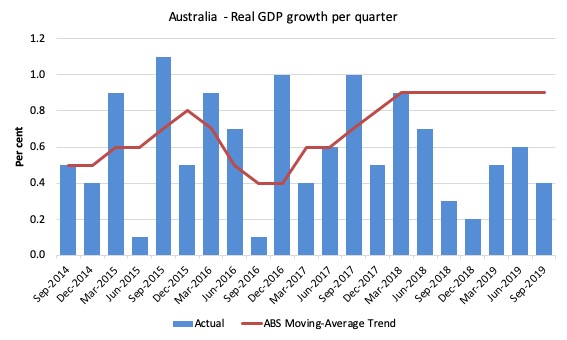
The first graph shows the quarterly growth over the last five years (with the red line being the ABS moving average trend). The trend growth is now flat (and would have been negative except for the spike outlier in the September-quarter 2018).
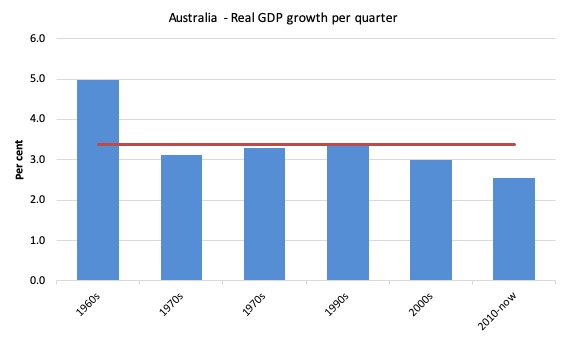
To put this into historical context, the next graph shows the decade average annual real GDP growth rate since the 1960s (the horizontal red line is the average for the entire period, March-quarter 1960 to the September-quarter 2019).
It is easy to see how far below historical trends the growth performance of the last 2 decades have been as the fiscal surplus obsession has intensified on both sides of politics.
Even with a massive household credit binge and a one-in-a-hundred-years mining boom that pushed the terms of trade into the stratosphere, our real GDP growth has declined substantially below the long-term performance.
And it is not that we are eschewing material aspirations in favour of climate action. Our carbon emissions continue to rise as well.
Analysis of Expenditure Components
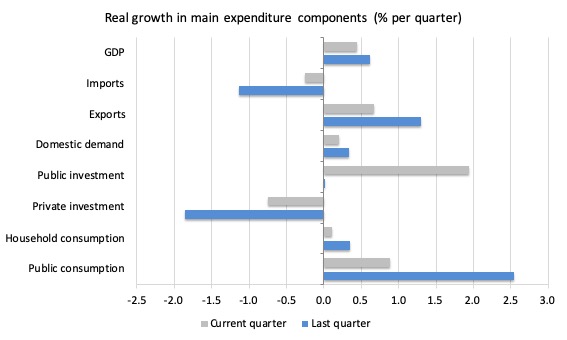
The following graph shows the quarterly percentage growth for the major expenditure components in real terms for the September-quarter 2019 (grey bars) and the June-quarter 2018 (blue bars).
The overall growth performance is being driven by the strength of public consumption and export expenditurs.
Private investment expenditure growth declined by 1.84 per cent for the quarter (third successive negative growth quarter) and 4.3 per cent over the 12 months.
Household consumption expenditure growth slowed (0.1 per cent, down from 0.35 per cent) and remains subdued compared to recent years.
The slowing economy is also impacting negatively on import expenditure which contracted by 1.1 per cent, the third successive negative growth quarter).
The growth in exports continues (1.3 per cent) but is not going to be long-lived.
Contributions to growth
What components of expenditure added to and subtracted from the 0.4 per cent real GDP growth in the September-quarter 2019?
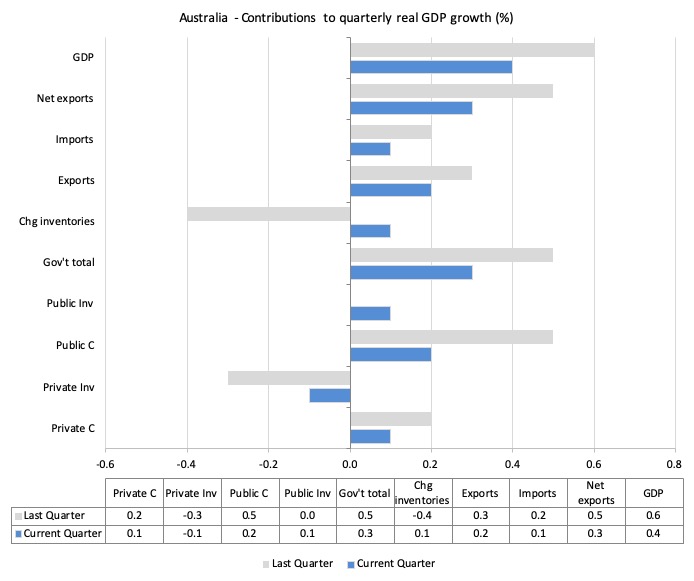
The following bar graph shows the contributions to real GDP growth (in percentage points) for the main expenditure categories. It compares the September-quarter 2019 contributions (blue bars) with the June-quarter 2018 (gray bars).
In order of contribution:
1. Net exports added 0.3 percentage points driven by a rise in exports (and rising terms of trade) and falling imports.
2. Public consumption contributed 0.2 points driven by initiatives in disability, health care and aged care services. Overall, the government sector contributed 0.3 points (given the 0.1 point contribution from public capital formation).
3. Household consumption expenditure contributed 0.1 points to the overall growth result – a relatively weak but stable result. It was 0.2 points last quarter – also weak.
4. Private investment expenditure undermined growth by 0.1 points (negative 0.3 points last quarter).
Material living standards rise in September-quarter 2019
The ABS tell us that:
A broader measure of change in national economic well-being is Real net national disposable income. This measure adjusts the volume measure of GDP for the Terms of trade effect, Real net incomes from overseas and Consumption of fixed capital.
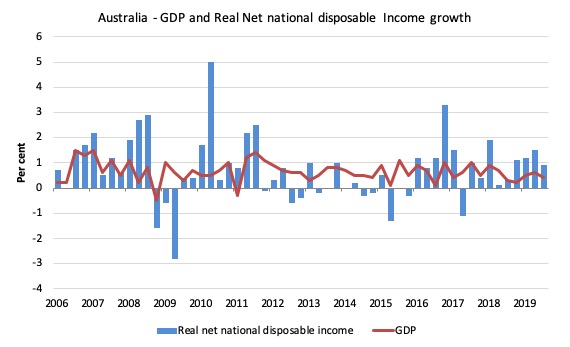
While real GDP growth (that is, total output produced in volume terms) grew by 0.4 per cent in the September-quarter 2019, real net national disposable income growth grew by 0.9 per cent.
Over the 12 months to the September-quarter 2019, Real net national disposable income grew by 4.8 per cent, which means that Australians were better off (on average) in real income terms than they were twelve months prior.
This is mostly due to the terms of trade effect rather than domestic demand growth.
The following graph shows the evolution of the quarterly growth rates for the two series since the December-quarter 2006.
Household saving ratio rises – as households save the tax cuts
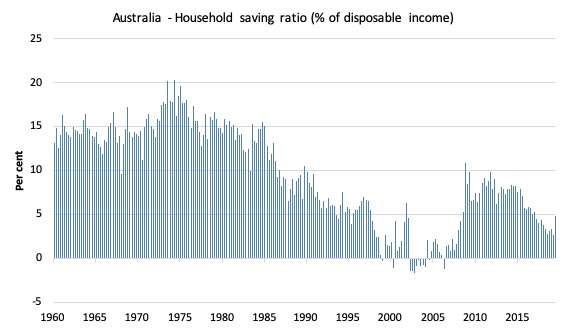
The saving ratio rose sharply to 4.8 per cent (up from 2.7 per cent) even though the government tax cuts have now been available since July.
The rising ratio, after a period of decline in recent years, coupled with the almost zero growth in consumption expenditure, may signal that the household sector is now trying to reduce its precarious debt levels.
While that is a good sign (the improvement in household balance sheets), it has to be supported by government deficits if the nation is to avoid recession.
Ultimately, the credit-fuelled and draw down on saving cannot be sustained. The household sector may have turned the corner.
So it will be recession or the government will turn the corner with them.
The following graph shows the household saving ratio (% of disposable income) from the September-quarter 1960 to the current period.
In the December-quarter 2008, the ratio was 10.9 per cent having risen sharply in the early days of the GFC as households tried to stabilise the record debt situation.
Once the GFC threat was contained by the massive fiscal stimulus, the saving ratio began to fall again, especially as the squeze on wages has intensified.
In the December-quarter 2016, the household saving ratio was 5.5 per cent (still much lower than historical norms).
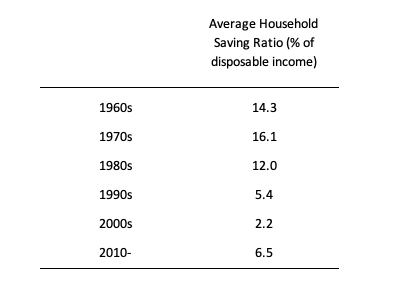
The following table shows the impact of the neoliberal era on household saving. These patterns are replicated around the world and expose our economies to the threat of financial crises much more than in pre-neoliberal decades.
Real GDP growth and hours worked
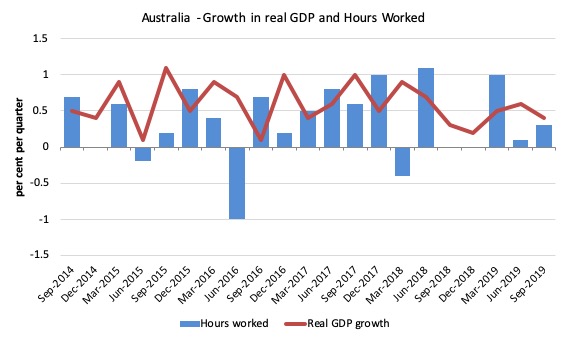
The following graph presents quarterly growth rates in real GDP and hours worked using the National Accounts data for the last five years to the September-quarter 2019.
You can see the dislocation between the two measures over the period to mid-2016 (it actually began in 2011). In other words, GDP was growing while hours worked growth was variable but often zero or negative.
From then until the December-quarter 2018, the two series moved more or less together, despite the blip in the September-quarter 2018.
But the September-quarter data shows that total hours worked was close to GDP growth, which means that productivity growth heads to zero (or thereabouts).
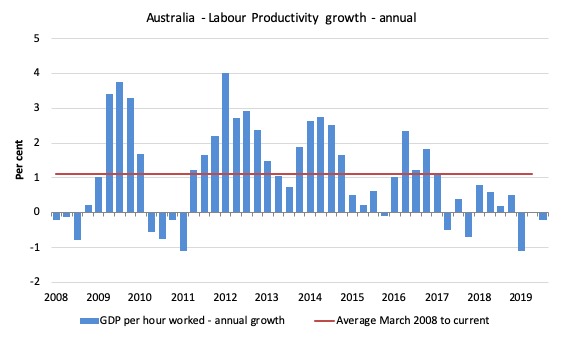
To see the above graph from a different perspective, the next graph shows the annual growth in GDP per hour worked (labour productivity) from the September-quarter 2008 quarter to the September-quarter 2019. The horizontal red line is the average annual growth since September-quarter 2008, which itself is an understated measure of the long-term trend growth of around 1.5 per cent per annum.
The relatively strong growth in labour productivity in 2012 and the mostly above average growth in 2013 and 2014 helps explain why employment growth was lagging given the real GDP growth. Growth in labour productivity means that for each output level less labour is required.
In the September-quarter 2019, annual labour productivity growth fell to minus 0.2 per cent.
Conclusion
Remember that the National Accounts data is three months old – a rear-vision view – of what has passed and to use it to predict future trends is not straightforward.
Although I do not expect the growth rate to pick up any time soon without a major shift in macroeconomic policy.
Thus, coming up with assessments of where the economy is heading requires analysis of the more recent data – such as labour force surveys and the like.
Combining all the signals, the conclusion is that the Australian economy is stagnating.
The National Accounts data indicates that the Australian economy continued to perform poorly in the September-quarter, a trend that has now persisted for the last 12 months.
Annual growth is just 1.7 per cent around 1/2 of the historical trend rate.
The weakness is exemplified by slackness in private domestic demand – weakening household consumption growth and negative business investment growth.
Only offsets by strong public consumption and public investment is saving private domestic demand from collapse. These stimulus measures are policy related and finite.
Net exports also contributed to growth on the back of the rising terms of trade but as I noted this impact will be ephemeral.
Overall, the Australian growth outlook remains poor.
A major shift in fiscal policy towards expansion is definitely now required.
That is enough for today!
(c) Copyright 2019 William Mitchell. All Rights Reserved.
Hi Bill
Here in New Zealand we are having a bout of public mass hysteria because the Government has announced an increase in its spending.
The public are now so indoctrinated into thinking that Government debt is a such a bad thing that it is hard to see how any politician can decide to carry it out.
https://www.stuff.co.nz/national/117904286/government-debt-changes-are-more-important-than-just-a-number
The only thing that has ticked up has been the housing market. What’s your view on the Australian housing market?
@Oliver – not sure what Bill’s view is but I would say that smaller numbers of higher priced houses turning over at a rapid rate probably sums up a lot of the activity.
Housing credit growth is currently tracking the lowest level this century and is continuing to slow. Business credit growth is also slowing while personal credit is well negative and continuing to go further negative.
There has been a small – and I mean small – tick up in owner-occupier housing credit but it has been offset by investor credit going negative, and still going down.
Latest Newspoll out today (for whatever such things are worth) – Morrison’s standing continues to surge ahead.
The worse the economy becomes under his mis-management, the more his popularity grows it would seem. The Australian people are gladly giving the Coalition a free pass to just continue grinding them into the dirt (for now at least).
I think Labor have an image problem. My contention has long been that a large percentage of the electorate make their voting decisions based mainly on which party leader they feel looks better in a suit. Shorten did not project much of an image and nor does Albanese. Keating won an essentially un-winnable election after presiding over the worst economic downturn since the Great Depression simply because his opponents image was so poor – Hewson projected weakness and ineffectuality and so was rejected by the electorate.
Having a great idea is seldom enough – it usually takes a great salesman to talk it up before most people will pay the slightest attention.