Today (June 3, 2026), the Australian Bureau of Statistics (ABS) released the latest - Australian…
US economy continues to grow, albeit at a slower pace
The US Bureau of Economic Analysis (BEA) released the – Gross Domestic Product, Third Quarter 2019 (Advance Estimate) – data yesterday (October 30, 2019). It shows that the US economy “increased at an annual rate of 1.9 percent in the third quarter of 2019” which was slightly slow than the 2 per cent recorded in the June quarter. As this is only the “Advance estimate” (based on incomplete data) there is every likelihood that the figure will be revised when the “second estimate” is published on November 27, 2019. Underlying the headline figure, however, are shifting expenditure patterns in the US. Household consumption growth is declining and the contribution to growth was down from 3.03 points in une 2019 to 1.93 points. The personal saving rate rose from 8 per cent of disposable income to 8.1 per cent as households tightened up in the face of record levels of debt and sluggish wages growth. Total investment continued to be a negative drain on growth (-0.27 points compared to -1.16 points. Net exports also subtracted from growth (0.08 points compared to 0.68 points in the June-quarter). The increase in disposable personal income was lower (4.5 per cent) than in the June-quarter (4.8 per cent), although in real terms, the growth was 2.9 per cent compared to 2.4 per cent. Overall, and notwithstanding the continued growth, the question for the US growth prospects centre on what will happen to consumption expenditure growth. How much more will it decline and the saving rate rise?
The aggregate level
The US Bureau of Economic Analysis said that:
Real gross domestic product (GDP) increased at an annual rate of 1.9 percent in the third quarter of 2019 … In the second quarter of 2019, real GDP increased 2.0 percent.
Note that the BEA is using the annualised quarterly figure here (multiplying the third-quarter growth by 4) rather than the actual annual (year-on-year) growth rate which is the percentage shift from the September-quarter 2018 to the September-quarter 2019.
That growth figure was 2.03 per cent, down from 2.28 per cent in the June-quarter. The quarter-on-quarter growth outcome of 0.48 per cent was slightly lower than the June-quarter result of 0.5 per cent.
The following sequence of graphs captures the story.
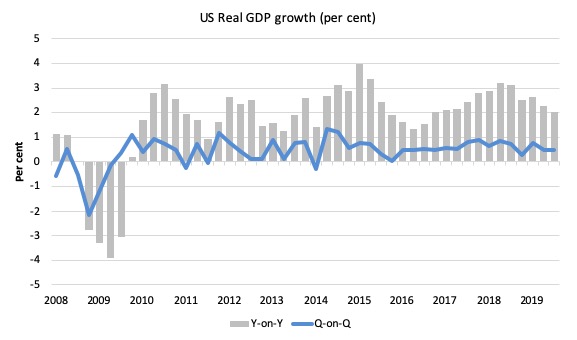
The first graph shows the annual real GDP growth rate (year-to-year) from the peak of the last cycle (December-quarter 2007) to the September-quarter 2019 (grey bars) and the quarterly growth rate (blue line). Note the date line starts at March-quarter 2008.
The year-to-year growth calculation smooths out the considerable volatility in the quarterly data to help us see the trend.
The grey bars suggest there is declining momentum in US growth in terms of the annual growth rate (year-on-year).
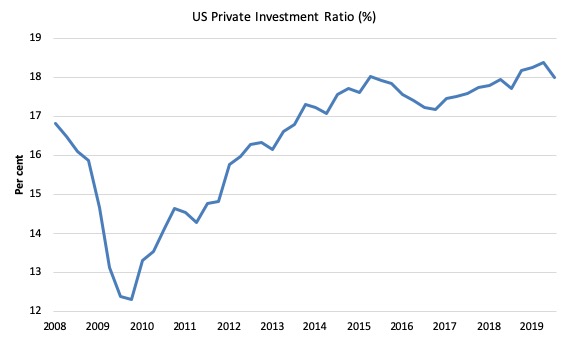
The next graph shows the evolution of the Private Investment to GDP ratio from the December-quarter 2007 (real GDP peak prior to GFC downturn) to the September-quarter 2019. Note the date line starts at March-quarter 2008.
The decline in the investment ratio as a result of the crisis was substantial and endured for 2 years. As a result the potential productive capacity of the US contracted somewhat. There are various estimates available but the overall message is that potential GDP fell considerably as a result of the lack of productive investment in the period following the crisis.
In more recent times, the investment ratio has stalled and is now at 18 per cent of GDP, down from 18.4 per cent in the June-quarter, which was the highest levels since the current BEA data series began in the June-quarter 1947.
In this blog post – Common elements linking US and UK economic slowdowns (May 1, 2017) – I discussed estimates of potential GDP in the US and the shortcomings of traditional methods used by institutions such as the Congressional Budget Office.
So if you are interested please go back and review that discussion.
The latest CBO estimates, made available through – St Louis Federal Reserve Bank, show why we should be skeptical.
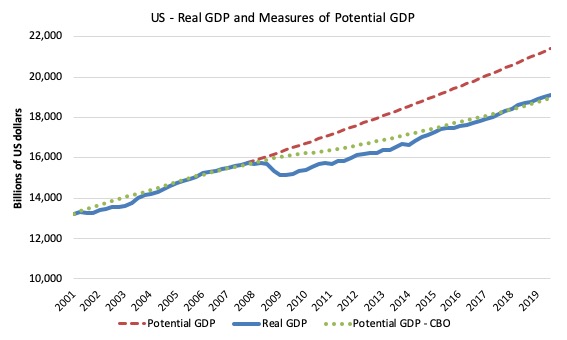
To get some idea of what has happened to potential real GDP growth in the US, the next graph shows the actual real GDP for the US (in $US billions) and two estimates of the potential GDP. There are many ways of estimating potential GDP given it is unobservable.
While I could have adopted a much more sophisticated technique to produce the red dotted series (potential GDP) in the graph, I decided to do some simple extrapolation instead to provide a base case.
The question is when to start the projection and at what rate. I chose to extrapolate from the most recent real GDP peak (December-quarter 2007). This is a fairly standard sort of exercise.
The projected rate of growth was the average quarterly growth rate between 2001Q4 and 2007Q4, which was a period (as you can see in the graph) where real GDP grew steadily (at 0.65 per cent per quarter) with no major shocks.
If the global financial crisis had not have occurred it would be reasonable to assume that the economy would have grown along the red dotted line (or thereabouts) for some period.
The gap between actual and potential GDP (red dotted version) in the September-quarter 2019 is around $US2,296.1 billion or around 10.7 per cent.
That gap rose steadily since late 2014 but then stabilised but has increased in the last two quarters.
The green dotted line is the estimate of potential output provided by the US Congressional Budget Office and suggests that the US economy is estimated to be operating at 0.8 per cent over its potential in the September-quarter 2019 and has been operating at over-full capacity since the March-quarter 2018.
It is hard to believe the estimate!
Especially in line with the US Federal Reserve cutting interest rates yesterday for the third consecutive time this year.
In its – FOMC Statement (October 30, 2019), the US Federal Reserve noted that:
On a 12-month basis, overall inflation and inflation for items other than food and energy are running below 2 percent. Market-based measures of inflation compensation remain low; survey-based measures of longer-term inflation expectations are little changed.
This was also supported by the BEA commentary:
The price index for gross domestic purchases increased 1.4 percent in the third quarter, compared with an increase of 2.2 percent in the second quarter … The PCE price index increased 1.5 percent, compared with an increase of 2.4 percent. Excluding food and energy prices, the PCE price index increased 2.2 percent, compared with an increase of 1.9 percent.
That is, price pressures declined, hardly symptomatic of an economy that is operating at 0.8 per cent over its capacity.
Further, wages growth is contained and broader measures of labour underutilisation indicate there is still considerable slack.
Which suggests that the CBO estimates are inaccurate – probably by several percentage points.
We know (and I explain this in more detail in the blog post mentioned above), the CBO base their estimate of Potential GDP on their estimate of the NAIRU – the (unobservable) Non-accelerating Inflation Rate of Unemployment.
This is a conceptual unemployment rate that is consistent with a stable rate of inflation.
The literature demonstrates that the history of NAIRU estimation is far from precise. Studies have provided estimates of this so-called ‘full employment’ unemployment rate as high as 8 per cent or as low as 3 per cent all at the same time, given how imprecise the methodology is.
The former estimate would hardly be considered “high rate of resource use”. Similarly, underemployment is not factored into these estimates.
The continued slack in the labour market (bias towards low-pay and high underemployment) would lead to the conclusion that the output gap is likely to be somewhat closer to the extrapolated estimate than the CBO estimate.
The question to ask is this: How much lower would the unemployment rate and the broader underutilisation rate go if the US federal government offered a Job Guarantee on an unconditional basis?
I would bet the answer would be much lower without any inflation acceleration emerging.
Contributions to growth
The accompanying BEA Press Release said that:
The increase in real GDP in the third quarter reflected positive contributions from personal consumption expenditures (PCE), federal government spending, residential fixed investment, state and local government spending, and exports that were partly offset by negative contributions from nonresidential fixed investment and private inventory investment. Imports, which are a subtraction in the calculation of GDP, increased …
The deceleration in real GDP in the third quarter reflected decelerations in PCE, federal government spending, and state and local government spending, and a larger decrease in nonresidential fixed investment. These movements were partly offset by a smaller decrease in private inventory investment, and upturns in exports and in residential fixed investment.
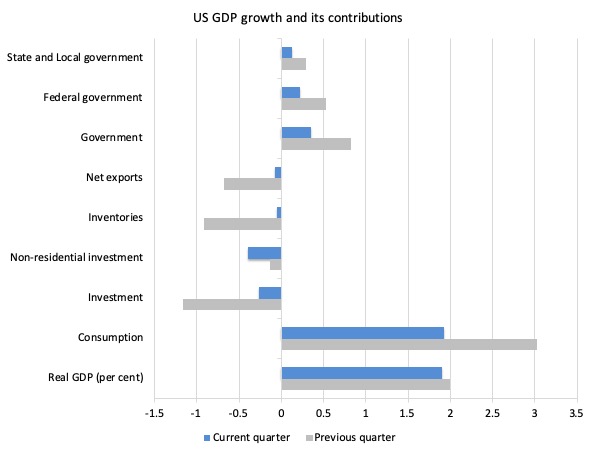
The next graph compares the September-quarter 2019 (blue bars) contributions to real GDP growth at the level of the broad spending aggregates with the June-quarter 2019 (gray bars).
The positive overall growth outlook masks a distinct softening in the contribution of private consumption spending. In the June-quarter 2019, it contributed 3.03 points to the overall growth of 2 per cent, more than offsetting the negative contributions o investment and net exports.
By the September-quarter 2019, this contribution had fallen significantly to 1.93 points.
It was always a question of when not if that private consumption spending would start to wane, given the household debt remaining high (see below) and the sluggish real wages situation.
Most of the consumption growth has occurred because more people are getting jobs even though wages growth is flat. This cannot persist obviously.
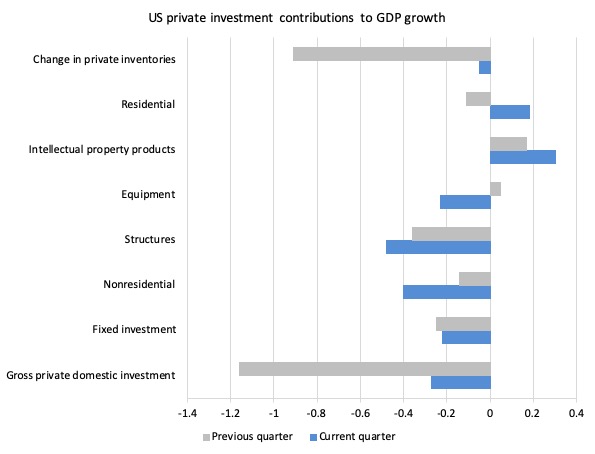
In line with the slight decline in the investment ratio, gross private domestic investment subtracted from overall growth by 0.27 points.
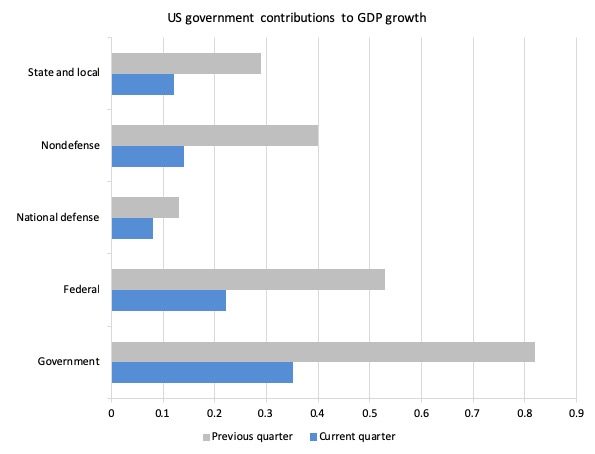
The Government sector added 0.35 points to the September-quarter 2019 growth, down from 0.82 points in the previous quarter.
While earlier in the year, it was the contribution of the State and Local governments that drove the government contribution, in the last two quarters, it has been the federal government contributing most.
The next graph decomposes the government sector and shows that all levels of government contributed significantly to growth in the current-quarter but decreased their contributions relative to the previous-quarter.
The next graph breaks down the contributions to real GDP growth of the various components of investment.
The decline in most categories of investment is a worrying sign.
Household consumption and debt
The Federal Reserve Bank of New York publication – Household Debt and Credit Report – was last updated for the June-quarter 2019 (published August 2019) – (PDF Download).
It shows:
… total household debt increased by $192 billion (1.4 percent) to $13.86 trillion in the second quarter of 2019. It was the twentieth consecutive quarter with an increase, and the total is now $1.2 trillion higher, in nominal terms, than the previous peak of $12.68 trillion in the third quarter of 2008. …
Mortgage balances-the largest component of household debt-rose by $162 billion in the second quarter to $9.4 trillion, just higher than the previous high of $9.3 trillion from the third quarter of 2008. Non-housing balances increased by $37 billion in the second quarter, with a $17 billion increase in auto loan balances and a $20 billion increase in credit card balances offsetting an $8 billion decline in student loan balances.
The rise in non-housing debt (for example, credit card balances) is particularly worrying. It is a sign that household income growth is not sufficient to finance basic needs.
The decline in US household consumption spending growth is now clear and is probably a response to the pressures that the rising household debt levels are placing on household solvency.
The Data shows that:
About 232,000 consumers had a bankruptcy notation added to their credit reports in 2019Q2, an increase from the 225,000 in 2018Q2.
The following graph is taken from the FRBNY publication. Clearly the gap between mortgage and non-mortgage debt is rising as total household indebtedness rises.

This looks to be an unsustainable situation and will require either significant non-government spending boosts in investment or net exports or government spending increases to offset the likely slowdown in household consumption spending.
Conclusion
The US economy continues to growth, albeit at a slightly slower rate.
Household consumption growth is declining and the contribution to growth was down from 3.03 points in une 2019 to 1.93 points.
The personal saving rate rose from 8 per cent of disposable income to 8.1 per cent as households tightened up in the face of record levels of debt and sluggish wages growth.
Total investment continued to be a negative drain on growth (-0.27 points compared to -1.16 points. Net exports also subtracted from growth (0.08 points compared to 0.68 points in the June-quarter).
The increase in disposable personal income was lower (4.5 per cent) than in the June-quarter (4.8 per cent), although in real terms, the growth was 2.9 per cent compared to 2.4 per cent.
Overall, and notwithstanding the continued growth, the question for the US growth prospects centre on what will happen to consumption expenditure growth.
How much more will it decline and the saving rate rise?
That is enough for today!
(c) Copyright 2019 William Mitchell. All Rights Reserved.
Bill
I note that US housing debt is close to its 2008 peak of around 10 trillion dollars. Shouldn’t we be worried that in addition to a rising proportion of non housing debt, US housing debt (which is supposed to be safer because it’s mostly secured by mortgages) is now back to a level that proved unsustainable and nearly crashed the global financial system in 2007/08?
Most US workers haven’t had a real wage increase in the last 10/11 years. Nor have they experienced much inflation over that period which would have at least eaten into the real value of the nominal debt balances they owe.
It seems unlikely that America’s working classes will be better placed to service the debts depicted in the Total Debt Balance graph than they were in 2007/08.
Bill you say: ” The rise in non-housing debt (for example, credit card balances) is particularly worrying. It is a sign that household income growth is not sufficient to finance basic needs.’
I’m particularly interested in this observation because of the Australian situation regarding non-housing debt. The latest RBA/APRA stats reveal the credit momentum is slowing down.
https://www.rba.gov.au/statistics/frequency/fin-agg/2019/fin-agg-0919.html
Financial Aggregates Percentage change
TOTAL CREDIT YEAR ENDED
Sept 2018 4.6%
Sept 2019 2.7%
PERSONAL DEBT YEAR ENDED
Sept 2018 -1.4%
Sept 2019 -4.4%
Some commentary from Martin North of Data Finance Analytics
“For the year ending, total credit grew by 2.7%, the lowest since June 2011, Housing at 3.1%, the lowest at least since 1977, and business at 3.3%. Personal credit fell 4.4% over the year”
If the American figures suggest a cash strapped economy is resorting to personal debt…then Australian figures could more likely suggest we have maxed-out the credit card.
@PhilipR
“Shouldn’t we be worried that in addition to a rising proportion of non housing debt, US housing debt (which is supposed to be safer because it’s mostly secured by mortgages) is now back to a level that proved unsustainable and nearly crashed the global financial system in 2007/08?”
Yes, Philip. We definitely should.
In this instances I find myself too often citing Prof. Michael Hudson:
“A debt that can’t be paid, won’t be.”
Right now it’s just a matter of HOW it won’t be paid. Will there be a massive cut in favor of the debtors, I call this the Bernie-Scenario, or will there be another meltdown. I don’t call the latter anything but for the sake of it let it be the “non-Bernie-scenario”
Problem with the non-Bernie Scenario is that I don’t think the common people are ready to take another one for Wall Street when it all falls apart again and are way too well-armed for my liking. I very much think this could literally lead to massive bloodshed. That is if the Trump-crazies don’t precipitate it over the fallacious CIA-FBI-instigated coup-d’etat attempt that is the current talk of impeachment.
I apologize (somewhat) for being this explicitly partisan, but even as a non-american citizen abroad I feel like this is a decisive fork in the road of humanity that very much concerns all of us and we don’t have the time for timid capitalist reformers or any of the garden variety lizard-brains that populate the democratic and republican wings of the corporation party.
House Clinton vs House Trump is such a big distraction from the real issues. One of these issues is the huge private debt problem depicted in the blog.
MMTers will tell you that a JG program is far superior to a UBI program.
This is likely true, if the goal is to provide an income for those who are replaced by automation.
However, a UBI program would also be useful as a temporary measure to put cash in the pockets of everyone while the JG program is being put in place to stimulate the economy and increase the wages of most workers.
A UBI would also be useful to avoid a crisis from too much private debt. If the national gov. {of US, Aust., UK, NZ, or Canad, etc.} dumped a bunch of cash into the economy by giving every adult a $1000/mo UBI and children a smaller UBI given to their parents, this would give the borrowers money to make their payments and help everyone to pay any increase in prices as the economy adjusts to the JG program. Such cash should not damage the economy much and would be useful.
This might avoid another private debt crisis.
This actually seems like a *necessary* , *temporary* , program.
Dear Bill,
The following off topic post is intended as a test to see if you will allow such long off topic posts that other readers of your blog may benefit from. If you don’t want such post delete it and I will not do it again. I don’t know how to get permission, so I hope I’ll get forgiveness if it offends you.
I posted a similar thread on another site. I changed the wording for us here because they mostly reject MMT as a pack of lies.
_____
The current wildfires in Calif. demonstrate again that for the last 40 or so years America {and the other Western nations & Japan} have been misgoverned.
Many people on other sites blame the Baby Boomers for this. Well, I have news for them. For the 1st decade at least the 2 previous generations outnumbered the Baby Boomers at the polls. So, it wasn’t just the Baby Boomers, or even mostly the Baby Boomers.
In fact, the problem wasn’t the mass of the people. The problem is the current theory of economics that almost everyone believes. But, this includes almost no one here on this site. Economists attempt to prove their theories deductively because they can’t do controlled experiments. The problem with *all* deductive proofs is hiding in the assumptions used. If even one of them is false the proof is useless. And, economists use obviously false assumptions and then make a claim that that the conclusions are “good enough” to make policy recommendations to politicians. Then, they ignore the evidence that after the policy was put in place the results were not at all what was predicted. This last thing is strong evidence that the Theory being used is not at all “good enough”.
The current economic theory being used by politicians has many flaws. I want to start with 2 of them.
1] It says the the US Gov. {and all similar gov., which does not incl. those in the eurozone} is like a mom & pop corner store. That it must get dollars before it can spend dollars. It says that taxes fund the Gov. It says that running a surplus {the same as having a profit for the store} is a good thing.***
2] It says that that the US national debt must be paid back some day. It says the only way to do this is to collect more from taxes than the Gov. spends, “You can’t borrow your way out of debt”. Therefore, we can’t let the national debt grow too large.****
Almost all people I see posting on other sites agree with both of those claims. If those claims are false then they are just as much to blame for the misgovernment of America as the Baby Boomers they hate, because the problem is that most people have been brainwashed into believing those claims.
. . . This is so, because those claims have starved the American economy of sufficient income for 40 years. This is so, because *all* deficit spending automatically becomes someone’s income and when he spends it someone else’s income, etc., etc. Income gets spent or saved. If it is spent it adds the the GDP. If it is saved it is a drag on future increases in the GDP. This is why the US Gov. must deficit spend every year to replace what people save {and other leakages} or else the GDP suffers. If the GDP suffers then tax receipts decline.
The current wildfires in Calif. illustrate the $4T in deferred infrastructure improvements or repairs that the US as a whole has not made over the last 40years. This was caused by the prevailing economic theory making the voters resist taxes and deficit spending. This has not only been a problem for the infrastructure but it has also denied the people of additional income to make their lives better.
. . . The current economic theory has 2 other faults. It says the anti-trust laws are too limiting on big business and if they are relaxed then everyone will benefit. This has not turned out to be true.
. . . The 2nd one is that policies have been put in place for labor law that have resulted in real after inflation wages being flat since 1975. And, inflation has not been computed correctly either. For most people it has been higher than the Gov. office has claimed. So, most people who live on wages have been squeezed between the actual inflation and their flat wages.
All this was not necessary. TINA is a lie. There Is an Alternative. It has not been used because the media has brainwashed the population with a false economic theory. Those who still believe this theory, despite my and other’s efforts, are as much to blame for the current mess America is in as everyone else.
.** . I can make a long list of examples where the predicted result didn’t occur.
1] Trump’s recent tax cuts were supposed to result in 6% GDP growth, which didn’t come close to happening.
2] All the Repud tax cuts for the last 35 years fall in this category.
3] The austerity in Europe was supposed to being back prosperity, it hasn’t. The EU is in a long term recession 10 years later.
4] Japan has deficit spent for 25 to 30 years and its current national debt stands at 236% of GDP, the highest ratio in the world. The theory predicted that this would lead to high inflation, to high interest rates when gov. borrowing crowed out private borrowing, and soon lead the Japanese gov. to be insolvent. NONE of these results have occurred over the 25+ years of their deficit spending, and the Bank of Japan actually buys most of the bonds sold so it is the same as simply spending the cash into the economy. The theory says that this is going to result in hyperinflation very soon, but inflation is and interest rates are almost 0%.
5] From 2000 through 2006 Mainstream economists were saying that the policies that they had recommended and had gotten put in place had ended the business cycle and there would not be another crash. That if there was a problem it was with the “huge” US national debt. Then came the GFC/2008 and it proved that the theory was false. The crash was not caused by the national debt, it was caused by private debt getting so high that too many of the borrowers could not make the next payment.
.*** . The US Gov. is not like a small store because the Gov. can and often does create more dollars whenever it needs them. In 2008 & 2009 the Gov. and/or Fed. Res. created {according to a reply to a FOIA request} $27T {yes $27T} dollars and lent or *gave* them to US banks, foreign banks, and other people. I have no knowledge of how much of that has been paid back. I assume it is over half and maybe close to 90%, but I know it isn’t 100%. See below for another huge difference.
.**** . The US national debt is not going to be paid off, ever. It can’t be paid off. It doesn’t need to be paid off. The US can roll the bonds over or pay them with magic dollars as they come due because it can create dollars whenever it needs them. Doing this IS FAR LESS DAMAGING to the world’s economy than not paying them when they come due.
. . . What the so called national debt IS REALLY is all the dollars of deficit spending that the US Gov. has spent and not taxed back yet. It is currently {look at it from the POV of the holder, now} the assets of the holders. Using the taxing power to take these assets of the holders away directly or indirectly is going to have the same macroeconomic effect as defaulting on the debt.
. . . Note, here I’m referring to the damage it would cause to the American and the world’s economy, not the effects on each bond holder. The damage would occur because of macroeconomic forces or effects. Sucking $21T {an estimate of the current natl’ debt} out of the world’s economy in one day or over 50 years would destroy the world’s economy, any way it is done.
Another data point I will point out is —
Bill has posted a blog post that Presidents of several Central Banks {BOJ, ECB, RBA, NZ res. bank, BOE, etc.} have said repeatedly that in a next economic downturn the gov. of their nations need to use fiscal stimuli because monetary stimulus will be ineffective because interest rates are already near 0%.
. . . What this data point says is that monetary control of the economies has not actually worked that well and certainly will not work when interest rates are already at 0%.
America has rising household debt, stagnant wages and chronic levels of underemployment as people are forced into substandard jobs. We are a decade overdue a political-economic paradigm shift because we bailed the system 2007/08 rather than rebooting it.
I think radical change must be just around the corner because the current situation of unsustainable. I’m reminded of Rudiger Dornbusch’s Law:
“Crises take a much longer time coming than you think, and then they happen much faster than you would have thought.”
@Steve_American, “… a UBI program would also be useful as a temporary measure to put cash in the pockets of everyone while the JG program is being put in place”. Why not unemployment benefit and benefits according to specific needs for those who can’t work?
Carol,
My thinking is that even the working people need more cash to be able to pay their debts.
We don’t want a private debt crisis to blow up again.
There may also be some short term price rises as the economy adjusts to the effect the JG program is having on businesses.
If everyone gets it then it is obviously fair.
The economies of many nations would be improved by an injection of cash to all the citizens and maybe residents.
By temporary I’m thinking of a year or 2.
YMMV
Steve, who says the money will be spent on paying down debt? This was the stumbling block to Steve Keen’s ‘helicopter money’ solution.
Carol,
You can lead a horse to water but you can’t make him drink.
I am taking macroeconomics, not microeconomics.
If fools don’t use the money wisely, it isn’t the gov. job to make them, is it?
In any case the number of defaults will be reduced, and that may avoid another GFC/2021.
However, the mass of the people will spend the money and this will stimulate the economy.
This will smooth the transition to a JG program economy. Or a Brexit.
“Steve, who says the money will be spent on paying down debt? This was the stumbling block to Steve Keen’s ‘helicopter money’ solution.”
Even if they don’t spend it paying down debt, this ‘helicopter money’ is money that they can spend without going further into debt.
Households are (to turn Bill’s analogy on its head) exactly like households. Inject assets into household and you improve its balance sheet overnight,