Earlier this year, I analysed how decisions taken by the Japanese Government Pension Investment Fund…
What is the problem with rising dependency ratios in Japan – Part 1?
Later this week I will be in Japan for a series of presentations and meetings with a broad spectrum of Japanese politics. The various hosts of the events which I will confirm in Wednesday’s blog post are all committed to advancing an MMT understanding in Japan and ending the hold that ‘sound finance’ has on the public policy debates and regularly lead to poorly contrived policy shifts (such as the recent sales tax hike) in pursuit of lower fiscal deficits. As part of my preparation for my presentations I have been studying various aspects of the Japanese situation so that I can address the issues with a solid evidence base. One of the recurring themes put forward by the ‘sound finance’ lobby (which includes much of the economics profession both inside and outside of Japan) is that its ‘challenging’ demography demands that the Government move to surplus to ‘save up’ to avoid the impending fiscal disaster associated with a rising dependency ratio. This issue is not confined to Japan, of course. It is just that Japan’s demography is a little further down the ageing road than other nations. But while rising dependency ratios matter and need attention, the construction of the problem by the ‘sound finance’ lobby misses the point completely and their ‘solution’ to their ‘non problem’ only serves to exacerbate the real problem. That is what today’s blog post is about. In Part 2, I will elaborate more on the nature of the productivity challenge and some of the options that have been suggested to deal with it.
Japan’s population is shrinking
The following graph shows the total Japanese population from 1920 to 2018. During the WW2 years (1941-43) no data was collected.
The total population has been shrinking since 2010 as birth rates decline and death rates increase. Net immigration is very low by international standards.
There are many reasons for the declining and low birth rates – sociological and economic (insecurity etc).
The Abe government has policies in place to increase the birth rates (subsidies to young families, free preschool education, etc) but the scale of the change is outpacing the impacts of the policy interventions.

Rising dependency ratios
There are various dependency ratios that can be calculated:
- The standard dependency ratio is normally defined as 100*(population 0-15 years) + (population over 65 years) all divided by the (population between 15-64 years). Historically, people retired after 64 years and so this was considered reasonable. The working age population (15-64 year olds) then were seen to be supporting the young and the old.
- The aged dependency ratio is calculated as: 100*Number of persons over 65 years of age divided by the number of persons of working age (15-65 years).
- The child dependency ratio is calculated as: 100*Number of persons under 15 years of age divided by the number of persons of working age (15-65 years).
- The total dependency ratio is the sum of the aged and child ratios. You can clearly manipulate the “retirement age” and add workers older than 65 into the denominator and subtract them from the numerator.
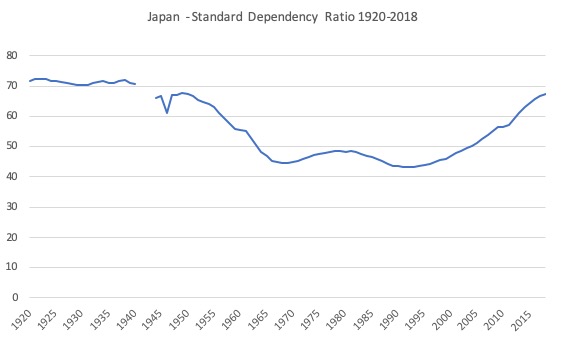
The following graph shows the Standard dependency ratio for Japan from 1920 to 2018 based on a working age population of 15-64 years (even though many Japanese workers have historically retired at 60).
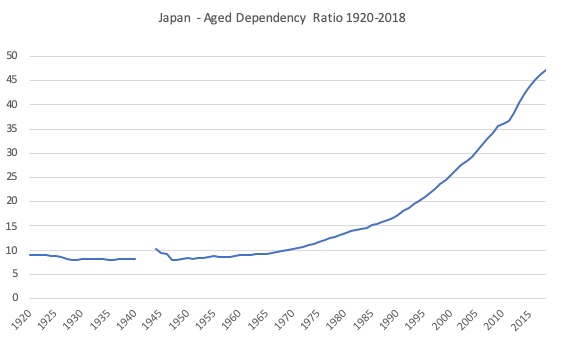
The next graph shows the Aged dependency ratio over the same period. It has been rising since the early 1970s.
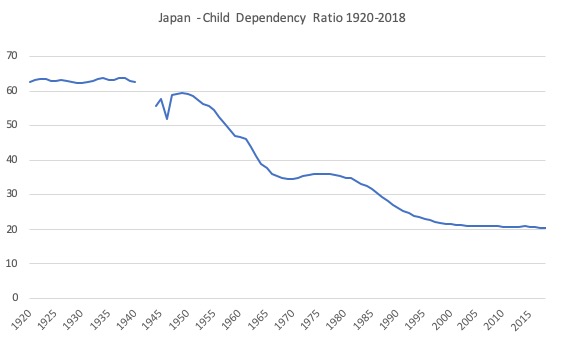
The next graph shows the Child dependency ratio over the same period.
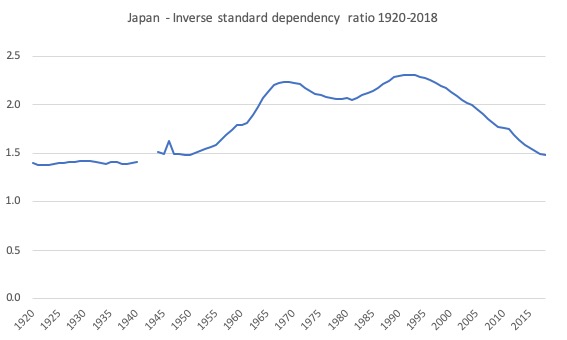
Finally, the next graph is the inverse dependency ratio, which tell us how many productive workers there are per non-productive person in the population.
For Japan this peaked at 2.31 in the early 1990s and is now at 1.48. As I show next it is projected to fall to 1.03 by 2050.
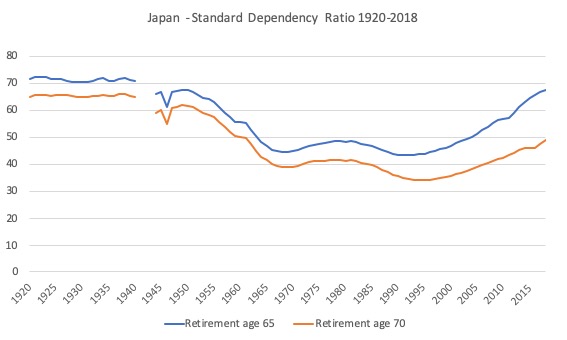
The next graph shows the difference in the standard dependency ratio if the retirement age was to be lifted to 70 years of age.
You can see why the push is on to increase the retirement age. The gap between the two lines is diverging as more baby boomers pass into the above 65 years bracket.
The problem with these sorts of remedies is that they are typically very inequitable across the occupational structure. Manual workers face great difficulties working into their later years.
And they are projected to keep rising
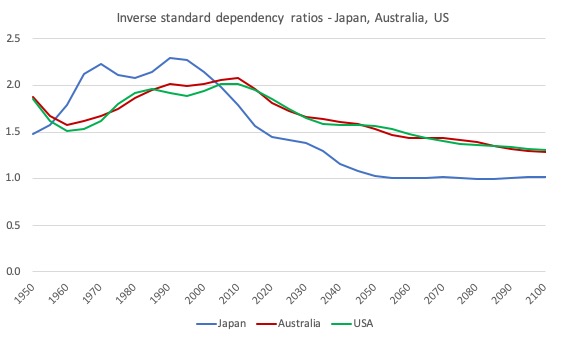
The UN Department of Economic and Social Affairs, Population Division publishes regular – World Population Prospects – (latest 2019), which provide projections out to 2100 based on various assumptions (birth and death rates, migration rates, etc).
The following graphs are drawn from that database and show the Standard Dependency Ratios for Japan, Australia and the US from 1950 to 2100 (top graph) and then the inverse dependency ratios (bottom graph).
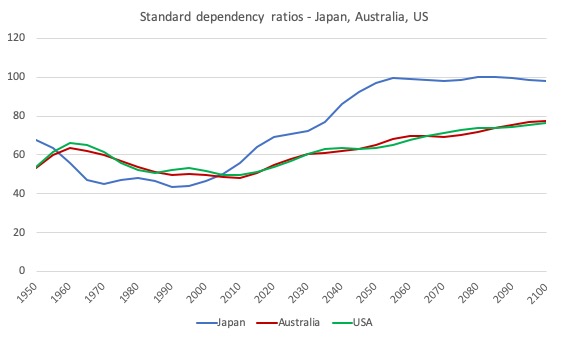
In 2015, there were 1.56 workers for every dependent person in Japan, 1.96 in Australia and 1.95 in the US.
By 2050, the UN estimates this ratio will fall to 1.03 for Japan, 1.53 for Australia and 1.57 for the US.
Effective dependency ratios
The standard dependency ratio is not without issues and the concept of an Effective dependency ratio was introduced to address a major issue – that not everyone of working age (15-64 or whatever) are actually producing goods and services.
There are many people in this age group who are also as ‘dependent’ for goods and services as are retired persons and children.
For example, full-time students, house parents, sick or disabled, the hidden unemployed, and early retirees fit this description.
The Effective dependency ratio is thus calculated as the ratio of economically active workers to inactive persons, where activity is defined in relation to paid work.
This, arguably, provides a more accurate indicator of the burden on the current workforce.
We can take this concept one step further though.
We should also include the unemployed in this category although national statisticians count them as being economically active.
It is clear that the unemployed are ‘dependent’ on the production of those in employment. One could also make a case for the underemployed, although that is not as clear cut.
But in this neo-liberal era of mass unemployment, we get quite a different picture of the problem of dependency.
If we use the UN data, then our estimate for Japan of the standard dependency ratio for 2015 was 63.5 per cent.
Taking into account the actual labour force data (participation rate and unemployment rate), the effective dependency ratio for Japan in 2015 was approximately 184 per cent.
Increasing participation rates from the low in 2015 of 59.6 per cent to rates achieved during the 1970-1990s period (around 63 per cent) and reducing unemployment rates to the low levels previously attained (1.1 per cent in 1970), would produce an effective dependency ratio of 163 per cent in 2015.
Projecting out to 2050 (using UN population projections and holding participation and unemployment rates constant at the 2018 level) produces rough effective dependency ratio estimates for Japan of 228 per cent, Australia 164 per cent and the US 169 per cent.
Quite a different picture, which should focus policy makers on the importance of maintaining low unemployment and eliminating underemployment.
Japan has more scope to increase participation than reduce unemployment given its relatively low unemployment rates. For a nation such as Australia, the greatest initial gain that can be made to reduce dependency ratios would be to restore true full employment.
When comparing say Japan and Australia, even though the standard dependency ratio is higher for Japan, once we take into account the much lower unemployment rates in Japan (2018 = 2.4 per cent Japan; 5.2 per cent Australia) offset by the higher participation rates in Australia, then the difference between the effective rates narrows relative to the difference between the standard ratios.
What is the problem?
In the January/February 1999 edition of the influential US magazine Foreign Affairs, Peter G. Peterson’s Op Ed – Gray Dawn: The Global Aging Crisis – provided a sort of rallying cry for the use of rising dependency ratios to justify conservative attacks on fiscal activism.
Peterson, of course, was a Wall Street banker (Lehmans, Blackstone) and served in Nixon’s administration and later pumped a fortune into his own foundation which became a leading voice against fiscal deficits, public debt advocating all sorts of cuts to social security and health care.
So his slant on the ageing society issue was hardly surprising.
The 1999 article expressed doubt about “global warming” but said “there can be little debate over whether or when global aging will manifest itself”.
He said that:
And unlike with other challenges, even the struggle to preserve and strengthen unsteady new democracies, the costs of global aging will be far beyond the means of even the world’s wealthiest nations — unless retirement benefit systems are radically reformed. Failure to do so, to prepare early and boldly enough, will spark economic crises that will dwarf the recent meltdowns in Asia and Russia.
How we confront global aging will have vast economic consequences costing quadrillions of dollars over the next century. Indeed, it will greatly influence how we manage, and can afford to manage, the other major challenges that will face us in the future.
He also wrote that the rising dependency ratios created:
… a threat more grave and certain than those posed by chemical weapons, nuclear proliferation, or ethnic strife …
The contention that has become a common claim by mainstream economists and others, who seek to benefit from cuts to social security and other government spending that doesn’t directly benefit them, is that governments will become insolvent as their tax bases shrink as the dependency ratios rise and their expenditure on aged care (pensions and health etc) rise significantly.
As a result, if the ratio of economically inactive rises compared to economically active, then the economically active will have to pay much higher taxes to support the increased spending.
So an increasing dependency ratio will blow the deficit out and lead to escalating debt – which will eventually become unsustainable.
In other words, the ageing society issue is just seen as a subset of the overall mainstream belief that currency-issuing governments face binding financial constraints which limit their spending and impose problems of fiscal sustainability (solvency) when the demands on that spending increase.
These claims should be rejected out of hand.
While rising dependency ratios can signal a problem, the issue is not related to financial solvency of government.
The mainstream approach exhorts governments to:
1. Introduce policies that force us to work longer despite this being very biased against the lower-skilled workers who physically are unable to work hard into later life.
2. Increase our immigration levels to lower the age composition of the population and expand the tax base.
3. Cut back on the quality and quantity of the welfare services and pension entitlements that form the backbone of our civil society because they (allegedly) represent ‘living beyond our means’.
However, all of these remedies and others miss the overall point.
The ageing population problem It is not a financial crisis that beckons but a real one.
The real problems are productivity and real resource availability.
For example, are we really saying that there will not be enough real resources available to provide aged-care at an increasing level over time?
That, of course, is never the statement made.
The worry is always that public spending outlays will rise because more real resources will be required ‘in the public sector’ than previously.
But as long as these real resources are available then it only remains a political problem as to where they are used.
There is no financial problem.
If there is a political will then the currency-issuing government (such as Japan) will always be able to bring the available resources into a desired use.
Primary schools investment will give way to aged care investment.
Investment in pre-school infrastructure and allowances will give way to pensions as the demography changes.
And this is where climate change issues intersect with the ageing society issues.
Our children will inherit the world when we are gone and they will be the aged when we are gone.
If we trash the real resource base now, then they will face a gloomier future than, say, we had.
But it goes beyond real resource availability and becomes a productivity challenge.
In this context, the type of policy strategy that is being driven by the financial constraint myths typically undermine future productivity growth and provision of real goods and services in the future.
It is clear that the goal should be, for example, to maintain efficient and effective medical care systems.
Clearly the real health care system matters by which I mean the resources that are employed to deliver the health care services and the research that is done by universities and elsewhere to improve our future health prospects.
That is, a nation has to ensure that there are real facilities and real know how to maintain an effective health care system.
Further, productivity growth comes from investments in research and development, not the least part, in universities and other research institutions.
Unfortunately, tackling the problems of the distant future in terms of current ‘monetary’ considerations (fiscal sustainability, insolvency fears, etc) have led to the fiscal austerity bias and underinvestment in vital infrastructure.
And by trying to solve the ‘non-problem’ now we worsen the real problem as time unfolds.
Conclusion
In Part 2, I will write more specifically about the productivity challenge and some of the policy options that have been proposed for the Japanese government in this context.
Some of the data is quite revealing.
That is enough for today!
(c) Copyright 2019 William Mitchell. All Rights Reserved.
If productivity increases, it can overcome aging and lead to a greater average per capita income. What is not possible is to avoid that a greater share of the income of those who work will be transferred to those who do not work. Suppose that we have 100 adults, of whom 70 are working. Let’s assume that average productivity of those 70 workers is 10,000 and that the non-workers get 60% of what the workers get after deduction of the pension premium.
The workers then get 7954 after paying the pension premium. The non-workers get 4772, 60% of 7954, and per capita income is 7000. The workers have to pay 20.46% of their income as a pension premium.
Now let’s suppose that of 100 adults 50 are working. Their productivity has risen to 20,000. Per capita income is now 10,000. The workers have 12,500 left after paying the pension premium, and the non-workers get 7500. Everybody, workers and non-workers alike, have higher incomes, but the workers now have to pay a whopping 37.5% of their income as a pension premium.
For analytical simplicity, I ignored children here.
@ James Schipper
No, let’s not assume your assumptions.
Let’s instead assume:-
1. old age pensions are made “pay-as-you-go” (ie not funded but paid with money created by govt)
2. if (all else equal) the demand created thereby exceeds the capacity of the economy for producing enough real goods and services to satisfy it, a commensurate cut-back in other govt expenditure and/or increased taxation to drain-off the excess demand and/or cause re-deployment of the necessary real resources (or some combination of these) are applied
3. the standard old-age pension is linked to average incomes of the employed, and every pensioner gets the same amount
4. if higher earners want greater affluence in retirement than the standard pension would afford them they pay for that themselves, through paying premiums out of their employment-earnings into private insured schemes, as a matter of personal choice (such premiums not being tax-deductible)
…
(I could elaborate further, but I think you’ll get my drift).
Given some such a set of alternative assumptions, your conclusions cease to apply. In particular, “a greater share of the income of those who work will (NOT) be transferred to those who do not work”.
So isn’t it simply a matter of making *political* choices?
As always?
Japan youth face tough conditions, an increasing number having to work in uncertain conditions, while the stable well-paid jobs are declining in number.
I don’t know if that is a cause of the very low Japanese fertility rate, but it certainly doesn’t help young families cope in an often expensive property market.
> … a threat more grave and certain than those posed by chemical weapons, nuclear proliferation, or ethnic strife …
I mean, since he wants old people to be destitute, he’s not wrong.
So let me see – Japan, with a low fertility rate, will have a moderately but not extremely high dependency ratio. And it has a per-capita GDP of about $45,000, and the stable population means that it doesn’t need vast new infrastructure (like living in a house with the mortgage paid off). So even if there are a relative lot of dependents per worker, overall productivity is more than enough to cover this.
And in a place like Somalia, with sky high fertility rates, you have few old people per worker but a lot more children, the dependency ratio is likely not lower and maybe higher than Japan. But because high fertility rates cause poverty, per-capita GDP is what, $2,000? And the growing population means there is a massive need for investment for new infrastructure? This is a way worse situation than Japan, yes?
So obviously the problem is that Japan should have its population forced upwards so that it can become more like Somalia. That makes sense. Not to me, but it makes sense.
行って来ます、ビールさん。 頑張ってください!
If Japan does not take Bill’s advice, what a shame, but eventually a nation, whether more developed or less developed, WILL, and then we’ll have an irrefutable real world demonstration that the axioms of MMT, when consistently applied on a national level, do indeed accurately describe AND PREDICT what happens in macroeconomics. Given the scope of agency that MMT opens for us to build a better society than has yet existed, THAT DAY, when Bill’s advice (and that of other MMT economists) is finally taken will mark a milestone in human history. Yes, it’s THAT big a deal, which is why Bill relentlessly pushes himself far harder than I could image.
Hello, Bill Mitchell.
What is written here captures exactly what is being discussed in Japan.
I’m really looking forward to the symposium in Japan.
“Taking into account the actual labour force data (participation rate and unemployment rate), the effective dependency ratio for Japan in 2015 was approximately 184 per cent.”
Did it read it wrong?! 63.5 –> 184 percent!? neoliberals love shooting their own feet.
Peterson proved that you don’t need a brain to work in wall street.
“And this is where climate change issues intersect with the ageing society issues.”
“The IPCC report that the Paris agreement based its projections on considered over 1,000 possible scenarios. Of those, only 116 (about 10%) limited warming below 2C. Of those, only 6 kept global warming below 2C without using negative emissions. So roughly 1% of the IPCC’s projected scenarios kept warming below 2C without using negative emissions technology like BECCS. And Kevin Anderson, former head of the Tyndall Centre for Climate Change Research, has pointed out that those 6 lone scenarios showed global carbon emissions peaking in 2010. Which obviously hasn’t happened.
So from the IPCC’s own report in 2014, we basically have a 1% chance of staying below 2C global warming if we now invent time travel and go back to 2010 to peak our global emissions. And again, you have to stop all growth and go into decline to do that. And long term feedbacks the IPCC largely blows off were ongoing back then too.”
“Today’s global consumption of fossil fuels now stands at roughly five times what it was in the 1950s, and one-and-half times that of the 1980s when the science of global warming had already been confirmed and accepted by governments with the implication that there was an urgent need to act. Tomes of scientific studies have been logged in the last several decades documenting the deteriorating biospheric health, yet nothing substantive has been done to curtail it. More CO2 has been emitted since the inception of the UN Climate Change Convention in 1992 than in all of human history. CO2 emissions are 55% higher today than in 1990. Despite 20 international conferences on fossil fuel use reduction and an international treaty that entered into force in 1994, manmade greenhouse gases have risen inexorably.”
Then William Dawbney Nordhaus ‘could be right’ and 2%+ is ‘manageable’?