I saw a clip from John Stewart's Daily Show yesterday where he showed some Fox…
What is the problem with rising dependency ratios in Japan – Part 2?
This is Part 2 of my blog posts on population shifts in Japan. In – What is the problem with rising dependency ratios in Japan – Part 1? (October 28, 2019) – we considered the evolution of dependency ratios in Japan as a precursor to considering the nature of problems that accompany a rising dependency ratio. The purpose is to disabuse the public debate of the idea that rising dependency ratios constitute a fiscal crisis and point to the increasing prospect of fiscal insolvency. That erroneous assertion has been used as one of the justifications for pursuing austerity policies, which damage growth, cause rising unemployment and generally miss the point. The problem with this construction is that the solution adopted by the ‘sound finance’ lobby (austerity) to their ‘non problem’ only serves to exacerbate the real problem. Today, we will consider the productivity challenge that lies at the heart of the issues a nation with a rising dependency ratio will face.
Population shift in Japan
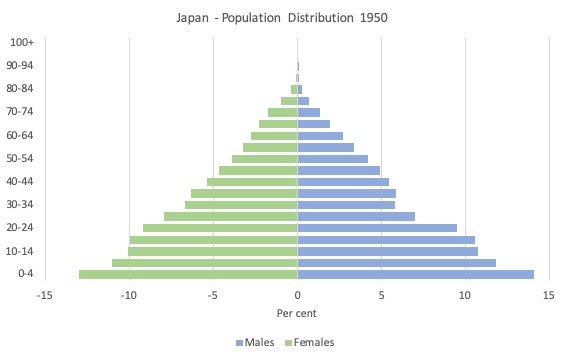
I meant to insert these population pyramids in yesterday’s blog post (Part 1) to provide a graphical indication of the shifting population over a century (using UN estimates out to 2050).
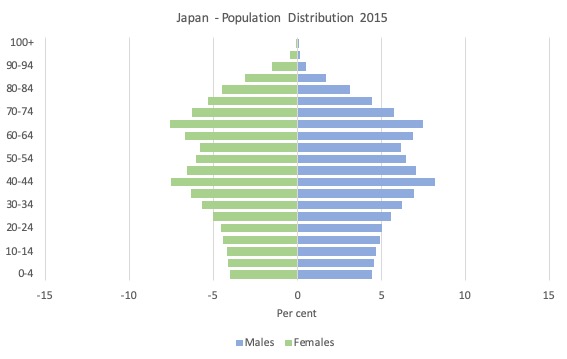
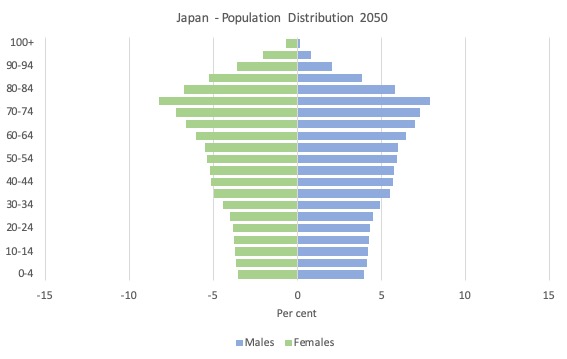
The three graphs are for the actual population distribution as at 1950, 2015 and then the projected population in 2050.
For those not familiar with these histogram depictions, we gauge the speed of population growth by the shape (rectangular or more pyramid) of the graph.
When the graph becomes rectangular, the population is growing slowly relative to the 1950’s shape. That is, the older cohorts are being replaced by younger cohorts at around the same pace.
Youth dependency ratios that are derived from this data can be high when the graphs are highly pyramidic in nature. It means that a larger proportion of the population are in or approaching their ‘fertile’ or reproductive period but will soon be productive workers.
This is a different situation when the Aged dependency ratio is high.
1950
2015
Projected 2050
The productivity challenge
In – What is the problem with rising dependency ratios in Japan – Part 1? – I concluded by asserting that the problem of rising dependency ratios (however measured) were two fold:
1. Ensuring that all available productive resources are fully utilised. There is no point screaming about a rising dependency ratio if we tolerate our government’s choosing to waste what resources that are available and willing to work (or be put to work in the case of capital).
2. Productivity.
In the second case, the challenge is simple.
If there are increasingly more people dependent on access for goods and services and increasingly less people producing those goods and services then the latter cohort has to be more productive than before or material standards of living will fall, independent of whether real resources are available or not.
Productivity rises when a nation gains more output per unit of input.
That, ultimately becomes the real challenge of the ageing society once the politics is sorted out to ensure we provide job opportunities and hours of work for those who desire to work.
As I noted in Part 1, constructing the ageing society problem in terms of a challenge of government solvency (the ‘non-problem’) is not only based on erroneous reasoning and a misunderstanding of the capacities of the currency-issuing sovereign, but, also, can lead to policies that actually undermine the capacity of the society to meet the actual problem – maintaining full employment and adequate productivity growth.
Many nations have adopted an austerity bias as the neoliberal era unfolded and have seen output rates decline and productivity growth stagnate as a result of suppressed investment in productive capital, reduced skill development and declining scope and quality of public infrastructure.
It is all related.
To advance productivity, investment is required in human capital and physical capital including public infrastructure. Starving a nation of that sort of investment is the fastest way to undermine material living standards in the future as society ages.
I will return to desirable policy development presently.
But I was curious as to how Japan had fared in relation to productivity as its dependency ratio has been rising. I was also curious to compare this performance to the US, which has a much lower but rising dependency ratio.
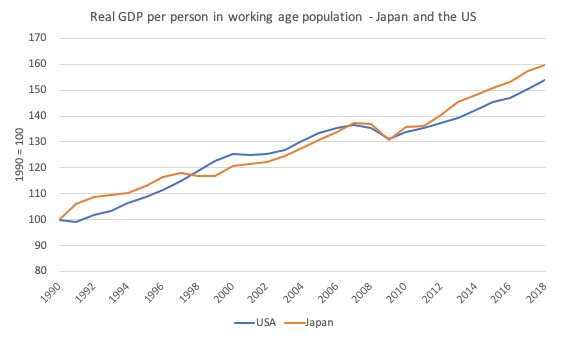
The following graph shows the ratio of real GDP (output) to the working age population in Japan – which is one way of expressing productivity – from 1990 to 2018 (with the index set at 100 in 1990).
Clearly, once we understand the concept of an effective dependency ratio, we would qualify the use of the denominator (to use the subset of the working age population that is actually working).
Japan’s population is declining and ageing as a result of the low birth rates and low net migration.
Its labour force participation rate has also declined. For example, in 1953 it was 70 per cent. By 2018, it had fallen to 61.5 per cent.
I will come back to the participation question presently.
In terms of the first graph, one can conclude that despite the working age population declining somewhat over this period from 87,035 thousand in 1994 to 75,451 thousand in 2018, productivity per person has risen significantly with two notable periods of stagnation or decline.
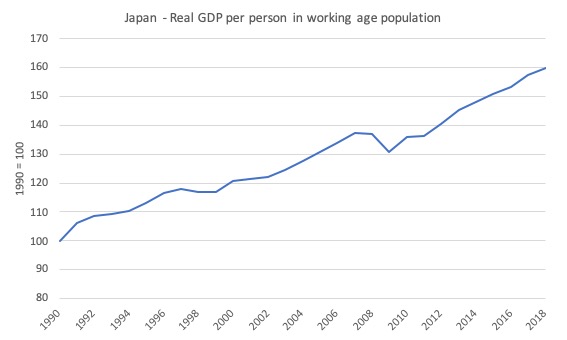
The first period of decline in the early 1990s was related to the massive commercial property collapse that occurred in 1991 and shook the foundations of the Japanese economy.
The second period of decline and stagnation was following the sales tax hike in 1997, which derailed growth.
In 1996, the economy was showing strong signs of recovery after the disastrous property bubble burst in the early 1990s.
Real GDP growth on an annualised basis was gathering pace in 1996 – March-quarter 2.9 per cent, June-quarter 2.5 per cent, September-quarter 1.8 per cent, then December-quarter 3.4 per cent, sustained into March-quarter 1997 3.3 per cent.
There was strong growth in private business investment and housing construction.
Then, under pressure from fiscal conservatives who claimed Japan would become insolvent, the Japanese government hiked sales taxes from 3 per cent to 5 per cent in April 1997.
And what happened? The bottom fell out.
At the time, the neo-liberals claimed the tax hike had nothing to do with the prolonged recession that followed – 7 negative quarters of growth in the next two years – which also entrenched the damaging deflation that Japan has had to face.
The claims were that the Asian financial crisis were to blame. But a closer examination of Japan’s export performance at the time categorically discredits that claim. The net exports deficit fell over the period of the recession, mostly due to a collapse in imports as the domestic economy waned.
This period of recession really blunted capital investment and productivity growth slumped.
See these blog posts (and links to earlier posts within) for a discussion of the sales tax disaster:
1. Japan about to walk the plank – again (September 30, 2019).
2. Japan is different, right? Wrong! Fiscal policy works (August 15, 2017).
In April 2014, the Abe government raised the sales tax from 5 per cent to 8 per cent.
The third period of decline is, of course, the GFC.
But the significant fact is that if we compute the average annual growth rate in this series for the period 1990 (just before the property collapse) to 2018, we find it was 1.9 per cent per annum.
That is hardly a stagnating outcome and suggests that Japan is handling its ageing workforce fairly deftly (in material terms).
But here is a surprise. The next graph compares Japan’s experience in this respect with the US over the same period (1990 to 2018).
One society is meant to be collapsing from the burden of ageing while the other is the powerhouse of innovation!
Further, the average annual productivity growth rate for the US for the period 1990 to 2018, was 1.5 per cent per annum.
That is, considerably lower than Japan, which has accelerated ahead of the US in productivity growth (as measured) since the GFC.
Labour force participation
As noted above, as well as facing an ageing population, participation rates have dropped in Japan over the last several decades.
In 1953 it was 70 per cent. By 2018, it had fallen to 61.5 per cent.
In terms of the 2018 working age population (15 years and over), which was 111,010,000, that drop in participation amounts to that amounts to an extra 9,435,850 workers that would be available for work had not the participation rate fell.
Part of the participation issue is the almost constant and low involvement in the active labour force by females in Japan.
The following two graphs tell the empirical story.
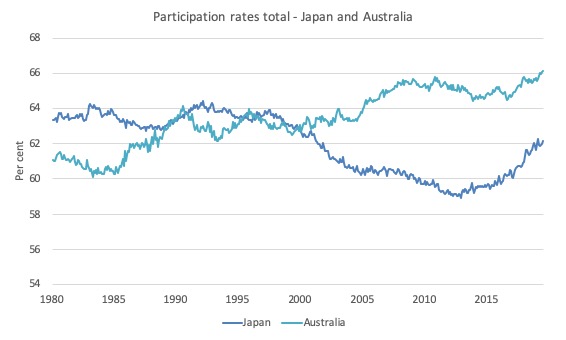
The first compares the Japanese aggregate participation rate with that of Australia, which also faces an ageing society issue, although not as profound as that of Japan.
The participation rate in Japan fell steadily over the 1990s but since the GFC there has been a noted rise, mostly due to increased female participation.
Australia has shown a different pattern of steadily rising participation with noted cyclical slumps.
The difference between the two labour markets in this respect is significant. There is much more unused productive capacity in the Japanese labour market than in the Australian case, despite the higher rates of labour wastage of the existing labour force in Australia.
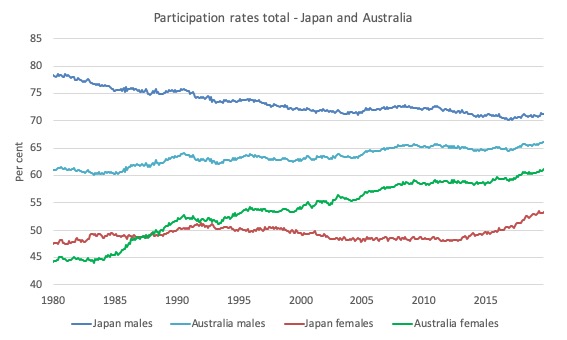
The second graph shows the evolution of the male and female participation rates for Japan and Australia. While the Australian female participation rate has been steadily rising since the 1970s, it is only in recent years has there been any significant upward movement in the female rate for Japan.
Policy strategies
One has to be cautious when discussing specific policy options for a nation because historical and cultural differences can become important in determining the legitimacy in a democratic sense of difference options. What might be suitable for one nation may not be acceptable elsewhere.
In terms of the productivity challenge, for all practical purposes there is no real investment that can be made today that will remain useful 50 years from now apart from education.
Ensuring high levels of participation in education, creating effective school-to-work transitions with appropriate training ladders, and ensuring the macroeconomic climate is such that there are sufficient jobs should be the policy priority.
Apart from the investment in people, productivity growth comes from investments in research and development, not the least part, in universities and other research institutions.
Increasing labour force participation by older workers (and in Japan females) is sound but requires the government ensure there are productive employment opportunities available.
Running an austerity policy stance in the erroneous belief that the government has to ‘save’ money to fund future health care and pension demands, which reduces employment growth, but, at the same, time coercing older cohorts (or females) into higher levels of labour force participation is the worst combination of policies.
It is self-defeating and punitive.
Anything that has a positive impact on the dependency ratio is desirable and the best thing for that is ensuring that there is a job available for all those who desire to work.
Further encouraging increased casualisation and allowing underemployment to rise is not a sensible strategy for the future. The incentive to invest in one’s human capital is reduced if people expect to have part-time work opportunities increasingly made available to them.
But all these issues are really about political choices rather than government finances.
The ability of government to provide necessary goods and services to the non-government sector, in particular, those goods that the private sector may under-provide is independent of government finance.
The reality is that fiscal drag that accompanies austerity reduces growth in aggregate demand and private disposable incomes, which can be measured by the foregone output that results.
Clearly surpluses help control inflation because they act as a deflationary force relying on sustained excess capacity and unemployment to keep prices under control.
A number of policies have been implemented in Japan or proposed to address the ageing population issue.
In December 1994, the Government introduced the – Angel Plan – which ran from fiscal year 1995 to 1999 and was an attempt to increase the birth rate and female participation through childcare support measures.
In December 1999, the ‘New Angel Plan’ was introduced to cover the next five year. This plan continued the investment in childcare, and added housing initiatives for better family accommodation as well as subsidised education.
A series of policy interventions followed: the 2003 “Act on Advancement of Measures to Support Raising Next-Generation Children”, the 2003 “Basic Act for Measures to Cope with Society with Declining Birthrate”, the 2004 “Child-rearing Support Plan”, the 2006 “New Measures for Declining Birthrate”, the 2007 “”Key Strategies” initiative – all aimed to improve the birth rate and make it easier for families to exapand and for women to combine work and family responsibilities.
In more recent period, the emphasis on increased female labour force participation has strengthened with various plans aimed at making it easier for women to combine child rearing and work.
Other policies include the “Formulation of Comprehensive After-School Plan for Children” (from July 2014) to improve child care facilities; “Efforts for Regional Revitalization” (from September 2014) to increasing youth employment opportunities outside of Tokyo and to generally promote activity in regional centres; the “New Outline of Measures for Society with Declining Birthrate” (from March 2015) which continues to provide incentives for child birth, helping families cope with more children, reducing mens’ working hours etc.
The Japanese government has identified five important areas of policy development in this context:
1. “Further improvement of childrearing support measures”.
2. “Realisation of young people’s hopes for marriage and childbirth”.
3. “Consideration to multiple child families”.
4. “Changing the way of working of men and women”.
5. Reinforcement of measures according to regional situations”.
All of these policies are sound and will help to change the existing practices.
Unfortunately, the Japanese government has also fallen prey to the erroneous fiscal crisis narrative.
The question of labour market dualism in Japan is also raised in this context.
What is it? Why does it matter?
In the Japanese context, dualism refers to “the separation between regular and non-regular employment” (OECD reference that follows).
The rising proportion of non-regular jobs – casualised, low or irregular pay, with little promotional prospects or security – provide no incentives to an individual or firms to invest in human or physical capital, which is essential for increasing future productivity growth.
In this government document (published September 2018) – Abenomics: For future growth, for future generations, and for a future Japan – we learn that the Government aims to use its legislative authority to introduce “equal pay for equal work” and to:
Eliminate the irrational gaps in the working conditions between regular and non-regular workers in order to enable non-regular workers to be fairly evaluated and to work with higher motivation
On December 20, 2018, the OECD published – Working Better with Age: Japan (Executive Summary and Recommendations) – which notes that one of the obstacles for increasing employed participation of older workers is the fact that such workers (after formal retirement):
… often face large wage cuts even when re-hired, usually as non-regular workers, and their skills may be underutilised. This can undermine their productivity and well-being.
At the same time, there has been a trend increase in non-regular jobs, with close to two- fifth of the Japanese workforce employed in non-regular positions in 2018, up from less than one-fifth two decades ago. This has meant that many workers find themselves in irregular jobs that are typically paid less than full-time regular employees, offer limited access to training and lack proper social security protection. Consequently , their employability is weakened in terms of opportunities for career progression and to remain longer in employment at an older age as well as undermining their old-age pension entitlements.
A ‘race-to-the-bottom’ strategy, which is characteristic of the neoliberal era to shift power into the hands of capital is the opposite of a strategy to achieve a high-pay, high productivity economy.
The OECD note that “By international standards, the quality of working conditions as measured by job strain (the difference between job demands and job resources) is poor on average in Japan compared with some other advanced OECD countries.”
They point to “excessive work hours”, “a lack of autonomy and support from colleagues” and other negatives which deter “some older people from working longer and may be preventing some women, especially mothers, from entering employment at younger ages and pursuing longer work careers.”
One of the positive steps the Government can take is to increase the labour force participation of women, which means there have be better prospects for re-entry into the workforce after child birth.
The OECD report that “Far more Japanese women than men work in non-regular jobs” and that:
Many women who leave the labour market to have children find they can return only to a non-regular job, with a junior, part-time position.
Reform is needed to ensure that women do not feel disadvantaged in future labour market involvement by decisions to have children.
In this regard, the policies that the Japanese government has introduced (for example, the 2004 ‘Stabilisation of Employment of Older Persons’), which aim to extend the working lives of older workers have not been successful because while they have increased employment of this cohort per se, the firms have responded by cutting wages and other entitlements for workers once they reach the mandatory retirement age.
To address this problem, increases in the mandatory retirement age is necessary, but then as noted in Part 1, this introduces inequities across the occupational distribution with manual workers facing a disadvantage due to the physical strain of their jobs.
So there has to be a suite of policies to:
1. Extend the compulsory retirement age, which will eliminate the threshold that employers use to renegotiate wage cutting contracts for workers who wish to continue working.
2. Ensure that wages and conditions are retained into older age with existing or new employers.
3. Provide just transitions for manual workers disadvantaged by the extended compulsory retirement age.
The OECD recommend eliminating the dualism by attacking the conditions of workers in regular work (reducing job protection etc). This is not a sensible strategy as the internal labour market system where workers enjoy seniority etc (so-called ‘implicit contracts’) has been found by numerous studies to increase productivity not undermine it.
The emphasis should be on improving the lot of non-regular workers rather than tearing down the conditions for regular workers.
The research literature is clear – healthier workers can work longer at higher levels of attainment.
It also shows that higher income workers can work longer.
Governments can influence the health of populations in significant ways – reducing contagious illnesses through free innoculations, especially illnesses that have disproportionate impacts on older workers, such as shingles, flu, pneumonia, etc);
improving nutrition, diets and exercise through national campaigns, and reducing alcohol and substance abuse including tobacco, among other initiatives.
The so-called ‘cost’ in financial terms of such initiatives are irrelevant for a currency-issuing government. The only consideration is not to waste real resources, which means that interventions should be as effective as possible.
The Downside
Unfortunately, the Japanese government has also fallen prey to the erroneous fiscal crisis narrative.
The recent increase in the consumption tax is an expression of this and will work against the sensible initiatives it has put in place because it will damage economic growth and reduce employment opportunities.
The erroneous fiscal narrative is also evident in the changes that the Government is making to the eligible ages for pension entitlement.
I will leave that for another day.
Conclusion
I will be in Japan later this week to discuss these issues and others.
That is enough for today!
(c) Copyright 2019 William Mitchell. All Rights Reserved.
Bill, you wrote, “The first period of decline in the **early 1990s** was related to the massive commercial property collapse that occurred in 1991 and shook the foundations of the Japanese economy.”
But the period of decline I see was in the late 90s not the early 90s.
It may have been related to the Asian Tiger financial problem of the late 90s.
But, I’m very ignorant compared to an actual expert.
How the erroneous fiscal narrative can hold in Japan is beyond unbelievable!
Deficits since the 90s and a debt to GDP ratio of well over two hundred percent. The BoJ owns the majority of that debt. No rising interest rates, no punishment from bond markets, nothing the orthodoxy predicted has come true.
I suppose though if the emperor believes his suit is invisible to those unfit for their positions then the fallacy he is wearing a new suit prevails.
Please Bill, consider making the key bars for the color coded graphs wider/up-down or something.
I can’t tell the colors apart and I’m not colorblind.
I can see the colors on the graphs OK, but not in the Key.
Please Bill, consider making the key bars for the color coded graphs wider/up-down or something.
I can’t tell the colors apart and I’m not colorblind.
I can see the colors on the graphs OK, but not in the Key.
I can’t be the only one.
Sorry, delete the 2nd post, please.
I don’t see slow population decline as a problem, although it has the disadvantage of aging, which is at least partially offset by what the Dutch call ontgroening = ungreening, that is, fewer people in the unproductive age bracket of 0 – 18 (15). It should be born in mind, however, that the big losers of population decline will be real estate owners and the construction industry. They will be a lobby for countering population decline.
One thing that we should do, apart from reducing the non-participation in the labor market by people of working-age, is to change the definition of working age. The best definition, in my opinion, is 20 – 69. A senior should be redefined as a person of 70 years or older. Granted, many people under 70 aren’t fit to work, but many people under 65 aren’t fit to work either. For them there should be a disability pension. What many people want nowadays is to retire at 55 and to live till 100. In other words, they want a long vacation of 45 years.
Business in general is interested in population growth. That’s why business is always lobbying for more immigration. Suppose that we have a city of 250,000. It has one restaurant for every 500 people, so there are 500 restaurants. Now the population of the city increases to 300,000. With the same ratio, the number of restaurants will increase to 600, so that means more customers for restaurant owners. If the population of the city declines to 200,000, the number of restaurants will fall to 400 with the same ratio. For restaurant workers and diners, this is not necessarily bad because there are fewer of them, but for restaurant owners, it means fewer customers.
We sometimes read that the great plague in Europe, which eliminated about a quarter of the population, was an economic disaster as well. It certainly was for the landowners, but not for the peasants. Imagine that a landowner had 100 peasants toiling for him before the plague. After the plague, he had only 75 peasants to exploit. Pity him! For the peasants, it meant more land per capita and greater bargaining power.
We should never forget that the population question is also a class issue. By and large, it is the propertied classes which are interested in greater populations. They will always lobby for more immigration and see population decline as a disaster. For the rest of us, the main issue is the age distribution, not the the size of the population.
Unfortunately, the propertied classes also include all house owners, who see their house not as a consumer durable but as an investment, the value of which will be reduced by population decline.
“The OECD recommend eliminating the dualism by attacking the conditions of workers in regular work (reducing job protection etc).”
Another day at the OECD office
When countries put in place a Victorian retirement age policy. Work till you drop.
It must have a knock on effect. As in more and more people will save and stop consuming so they can retire early?
When house prices get too high and children have to stay with their parents until their 30’s just to save for a deposit for a house must have a similar knock on effect.
With parents and children saving instead of spending no wonder growth rates are not what they used to be. Inflation rates are no longer a real threat with deflation becoming the new buzz word.
Another set of brilliant blogposts. Sorry I haven’t been reading them for longer.
You may think this irrelevant, Bill, but one thing that concerns about Japan is the rate of child suicides because of the pressure to do well at school. With the decline in job security this will surely increase.
I am red-green colorblind too, Its very hard for us to see those colors.
Great article and great comments.
Part of me thinks that this wouldn’t have been such a big problem if politicians and economists have had people’s well-being in mind in the first place.
You won’t have let unemployment, housing market, sexist work policies, and other stuff get so out of hand (out of negligence or just the suck-it-up mentality) so that people are refusing to have kids.
Even now, a lot of them are refusing to deal with it.
How is productivity measured anyway? i will have to check. Certainly calling real estate asset price inflation growth is pretty silly.
Great blog series. Thank you.
The feminist in me worries a little about women being seen as the productivity solution. Work at home. And now more work outside the home. Men must also become more productive in the domestic sphere if women are to produce more in the “real” economy. Putting empty biscuit packets in the bin rather than back on the pantry shelves for example.
@Carol,
I don’t think it’s a Japan only issue anymore. I’ve seen an article on the US, and another about Portugal (were I live). Sadly, I’m pretty sure it’s just another data point on this folly to be ignored by the very serious people doing very responsible policies.
@cs
Something like this? https://www.pinterest.pt/pin/522558362995493481/
Cs,
You are right.
Women are now working AND doing homemaking. Its ridiculous.
I can’t see how driving up female labour participation rates is anything but a road to extinction. Raising children is hard. If there are policies that push hard for women to become careerists they’re just not going to start families early enough to have more than one child or even at all. I feel like women are being sold a lie that is robbing them from the joy of family life and ultimately dooming humanity to extinction.
tilmitt,
Thats a great point.
Lately, I have been pretty upset about how people look down on housewives.
Seems to be alot of mental gymnastics are made to help us to accept the domination of capital.