Today (June 3, 2026), the Australian Bureau of Statistics (ABS) released the latest - Australian…
Australian national accounts – the economy is grinding to a halt
I am in Brisbane today as an expert witness in an industrial hearing where the public education workers are trying to secure a wage increase in the face of fierce opposition from the Labor State government who insist on maintaining a wage cap that is depressing income growth and helping to cause the economic slowdown. The Government’s defense is that a wage rise would damage their fiscal plans which are to record recurrent surpluses of such magnitude that they can fund all capital spending out of recurrent revenue. Yes, a modern Labor government at work. They seem unable to that their suppression of wages growth is undermining overall growth, which undermines their tax revenue and makes their ridiculous fiscal goal unattainable anyway. Walking around in increasingly smaller circles. Anyway, it was a good day to be discussing these matters as it coincided with the latest release by the Australian Bureau of Statistics of the – June-quarter 2019 National Accounts data (September 4, 2019). That data shows that annual GDP growth of 1.4 per cent (down from 1.6 per cent) and now around 1/3 the historical trend rate. This is a very poor on-going result. The weaker performance started in the last 6 months of 2018 and has continued into the first six months of 2019. However, due to a fairly strong terms of trade, Real net national disposable income rose, which signifies rising material living standards. But those terms of trade gains will prove to be ephemeral and a related to disturbances in world markets (Brazil, etc). Overall, the quarterly growth rate was just 0.5 per cent. Net exports were strong (terms of trade effect) and government consumption expenditure was strong courtesy of some policy measures in disability, health and aged care coming on-line. Their boost will also dissipate fairly quickly. Longer-term worries include the weak household consumption growth and the on-going negative business investment growth. Further, the fall in the saving ratio once again illustrates the folly of suppressing wages growth through wage caps etc. It is also apparent that the positive spending effects of the large government infrastructure projects (State-level) are now working their way through the system and their impact is declining. The overall picture is not good and the future is looking rather dim at present. A major shift in fiscal policy towards expansion is definitely now required.
The main features of the National Accounts release for the June-quarter 2019 were (seasonally adjusted):
- Real GDP increased by 0.5 per cent for the quarter – signalling continuing weakness. The annual growth rate was 1.4 per cent (and falling), well below trend.
- Real GDP per capita growth was zero per cent.
- The main positive contributors to real GDP growth were Net exports (0.6 percentage points), Government consumption expenditure (0.5 points) and household consumption (0.2 points).
- Australia’s Terms of Trade (seasonally adjusted) rose by 1.4 per cent in the quarter and 8.9 per cent over the 12 month period.
- Real net national disposable income, which is a broader measure of change in national economic well-being rose by 1.41 per cent for the quarter and 4.4 per cent for the 12 months to the June-quarter 2019, which means that Australians are better off (on average) than they were at that point 12 months ago. This is being driven by the strong terms of trade at present.
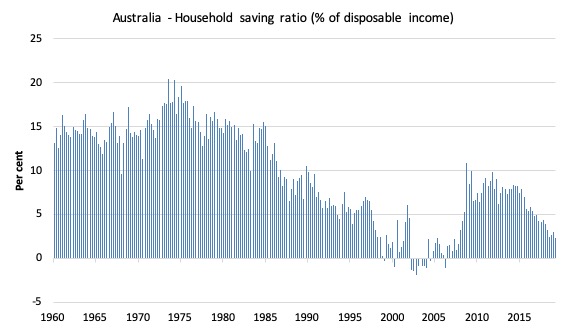
- The Household saving ratio (from disposable income) fell by 0.7 points to 2.3 per cent as household consumption expenditure slowed considerably. The saving ratio is still well below the levels that were observed following the GFC.
Overall growth picture – economy slowing further – recession looms if policy settings do not change
The ABS – Press Release – said that:
The Australian economy grew 0.5 per cent in seasonally adjusted chain volume terms in the June quarter 2019 and 1.4 per cent through the year …
The external sector drove GDP growth this quarter, while growth in the domestic economy remains steady …
Net exports contributed 0.6 percentage points to growth this quarter, reflecting strong exports of mining commodities.
Government spending was the main contributor to growth in domestic final demand, reflecting ongoing delivery of services in disability, health and aged care.
The household sector remained relatively subdued, with a 0.4 per cent growth in household expenditure. While dwelling investment continued to decline, recording a fall of 4.4 per cent during the quarter.
Points to note:
1. Household consumption expenditure growth is moderating but the saving ratio remain low and is falling again.
2. For all those mainstream economists out there who teach your students that government spending does not create jobs, stop doing that.
It has been patently obvious that public works expenditure over the last year or so has been the difference between a positive (albeit tepid) growth rate and recession.
Public consumption growth has increased to 6.2 per cent over the last 12 months.
3. The big public infrastructure projects which are helping at present are obviously finite and are within an environment where the federal government is obsessed with recording a surplus. The public spending is coming from State governments (large transport projects mainly). The growth in public investment was negative in the current quarter.
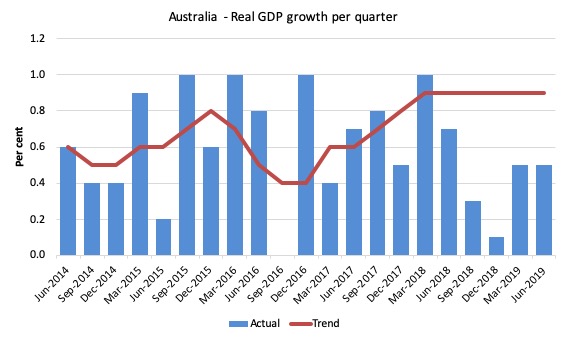
The first graph shows the quarterly growth over the last five years (with the red line being the ABS moving average trend). The trend growth is now flat (and would have been negative except for the spike outlier in the June-quarter 2018).
Analysis of Expenditure Components
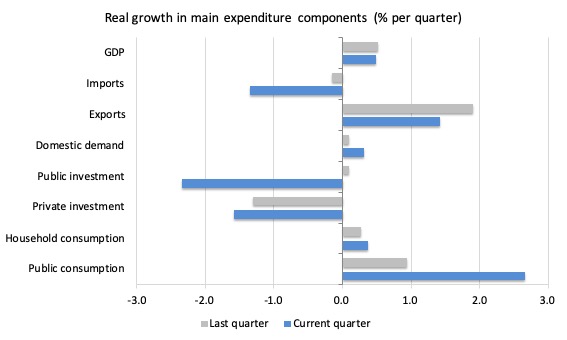
The following graph shows the quarterly percentage growth for the major expenditure components in real terms for the June-quarter 2019 (blue bars) and the March-quarter 2018 (grey bars).
The overall growth performance is being driven by the strength of public consumption and export expenditurs.
Private investment expenditure growth declined by 1.59 per cent for the quarter (second successive negative growth quarter) and 5.2 per cent over the 12 months.
Household consumption expenditure growth improved modestly (0.37 per cent, up from 0.28 per cent) but remains subdued compared to recent years.
The slowing economy is also impacting negatively on import expenditure which contracted by 1.35 per cent second successive negative growth quarter).
The growth in exports continues (1.42 per cent) but is not going to be long-lived. Once the Brazilian situation is sorted out then the favourable terms of trade we have been enjoying will moderate.
Contributions to growth
What components of expenditure added to and subtracted from the 0.5 per cent real GDP growth in the June-quarter 2019?
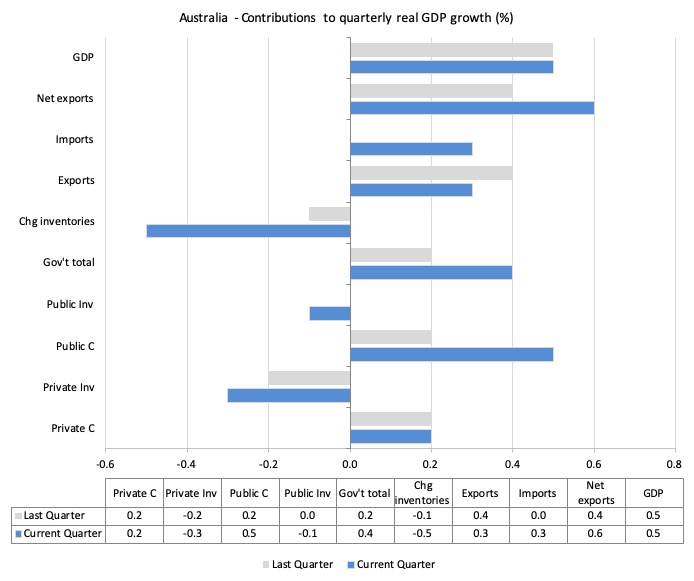
The following bar graph shows the contributions to real GDP growth (in percentage points) for the main expenditure categories. It compares the June-quarter 2019 contributions (blue bars) with the December-quarter 2018 (gray bars).
In order of contribution:
1. Net exports added 0.6 percentage points driven by a rise in exports (and rising terms of trade).
2. Public consumption contributed 0.5 points driven by initiatives in disability, health care and aged care services. Overall, the government sector contributed 0.4 points (given the 0.1 point negative contribution from public capital formation). Without the public contribution, GDP growth would have been zero.
3. Household consumption expenditure contributed 0.2 points to the overall growth result – a relatively weak but stable result.
4. Private investment expenditure undermined growth by 0.3 points (negative 0.2 points last quarter).
Material living standards rise in June-quarter 2019
The ABS tell us that:
A broader measure of change in national economic well-being is Real net national disposable income. This measure adjusts the volume measure of GDP for the Terms of trade effect, Real net incomes from overseas and Consumption of fixed capital.
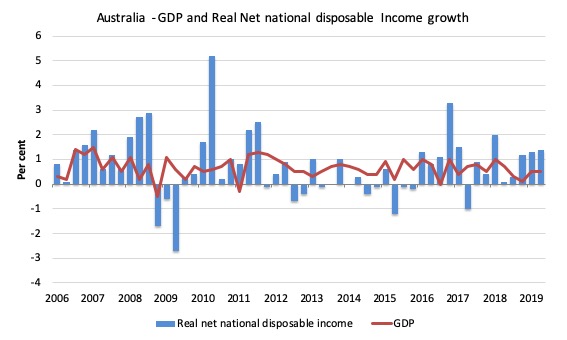
While real GDP growth (that is, total output produced in volume terms) grew by 0.5 per cent in the June-quarter 2019, real net national disposable income growth grew by 1.4 per cent.
Over the 12 months to the June-quarter 2019, Real net national disposable income grew by 4.4 per cent, which means that Australians were better off (on average) in real income terms than they were twelve months prior.
The following graph shows the evolution of the quarterly growth rates for the two series since the December-quarter 2006.
Household saving ratio falls again
The saving ratio fell by 0.7 points to 2.3 per cent which is a cause for concern.
The ratio has been steadily falling since in recent years (with minor blips upwards).
This indicates the struggle that households are now facing as they try to maintain their consumption expenditure in the face of prolonged flatness in wages growth.
Ultimately, the credit-fuelled and draw down on saving cannot be sustained.
The following graph shows the household saving ratio (% of disposable income) from the June-quarter 1960 to the current period.
In the December-quarter 2008, the ratio was 10.9 per cent having risen sharply in the early days of the GFC as households tried to stabilise the record debt situation.
Once the GFC threat was contained by the massive fiscal stimulus, the saving ratio began to fall again, especially as the squeze on wages has intensified.
In the December-quarter 2016, the household saving ratio was 5.5 per cent (still much lower than historical norms).
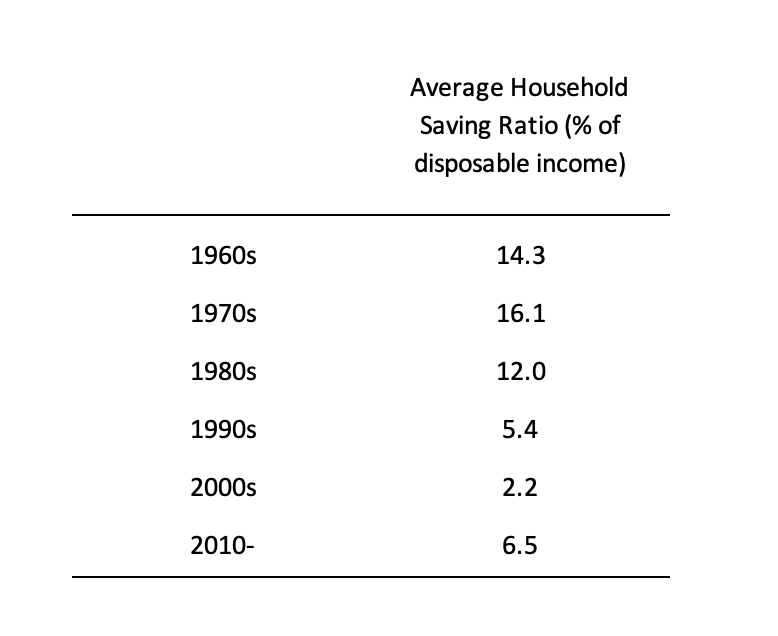
The following table shows the impact of the neoliberal era on household saving. These patterns are replicated around the world and expose our economies to the threat of financial crises much more than in pre-neoliberal decades.
Real GDP growth and hours worked
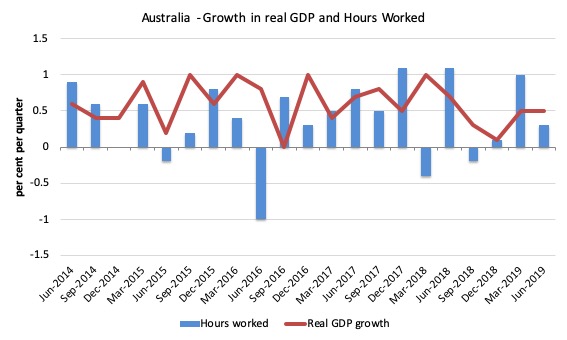
The following graph presents quarterly growth rates in real GDP and hours worked using the National Accounts data for the last five years to the June-quarter 2019.
You can see the dislocation between the two measures over the period to mid-2016 (it actually began in 2011). In other words, GDP was growing while hours worked growth was variable but often zero or negative.
From then until the December-quarter 2018, the two series moved more or less together, despite the blip in the June-quarter 2018.
But the June-quarter data shows that total hours worked lagged behind GDP growth, which means that productivity growth rose somewhat.
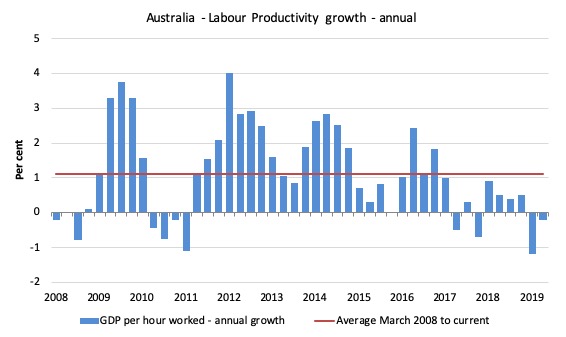
To see the above graph from a different perspective, the next graph shows the annual growth in GDP per hour worked (labour productivity) from the June-quarter 2008 quarter to the June-quarter 2019. The horizontal red line is the average annual growth since June-quarter 2008, which itself is an understated measure of the long-term trend growth of around 1.5 per cent per annum.
The relatively strong growth in labour productivity in 2012 and the mostly above average growth in 2013 and 2014 helps explain why employment growth was lagging given the real GDP growth. Growth in labour productivity means that for each output level less labour is required.
In the June-quarter 2019, annual labour productivity growth fell by 0.2 per cent although the quarterly rate improved a bit.
Conclusion
Remember that the National Accounts data is three months old – a rear-vision view of what has passed and to use it to predict future trends is not straightforward.
Although I do not expect the growth rate to pick up any time soon without a major shift in macroeconomic policy given that the boost from net exports in the current quarter is ephemeral.
Thus, coming up with assessments of where the economy is heading requires analysis of the more recent data – such as labour force surveys and the like.
And we saw yesterday, that retail sales data is showing a very weak product market environment.
But the National Accounts data indicates that the Australian economy continued to perform poorly in the June-quarter, a trend that has now persisted for the last 12 months.
Annual growth is just 1.4 per cent around 1/3 of the historical trend rate.
The weakness is exemplified by slackness in private domestic demand – weakening household consumption growth and negative business investment growth.
Only offsets by strong public consumption is saving private domestic demand from collapse.
Net exports also contributed to growth on the back of the rising terms of trade but as I noted this impact will be ephemeral.
Overall, the Australian growth outlook remains poor.
A major shift in fiscal policy towards expansion is definitely now required.
That is enough for today!
(c) Copyright 2019 William Mitchell. All Rights Reserved.
The labor/labour parties are in a parlous state. This is really bad news. One might expect a Tory /LNP party would like neo-liberal, aka rampant capitalism as a modus operandi, yet it seems the left is doubling down on it. So where to from here is the obvious question.
Did you get a chance, Bill, to set the Qld side of the dispute straight?
“A broader measure of change in national economic well-being is Real net national disposable income.”
“Over the 12 months to the June-quarter 2019, Real net national disposable income grew by 4.4 per cent, which means that Australians were better off (on average) in real income terms than they were twelve months prior.”
I see that you note “on average” – it is blindingly obvious that real incomes and material living standards are definately not rising solidly for the typical household, any more than AWOTE represents a realistic picture of what the typical wage earner actually earns.
If the measure includes profits as well as wages then that might go a long way toward explaining it, given the sharp divergence in wages and profits, with much of the earnings going to a sector that employs only a handful of workers and is mostly foreign-owned.
“