I started my undergraduate studies in economics in the late 1970s after starting out as…
Rising insolvencies – is unemployment a cause?
Today I have been examining bankruptcy data. The popular notion is that bankruptcy rises during a recession. Many are arguing that this recession will drive higher rates than ever because of the extent of household debt. These are all conjectures that form part of the popular folklore but rarely formally investigated. So this blog summarises some introductory work I have been doing to investigate this notion more fully. It will at least settle some issues.
I read an article in the Canberra Times yesterday which said that Tougher times: bankruptcies set to rise. The article said:
Rising unemployment and tighter credit and government spending will cause more bankruptcies in Canberra before conditions improve, business leaders say.
The idea that unemployment drives bankruptcies is popular and one that I often introduce into discussion myself. However, I have never done any formal work on it, in part, because data has always been less than easy to come by.
You can get bankruptcy data from the Insolvency and Trustee Services Australia going back to September 1986, which is useful for time series analysis.
There are various ways that one can become insolvent. Bankruptcy dominate the other forms of insolvency which include Debt agreements and Part X insolvency agreements. Bankruptcy is the least preferred because of the restrictions it imposes on the debtor and also usually involves the creditor recouping less.
Part X of the Bankruptcy Act 1966 allows a debtor who cannot pay to enter what is known as a “personal insolvency agreement (PIA)” whereby the person can come to terms with a creditor without declaring bankruptcy. Typical arrangements involve lump sum settlements, assignments of assets or periodic payments. It is considered preferable by all to solve insolvency via Part X agreements.
Unlike a Part X agreement, a debt agreement is has income and asset limits on who can enter them (for low incomes and low asset holdings). Accordingly, a debtor can make an offer to a creditor which is assessed against a set of criteria (eligibility, etc) and the creditors then vote on the offered agreement. If agreement is reached, then a range of payment methods is allowable. These include periodic payments, lump sum payments, stays of payment and asset liquidation.
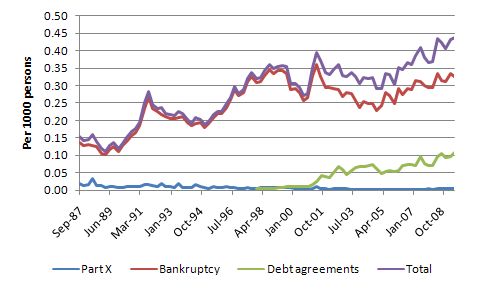
The first graph shows the total insolvencies for Australia broken down into the forms outlined above per 1000 persons. The dominance of bankruptcy is evident as is the rising trend.
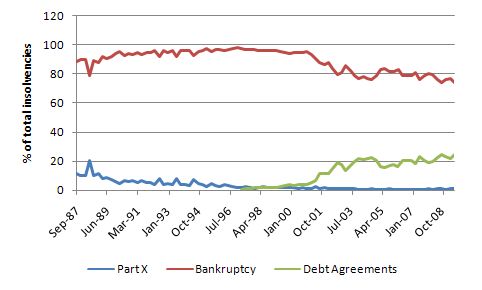
The following graph shows the relative proportions of the different outcomes arising from insolvency. Debt agreements did not exist before 1997 but have quickly replaced Part X agreements as the preferred arrangement. Whereas bankruptcy as the main vehicle for insolvency peaked at 98.4 per cent of total insolvencies in December 1996, by June 2009 it constituted 74.3 per cent, reflecting the growing attractiveness of debt arrangements. In part, this reflects the fact that poorer people are now becoming insolvent at higher rates than in the past which is ominous.
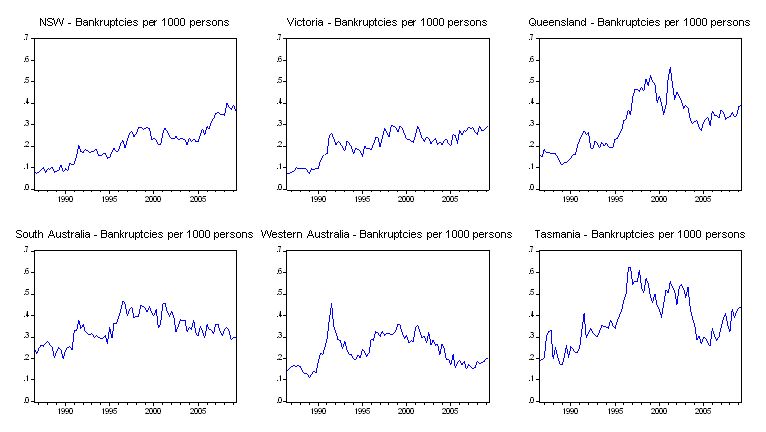
The data is usefully broken down into states. The next graph shows the bankruptcies per 1000 persons for each of the mainland states. The vertical axis is common to give you an idea of relativity. The most populace states have relatively lower bankruptcies. Further, the worse performing labour markets over the period shown have been South Australia and Tasmania yet and they have the highest per capita bankruptcies.
The data also shows that during the 1991 recession, bankruptcies per 1000 persons spiked up sharply reinforcing the unemployment hypothesis.
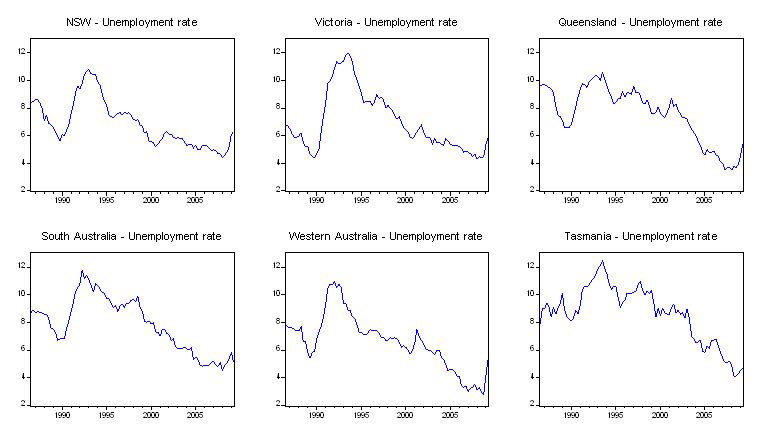
To give you an idea of what the unemployment rate history over the same period has been the following graph plots the unemployment rate (%) for each of the states with a common vertical axis.
So if there is a relationship between unemployment and bankruptcy it is not directly visible from data presented at this level of aggregation.
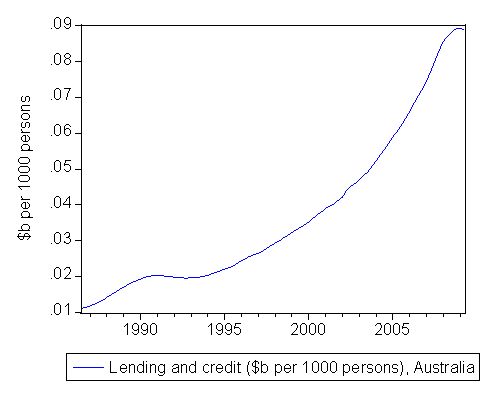
The next graph is total Lending and credit in Australia (in billions of dollars per 1000 persons). Exponential as the national government increased its fiscal drag which ever increasing surpluses, the only way the Australian economy kept growing was via the private (mostly household) debt explosion. A far percentage of the nominal wealth that was accumulated has been obliterated in the current financial wipe out but the nominal debt remains. So it is plausible as the Canberra Time says that tighter credit might be a factor.
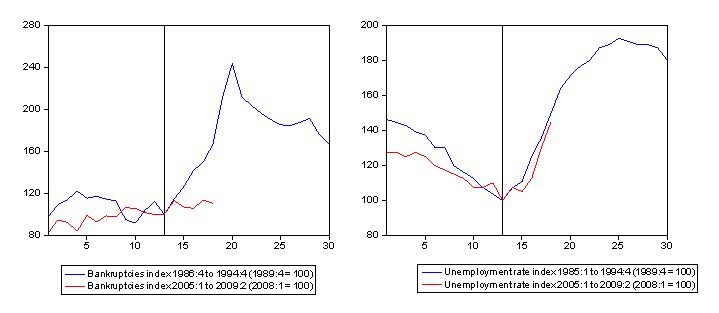
To explore some of these ideas further I first, examined what happened to unemployment and bankruptcies during the 1991 recession and what has been going on during the current recession. I constructed index numbers where the base quarter = 100 at the low-point unemployment rate in each cycle – so November 1989 (therefore fourth quarter) and February 2008 (first quarter) respectively. I took a sample three years before that (12 quarters) and tracked the index in both times series (unemployment and bankruptcies) until quarter 4 1994 (the peak unemployment rate quarter in the 1991 recession) and the June quarter 2009 (the latest data observation in the current downturn).
The following graphs (vertical line is at the base quarter = 100) show the evolution of national bankruptcies in 1991 and 2009 and the corresponding evolution of the national unemployment rate. What you see is the bankruptcies are not growing as fast now as the unemployment rate has risen relative to 1991. There seems to be a difference so far as things started getting bad in the evolution. Whereas, despite the unemployment rate remaining much lower this time around (in level terms) the fact remains that it has accelerated about as quickly as it did in 1991 at a corresponding stage in the cycle. Further, underemployment (not shown) is much higher now so when we put out our latest broad indicators in a day or so I won’t be surprised to see the levels of broad labour underutilisation about the same as they were in 1991 – 18 months into the downturn.
So given the starkly different volume of household debt that is now being borne why aren’t bankruptcies rising as fast now as in 1991 when the level of household debt was lower? One reason is that interest rates are much lower now than they were during the worst stages of the 1991 downturn. In that sense, the monetary policy easing has probably staved off the implicit bankruptcy time bomb although the rising unemployment will more than outweigh that effect if it persists.
To see whether unemployment matters for insolvency (and bankruptcy in particular) I ran a few regressions. For the lay reader, these are statistical models which allow us to get some insight about what is associated with what and allows us to dismiss stupid theories. Although don’t think the opposite. They do not allow us to say categorically that something is “true”. This is a huge debate in my profession and the relevant point is that even if there was something that we could call truth how would we ever know we had found it? In general, regression models are guides to help theory development and to calibrate relations. They provide some empirical reinforcement to our conjectures but only tentatively.
Having said that I ran a series of regressions for state bankruptcy rates per 1000 persons and examined whether the level of unemployment and the rate of change of unemployment helped explain the movement in the bankruptcies over time. I also examined whether credit growth mattered and included some special variables to control for trends and other factors (inertia etc).
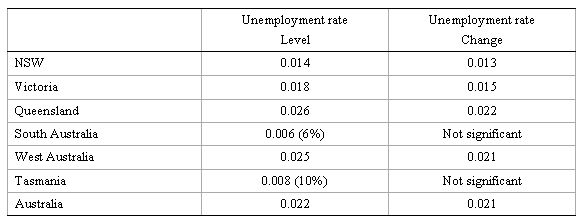
The following table shows the results in summary form. The numbers are estimated coefficients – that is, the estimated magnitude of the explanatory variable (either level of unemployment rate or the change in the unemployment rate) on bankruptcies per 1000 persons. Are these numbers reliable?
We talk about a variable being statistically significant if its standard error is at least twice as small as the estimated effect (the coefficient). We take that as a sign that the impact of the particular explanatory variable is not zero but probably close to what the regression number produces (subject to a battery of so-called diagnostic tests being satisfied).
The results are tentative at this stage and I have only summarised them. Basically 7 or 10 per cent in brackets means the estimated impact is significant at that level – which should be compared to the benchmark of 5 per cent or better (meaning you are certain that only 5 times out of 100 the estimated impact will be different to that shown). The numbers are the estimated impacts – so the sign tells you the direction of impact and the size the magnitude.
The signs are all as predicted. Higher unemployment drives up bankruptcies per 1000 persons in all states and for the nation as a whole. In terms of the change in unemployment – that is, how fast it rises or falls – the more rapid the rise in unemployment the larger the rise in bankruptcies (other things equal) except in South Australia and Tasmania where the effect is not statistically significant.
None of the credit growth effects I tried had any discernible impact.
The models are tentative at present. But they do provide some basic support for the popular belief that bankruptcies are one of the by-products of recession.
Do these results have any policy relevance? Definitely, if not I wouldn’t bother to do this sort of analysis.
My reading of the data and the modelling today is that the RBA would be mad putting interest rates up before unemployment is firmly in retreat and full-time employment is growing strongly. You will recall that the central bank is threatening to put rates up sooner rather than later to control inflation. It is almost being expressed in terms of:
Even if unemployment rates are still rising we are tough enough to defy logic and put rates up.
It will be total lunacy if they do hike rates while unemployment is still rising. Even once it stops rising, growth has to be sufficient to soak up the pools of underutilised workers that will be left as a result of this slowdown. Remember we grew for nigh on 16 years after the 1991 recession and still was left with 8.5 to 9 per cent underutilised labour at the top of the so-called boom.
My conjecture which will form the basis of more work is that the materially lower interest rate environment is keeping bankruptcies lower than they would otherwise be.
Perhaps it’s a catch 22 situation. I read that housing prices have begun booming again and low interest rates must be a part of the reason. Although more than a third of current buyers were investors who intend to put mortgage and interest rate costs onto someone else, it seems Australians have not learned the harsh lessons being learned overseas and can’t wait to get back to leveraging themselves to the eyeballs.
No matter how many times your parents told you not to touch the hot stove, it was only when you did stick your hand on it and get burned did you finally appreciate what “be carefull, it’s hot!” really meant.