I started my undergraduate studies in economics in the late 1970s after starting out as…
Dumbed down economy doesn’t lose as many jobs
There have been several related reports and articles in the last few days about adjustments that are going on as the economy goes into recession. New data is also available to shed light on movements in wage costs and labour productivity which can help us better understand what is going on at present and provide comparisons with the now perennial question – is this recession different to that experienced in 1991. Today I decided to write about these matters as an on-going investigation into what is happening out there in the labour market. This is sort of my other main interest in economics alongside the development and explication of modern monetary theory. Today we find that the neo-liberal dumbing down of our labour market may have saved a few jobs – but at what cost!
In two articles today – one from Bloomberg – U.S. Economy: Worker Productivity Surges and Labor Costs Drop and another from The Australian – Cost-cutting productivity gains in the US can’t last – we learn that the US economy is undergoing a productivity surge.
The original report and data comes from the US Bureau of Labor Statistics (the best stats agency in the world!):
The seasonally adjusted annual rates of productivity change in the second quarter were:
6.3 percent in the business sector and
6.4 percent in the nonfarm business sectorProductivity gains in both sectors were the largest since the third quarter of 2003, and were due to hours worked declining faster than output.
The major reason for the productivity increase was that employers were laying off so many workers to cut costs and have increased intensity of work. Since the US recession (officially) began in December 2007, the US economy has shed 6.7 million jobs. By extracting more per hour from the remaining employees firms have been able to maintain higher than otherwise profits in the face of huge losses of sales revenue. Many US companies are recording better than expected profits in this way – at the expense of the workers, of-course.
It also means that there is no upward pressure on inflation which means that interest rates will remain low.
However, as The Australian article points out, this sort of productivity gain is illusory because it cannot provide enduring benefits to the economy. You can only work a diminished workforce harder for so long. Sustainable productivity growth can really only come from new investment and restructuring of work. Capital deepening (as it is called) is absent at present.
So the BLS data raises issues about what is happening in Australia at present where we have not seen the vicious job cuts but have witnessed a significant cut in working hours. I will come back to that in a moment.
Relatedly, the AiG group released a survey report yesterday – Looking Towards the Upturn which attracted press attention this morning. The Sydney Morning Herald covered the report today in – Half of business have cut staff hours to avoid losses – and says, that of the 500 companies surveyed (covering 228,000 workers):
Companies have reduced hours (50 per cent), frozen salaries (41 per cent), introduced job sharing (14 per cent) and cut salaries (14 per cent) to avoid job losses …
Staff layoffs (23 per cent) and reducing staff travel expenses (23 per cent) ranked behind reducing operational costs (58 per cent) as priorities.
I did an interview yesterday with the journalist and she reported in the article that:
Bill Mitchell, professor of economics and director of the centre for full employment and equity at the University of Newcastle, said companies had also adjusted working hours as a first response in the 1991 recession, but then followed this by cutting jobs.
”Really, what firms are doing is cutting wages as the first adjustment. The second adjustment is that they are expecting employment to fall.”
Professor Mitchell said significant job losses in the manufacturing sector reflected that ”government stimulus was mostly in consumer pockets”.
”It has propped up retail sales and hospitality. It is quite clear manufacturing hasn’t benefited.”
In fact, what I said was that the AiG survey was predicting that employment would fall in the second half of 2009 after hours adjustment had been exhausted. I also said that the wage cuts arose from the rising underemployment rather than cutting rates of pay (although a bit of that seems to be going on at present too). Whether employment does fall in the second half of 2009 depends on what the government does by way of continued stimulus.
I told an ABC Radio program this morning that I did expect full-time employment to continue to fall though for some months yet.
Whatever, this is all consistent with the analysis in my blog the other day – Tale of two recessions and more.
So today to continue one of my research themes on recession adjustment, I have been have been investigating the movement in productivity and wages in Australia to see what is happening with unit costs and whether our productivity trends match those reported by the BLS for the US economy.
First, the ABS released its latest Labour Price Index data (for June) today, which showed that nominal wages have increased overall in the economy by 3.9 per cent in the last year (3.6 per cent in the private sector and 4.5 per cent in the public sector). Given that inflation was running at 1.5 per cent over the same period today’s data signals a modest real wage increase in the last year. So examining movements in wage costs is part of the adjustment story.
Second, the data released last week by the ABS on Hours Worked allows us to compute accurate (enough) labour productivity series (in hours and persons) which takes me back to the reports on what is going on in the US at present with respect to productivity growth spurts.
Wage movements
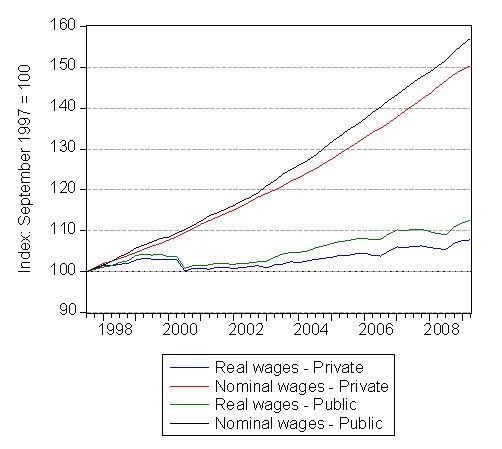
The following graph shows real and nominal hourly wage movements since September quarter 1997 (Index = 100) for the private and the public sectors. While nominal wages have grown significantly over the period (given inflation), real wage movements have been extremely modest. For the private sector (blue line) they have grown 7.8 per cent in 12 years whereas for the public sector they have grown by 12.6 per cent over the same period. This is an unprecedented level of real wage restraint in the economy.
Since the downturn started (February 2008), real wages in the private sector have grown by 1.8 per cent and in the public sector they have grown by 2.7 per cent.
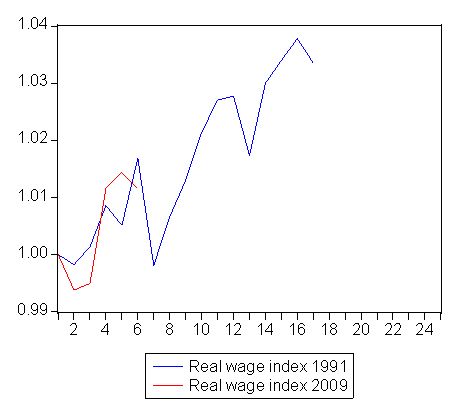
To compare the current period with the 1991 recession we need to use a different data set for wages given that the Labour Price Index starts in September 1997. So the following graph is based on Average Weekly Earnings and the real wage indexes are indexed to 100 at the quarter where the low-point unemployment rate occurred (November 1989 and February 2008). The horizontal axis then shows the quarters since that base quarter as the recession unfolded. The point is clear that real wages growth now is very similar to that experienced during the 1991 recession. Nothing of note different.
Labour productivity movements
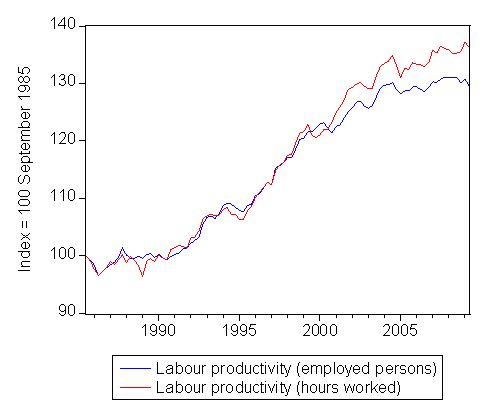
Now what is happening to labour productivity? You can measure labour productivity in terms of output per hour worked or output per person employed. Clearly, when hours worked are falling faster than person employed, which is the state at present, then the two measures will be different. Productivity measured in hours will be higher than productivity measured in persons when firms are adjusting their hours down but trying to retain persons employed.
The next graph shows the movement of these series indexed at September 1985 = 100. Labour productivity (hours worked) – real GDP per hour worked (red line) moved in line with productivity per person employed (blue line) up until early 2000s and then the latter has been very flat since then as hourly productivity has risen above it.
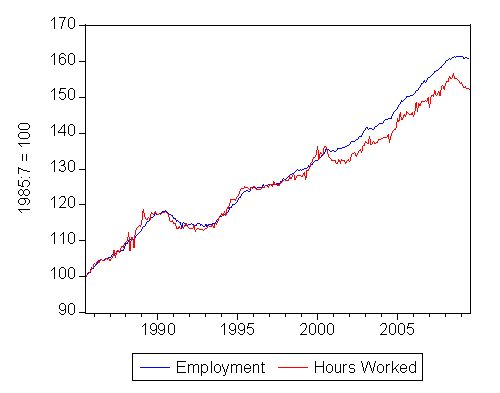
This should be understood in terms of the following graph which I presented in the blog – The labour market barely hanging on – which shows the complete hours worked series and total employment in persons both indexed to 100 at July 1985. The growth in the two series is almost coincident until around September 2000 after which the economy increasingly produces jobs but with deficient hours of work. This tells us that the growth boom that was lauded by the previous government created growth in employment but the people who were gaining the jobs were having to scramble for a declining overall volume of hours of work on offer. In other words, the economy didn’t provide enough hours of work. This is clear from the fact that the part-time workers are increasingly signalling to the ABS that they want to work longer hours but cannot find them.
So it is little surprise that as GDP grows, labour productivity is rising faster in hours worked than persons employed.
Since February 2008 total employment has grown by 0.6 per cent (all part-time) while total working hours has declined by 1.6 per cent. Since January 2009, total employment has declined by 0.1 per cent while total working hours has declined by 1.3 per cent. So at present the labour market is adjusting mostly in hours worked.
Over the same time, labour productivity in hours worked has risen around 0.37 per cent (hardly at all) while labour productivity in persons employed has falled by 1.14 per cent. So nothing remotely like the US scenario, even though our GDP growth has not fallen nearly as much as the US output growth over the course of their recession.
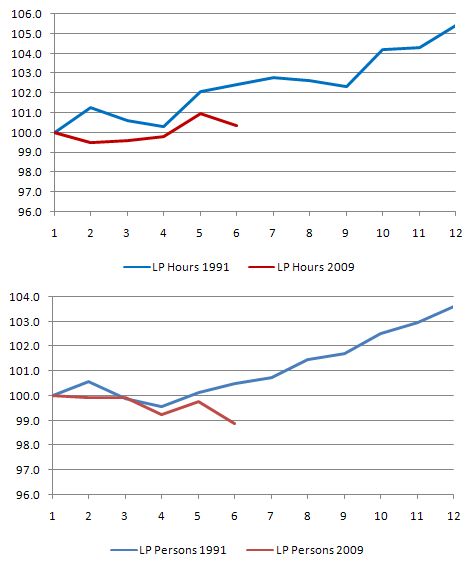
The following graph compares the two recessions in terms of hours and persons employed measures of labour productivity indexed to 100 at the low-point unemployment rate (November 1989 and February 2008). The horizontal axis shows the quarters after that point as the recession unfolded.
It is clear that hours measures will always be above the persons employed if underemployment is rising. But the other clear point is that our productivity performance now is significantly lower than what is was in 1991.
Comparing the current downturn to 1991, we learn that at the corresponding quarter in the 1991 recession, labour productivity in persons employed had risen marginally by 0.50 per cent (from November 1989 to May 1992) while labour productivity in hours worked grew by 2.42 per cent over the same period. So again, this recession is different in that the efficiency of the workforce is now much lower.
Which brings me to the point: what would be the employment loss now if we had the same productivity growth as the economy? Or in other words, how has lower productivity growth preserved jobs in the current downturn?
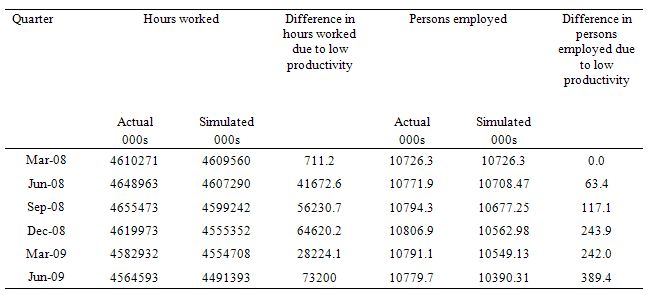
The following table gives you the answer. I assumed that productivity growth in hours and persons employed was the same as the first 6 quarters following quarter 4 1989. I then computed what employment and hours worked would be if GDP growth was the same as it has been since February 2009 (assuming that June quarter GDP growth will be down by 0.5 per cent) and if productivity growth followed the 1991 pattern.
You can see because we have lower productivity now how this has preserved jobs. By now we would have 389.4 thousand less people in work and 73,200 thousand less hours worked per month.
The problem is that by biasing employment growth towards low-pay, low productivity sectors which has been the hallmark of the last several years (since hours worked started to deviate from persons employed) you preserve those jobs better in a downturn but the potential for maintenance of job security, skill development and high productivity growth is undermined. It is a stupid strategy to set up incentives for firms to avoid capital deepening (via investment) and instead employ people in part-time (casualised) capacities in underemployed states.
While this is arguably better than being unemployed it is a pitiful alternative to a robust economy underpinned by private saving and public deficits which is producing high pay, high productivity jobs that are secure and provide the working hours that are desired by the available labour supply.
So at present our dumbing down is preserving jobs but at what expense to the long-run future of the workers and their families!
Wage and Productivity movements
One of the so-called stylised facts of economic life is that the wage share was relatively constant – for the entire full employment period post World War II. Constancy of wage share meant that real wages had to grow in proportion with labour productivity meaning that workers continually improved their real standards of living in line with their contribution to national productivity growth.
As neo-liberal policies became dominant this relationship was deliberately disrupted. You might like to read an earlier blog – The origins of the economic crisis where I analyse this in more detail. For the purposes of today’s discussion, the following graph is reproduced from that blog.
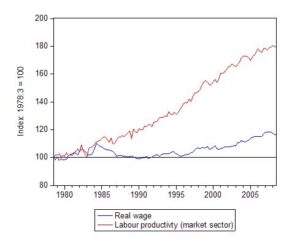
In the following graph shows real wage and productivity movements indexed to 100 at 1982. You can see that real wages (using real average weekly earnings) have failed to track GDP per hour worked (in the market sector). The Hawke wages accord era cut real wages as a deliberate strategy based on the argument of the time that if the Labor Government redistributed national income back to profits then the private sector would increase investment and reduce the high unemployment following the 1982 recession. The strategy failed but did undermine the shop floor bargaining skills of the shop stewards in the union movement because it centralised wage negotiations.
Under the conservative Howard Government years (post 1996 to 2007), some modest growth in real wages occurred overall but nothing like that which would have justified by the growth in labour productivity. In March 1996, the real wage index was 101.5 while the labour productivity index was 139.0 (Index = 100 at Sept-1978). By September 2008, the real wage index had climbed to 116.7 (that is, around 15 per cent growth in just over 12 years) but the labour productivity index was 179.1.
What happened to the gap between labour productivity and real wages? The gap represents profits and shows that during the neo-liberal years there was a dramatic redistribution of national income towards capital. The Federal government (aided and abetted by the state governments) helped this process in a number of ways: privatisation; outsourcing; pernicious welfare-to-work and industrial relations legislation; the National Competition Policy to name just a few of the ways.
You can also appreciate that this gap presented the capitalists with a major problem. How can we sell everything that is being made when the real command over goods and services of the workers is not keeping pace? This was a particular problem as the national government was further squeezing purchasing power by running ever increasing budget surpluses.
Answer: wheel in the financial engineers and push as much debt on households as you can get away with fair means or foul!
Result: pre-conditions for the current crisis created.
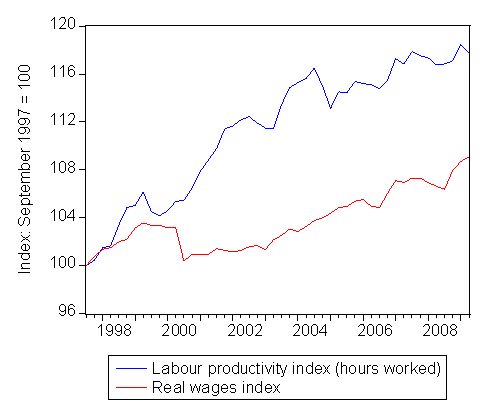
What has been happening in recent years? The Labour Price Index data only goes back to September 1997 so we can only focus on movements since then. The following graph gives you the sorry story. Real wages growth has trailed well behind labour productivity growth (in hours worked) meaning that on an hourly basis workers are increasingly surrendering more real output to profits than they were in the past. This accelerated under the labour market deregulation.
My judgement is that a sustainable growth path will require, in part, a major redistribution of national income back to wages which would mean that real wages growth will have to track labour productivity growth. Private spending cannot rely on the household sector becoming increasingly indebted to provide consumption growth in the face of increasing income going to profits. It is also not possible to grow indefinitely with private investment continually replacing consumption.
Conclusion
So the situation is that we lose less jobs and working hours because we let the neo-liberals dumb the economy down with increasing underemployment and dramatically suppressed real wages growth.
But as a strategy for the future generations this is one of the real ways in which we are leaving a burden for them to carry. Forget all the public debt hoopla – future burdens are carried when we de-skill, increasingly casualise and underpay our workforce. We stifle skill development and reduce the capacity of the economy to produce high productivity growth rates which ultimately underpin high real wages and better (material) standards of living.
Postscript
People keep sending me E-mails asking me what my view on the carbon trading debate is. I also get asked this a lot during radio interviews. So far – I have not said much. Suffice to say, for now, I hate market-based systems in this regard – they are a deeply flawed method of dealing with something that can die!
At some unknown point there is no trade-off on a production frontier between Goods and the Natural World. Non lexicographic trade-offs are an essential part of efficiently allocating competing resources via the price system. If there are no reliable trade-offs you cannot use this sort of mechanism sensibly. So the mythical textbook market ideal is without application in this context (and every real-world context, by the way).
Further, all the pure thoughts and ambition in the world aside, the reality is that the price system actually introduced by the politicians will not resemble anything remotely like that found in neo-classical text books which, after all, is the authority for these stupid schemes. There is no way the politicians will not succumb to relentless lobbying by capital (and labour) and produce some ridiculous system and then pretend it is the mythical price system ideal. I recommend all readers to become acquainted with the Theory of Second Best in this context.
Which all adds up to mean that we have to find another way to save the world and avoid these neo-liberal scams. More on that topic another day.
Bill,
Henry Ford said if you don’t pay your workers enough to buy what you are making, there is no sense in making it. Do you see any path back to equitable distribution of productivity gains? There are very little tax cuts (here in the US) for the middle class and with the current income distribution govt deficit spending will just flow to the top. Will the upcoming depletion of the (fictional) Social Security trust fund restore aggregate demand?
BTW, if you want to improve productivity for future generations in Australia, take a lesson from America – spell it labor instead of labour 🙂
Shouldn’t your last graph compare hourly earnings with hourly productivity, not weekly earnings? (I doubt it will change your results too much but it would be more consistent.)
Dear Bill,
As a non-economist (some say I should be happy about this fact) I do not understand parts of your Postscript.
1. What is a “non lexiographic trade-off”? Or should it be “lexicographic”? Either way I do not understand what’s going on. If its the latter then maybe it has something to do with preferences?
2. And “and every context by the way”?
3. Couldn’t a carbon tax do better, perhaps? Such as providing more certainty for all involved (Sweden has one since 1990) and also requiring no monitoring burocracy (avoiding lawyers too). And couldn’t the existing tax system encourage the renewable energy industry through tax breaks and discourage the polluters by way of tax penalties?
Cheers
Graham
Dear Rowan
Thanks for your comment. But the graph does compare hourly productivity with the real labour price index which is an hourly wage measure – you can find information at ABS Site.
Perhaps it was my use of average weekly earnings earlier (to get a longer time series) that led you to conclude I was using weekly earnings throughout. Most of the wages analysis in the blog bar one small section is based on the hourly labour price index measure.
best wishes
bill
Dear MarkG
I actually don’t see a path back – easily – to more equitable national income distribution. All the evidence at present is that the fiscal packages are benefitting the rich more than the middle class and the poor – well they are bearing the brunt of the unemployment. I am massing evidence at present to write something about these distributional impacts. But so far it is pointing to a bonanza for the rich and a disaster for the poor with the middle heading south to join the poor.
I doubt that the depletion of your (fictional) social security trust fund will restore aggregate demand sufficiently to restore full employment and cut the poor into the distribution cake. To provide some equity, the US government has to have a further fiscal package of sizable proportions aimed squarely at job creation – hence I advocate a Job Guarantee – paid at the minimum wage with social wage benefits (medical insurance, public school improvements, etc) added. And in the case of the US, I would also seriously increase the minimum wage.
Prospects of any of that happening? fairly low. Goldman and ML have captured significant portions of the rents arising from the stimulus in one way or another and the US government still believes an export led growth strategy is something to pursue.
best wishes
bill
Dear Graham
1. It is lexico … typo … sorry (fixed now). In neo-classical demand theory all preferences have to be non-lexicographic, which means that agents will be prepared to trade-off one good for another at some relative price set. When preferences are lexicographic it means that I might have an infinite preference for good A over good B and will never demand B no matter what happens to the relative price between A and B. In the context I was using it – there are some things that might be considered “matters of principle” where a person “cannot be bought”. In these instances, orthodox demand theory (leading to general equilibrium and optimal resource allocation) fails. If I can never be “bought” then I will never relent on a matter of principle and never demand that “good”.
2. The text book neoclassical perfect market model which is used to justify deregulation etc – as if moving towards it is better – relies on so many assumptions that can never be realised that it is a useless construct to describing real world issues and helping to inform real world policy.
3. Carbon taxes – another blog some day.
best wishes
bill