I have limited time today to write a blog post and last night I was…
Inflation abating in the Eurozone signals failure of ECB ideology
The latest inflation data from the Eurozone tells us once again how wrong mainstream monetary theory is. Eurostat released its latest estimates (June 30, 2017) – Euro area annual inflation down to 1.3% – which has according to the press confounded the ECB, who has been trying to push the inflation rate up to around 2 per cent (a soft target). Like many economic things that confound the pundits, if you are familiar with Modern Monetary Theory (MMT) you won’t be surprised at all. All the baying at the moon that the ECB has been doing (courtesy of mainstream monetary textbook) won’t shift the inflation rate. Expanding bank reserves won’t shift the inflation rate. The real cause of the declining inflation rate is a lack of spending relative to productive capacity. And it is clear that the ECB has limited capacity to influence that gap. That is a matter for fiscal policy, which remains in austerity mode in the Eurozone as the leaders continue to talk about nothing.
The Eurostat facts:
1. “Euro area annual inflation is expected to be 1.3% in June 2017, down from 1.4% in May 2017”.
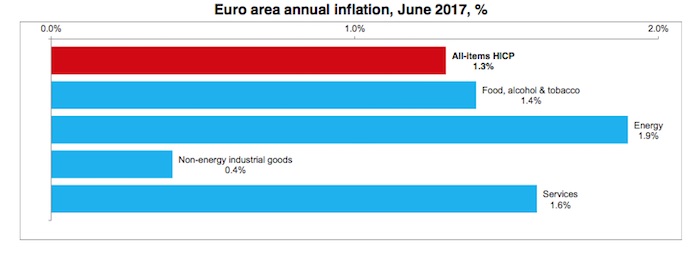
2. “Looking at the main components of euro area inflation, energy is expected to have the highest annual rate in June (1.9%, compared with 4.5% in May), followed by services (1.6%, compared with 1.3% in May), food, alcohol & tobacco (1.4%, compared with 1.5% in May) and non-energy industrial goods (0.4%, compared with 0.3% in May).”
Eurostat provided the following graph that really says it all.
In terms of the basket-weighting of the inflation index, Energy is 95.3/1000 so movements in its prices are very influential in determining the headline Harmonised Index of Consumer Prices (HICP).
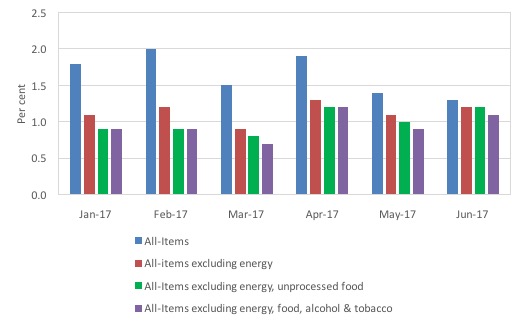
If we exclude Energy price movements the annual inflation rate to February 2017 drops to 1.2 per cent, up from 1.1 per cent.
If we further exclude unprocessed food, the Euro area inflation rate drops to 1.2 per cent in the 12 months to June 2017.
The following graph shows the movements in the All-Items HICP (annual rate of change), and the same series excluding energy (red), and then excluding both energy and unprocessed food (green), and then excluding energy, food and alcohol and tobacco.
Inflation has been falling again this year as energy prices have normalised.
The Wall Street Journal article (June 30, 2017) – Eurozone Inflation Falls Again in Setback for ECB – claims the result indicates that the ECB stimulus programs are failing.
The relevant question would have been ‘what stimulus programs’?
The WSJ write that:
… the annual rate of inflation is further away from the ECB’s target of just below 2%, a goal it has spent years trying to reach using a variety of stimulus measures. The ECB’s economists don’t expect inflation to meet the target at any point through 2019.
Yawn. Wake me up when there is something significant to read!
Apparently, we are told that “Falling unemployment should help raise wages and in turn, inflation”.
Yet the latest Eurostat data released yesterday (July 3, 2017) – Euro area unemployment at 9.3% – shows that:
The euro area (EA19) seasonally-adjusted unemployment rate was 9.3% in May 2017, stable compared to April 2017.
Falling is not a word I would use to describe the grindingly slow retreat from record levels of unemployment in the Eurozone.
Capacity utilisation in the Euro Area
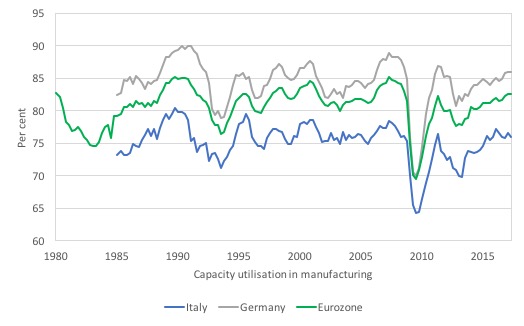
The following graph shows rates of Capacity utilisation in manufacturing for Germany (grey), Italy (blue) and the Eurozone as a whole (green) from the March-quarter 1980 to the June-quarter 2017. The data for Germany and Italy starts at the March-quarter 1985.
The data is available from Business Tendency Surveys and accessible from the Fred2 databases.
While utilisation rates have increased since the bad days of the GFC, they remain generally well down on pre-GFC levels. In Italy’s case, they are falling again.
Coupled that with the fact that even though unemployment has fallen slightly across the Eurozone, the broader indicators of labour market slack – underemployment and those stuck in temporary contracts who desire full time work – are still at elevated levels.
Credit developments in the Euro Area
Another way of examining the underlying developments is to examine credit developments in the Euro area.
For those who are unfamiliar with the range of so-called ‘unconventional’ monetary policy developments in the Euro area over the last several years might read this blog – The ECB could stand on its head and not have much impact – where I document the various policies and ECB statements about them.
I have also considered these policy changes in these blogs (among others):
1. Inflation rises in Euro Area – but don’t claim it is the ECB’s doing
2. Further evidence that ECB monetary gymnastics have not stimulated lending.
3. The ECB could stand on its head and not have much impact.
4. ECB’s expanded asset purchase programme – more smoke and mirrors.
5. The folly of negative interest rates on bank reserves.
6. Building bank reserves will not expand credit.
7. Building bank reserves is not inflationary.
I updated my monetary dataset from the ECB yesterday to update my knowledge of credit developments in the Euro area.
Mario Draghi and his officials have claimed in the past that the QE and related policy initiatives would drive down bank lending rates (see See) which would would have a substantial impact on “confidence, credit and the economy”.
And, eventually, drive the inflation rate up.
When I first tested that claim (December 2015), the date did not support the ECB line.
Now some 18 months later, we can further assess the impact.
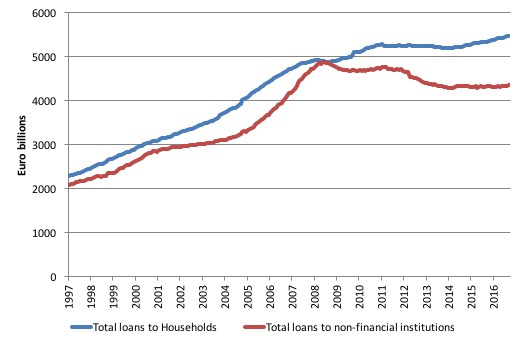
The first graph shows the total loans to households and non-financial institutions (that is, businesses that produce goods and services rather than shuffle money) in the Euro area from September 1998 to May 2017 (this is the entire sample provided by the ECB Statistics Warehouse.
The data is not “adjusted for sales and securitisation”, which the ECB define as “Adjustment for the derecognition of loans on the MFI balance sheet on account of their sale or securitisation.” In other words, the risk is sold off to some other speculator or another. They only started making that adjustment in January 2009.
The data shows the boom then the crash. While the household credit aggregate is now higher than before the crash and is steadily rising, business borrowing remains well down and despite the ECB manoeuvres appears to be going nowhere upwards.
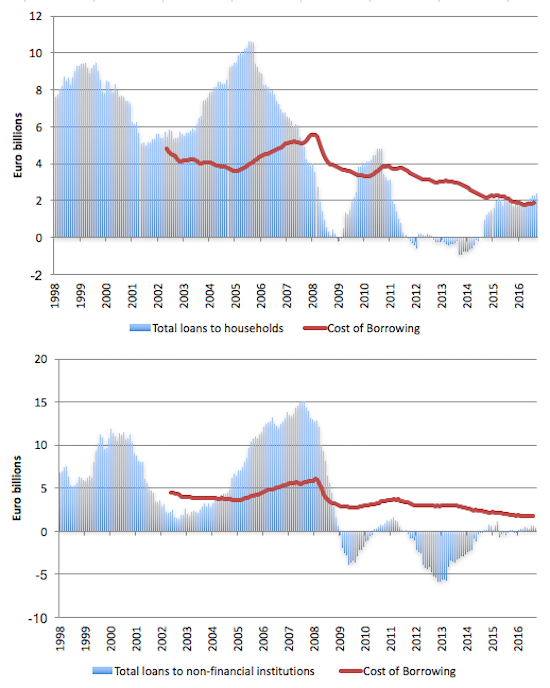
The next graph shows the annual percentage change in borrowing by households (upper panel) and non-financial institutions (lower panel) from September 1998 to May 2017. The red lines are the respective cost of borrowing for each sector (which is only available from January 2003).
There you see the credit binge in both sectors prior to the crisis and the subsequent collapse.
It is clear that the Cost of Borrowing has been steadily declining as interest rates fall and banks repress margins given the lack of borrowers.
But, household credit growth is steady (just rising a little) and business credit growth is virtually non-existent.
It is clear that the malaise in Europe has not yet lifted.
Firms are reluctant to invest (and hence borrow) because of slow sales, while households have also been subdued in their borrowing given the elevated and persistent levels of mass unemployment and broader forms of underutilisation, the hangover of the credit binge (that is too much debt already), and the general policy uncertainty where Brussels appears not to have a clue as to which way to turn.
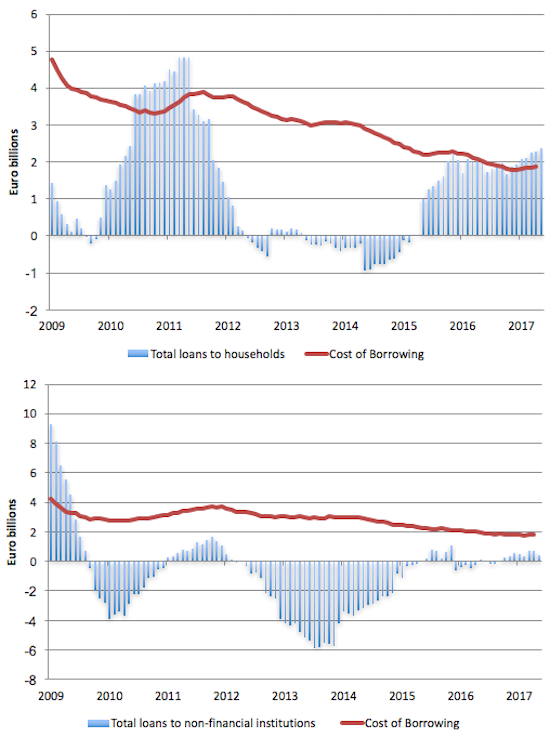
The final graph zooms in on the annual change in borrowing and the cost of borrowing for households (upper panel) and non-financial institutions (lower panel) from January 2009 to May 2017. It gives you a better idea of what is happening now, while the previous graph gave a good historical view of the credit binge and its aftermath once GFC hit.
In the last few months, loans to households grown slowly after increasing more quickly in late 2015. This is even though the cost of borrowing continues to be low.
In the case of non-financial institutions, while the contraction in borrowing was abating, the most recent results suggest that any hope for recovery does not appear to be forthcoming, despite very favourable cost of borrowing conditions and a manic central bank intent on capturing headlines with their acronym soup of non-conventional monetary policy manipulation.
In fact, business borrowing is contracting!
Conclusion
Given the scale of the monetary policy interventions over the last four years one would have expected a much stronger growth in loans, particularly for non-financial institutions if the logic of the central bank and mainstream monetary theory was sound.
The central bank can clearly use its currency-issuing capacity to prevent a massive financial meltdown. It can clearly stop governments in the Eurozone from going bankrupt as it did between 2010 and 2012 with the Securities Markets Program.
But what monetary policy in any of its forms cannot do is reverse a major recession where mass unemployment and income losses create deep pessimism among households and firms, which translates into a reluctance to borrow and a reluctance to spend.
This is especially the case where the relevant fiscal authority (a questionable term in the case of the Eurozone) is intent on maintaining a straitjacket of austerity, which chokes off any green shoots in economic activity.
The big motor is fiscal policy and because of the flawed design in the Eurozone it is dysfunctional in the extreme. Central bank policy shifts can do little to counter the damage that fiscal austerity is doing in Europe.
That is enough for today!
(c) Copyright 2017 William Mitchell. All Rights Reserved.
If the Euro area unemployment rate comes down to 9%, maybe the ECB will declare victory and state that their NAIRU has been achieved. Then they could raise interest rates to try to stave off the no doubt looming inflation that no one else can see. This has been an epic failure for so long it would be funny except it is not at all.
And now Macron is going for austerity assault on the French economy, as he describes it; facing up to reality of the lax French spendthrift. Labour “reforms” and budget-cuts, Macron will no longer swim in The Nile.
https://t.co/rnkcBzHMpw
And the master seems to want Jens Weidmann as next ECB boss.
https://twitter.com/adam_tooze/status/881882732082601984
“Alarming news for Europe: momentum may be building in Germany to replace Draghi with Weidmann. Would be disaster!”
It’s a crazy world, now Tesla is the highest valued car maker, at present making about 100k cars a year but probably ramping up some 100k with the cheap Model 3. But still GM, VW and Toyota makes roundabout 10 million cars each per year.
Money is obviously in the wrong hands in this ZIRP QE economics world we live in.
Jerry, The Australian government declares victory with unemployment at close to 5.5% and underutilisation rates at 14.5%, and a whole generation being locked away from affordable housing.
I’m 30, tertiary educated, (graduated in 2012) and have never had stable secure full time permanent work. The employment market has not improved in those five years.
The VET industry (the industry I’m in) has been deregulated to allow for profit private colleges, undermining employees wages. The desire for profits has colleges operating with scant resources and minimising staff. The course I teach has no structure!
The regulator doesn’t look at course content taught but administrative procedures and process for student monitoring. The majority of colleges audited are found to be noncompliant, even when the regulator isn’t focused on quality of course material.
Many colleges have been found to be rorting the system signing up people without knowledge for certificates and diplomas that cost tens of thousands of dollars.
This is hailed as a success. The system started in 2012 by a perceived ‘leftist’ government who had an interest in public education. The Prime minister became chair of Global Partnership for Education after losing the Prime Ministership. The program was stated as a failure but expanded by the incoming government. A senate enquiry in 2015, found rorting, and a regulator not fit for purpose.
Even after that disaster no major party has a policy of ending the scheme. The Australian government hasn’t only abandoned full employment, it has abandoned a commitment to quality public education.
Xenji, isn’t it so ridiculous that governments so often cut the real investments for the future that they actually can make, such as quality education, on the mistaken idea that by “saving money” now, the future generations will be better off because they will have more money then? That argument is so wrong it is difficult to respond to. Professor Mitchell has written about this many times and I think it is the false analogy between the currency issuing government (who doesn’t ‘need’ the money they issue) and the household that always does. Maybe you can convince the people you work with to read a little about MMT.
Jerry, My colleagues realise the college we work for is a sham. I’m quote vocal in how ridiculous I think the system is and colleagues tend to agree. Many of them feel powerless to do anything. We are only five staff for a college with well over 100 students enrolled.
Amongst my own age group, there is growing consensus that we are getting a raw deal. A lack of jobs, high rents, unaffordable housing. The great news is UBI is being seen as inferior to a Job Guarantee. At least amongst my peers. They just don’t see a government ever implementing such a policy.
Once you change that, you’re onto actual real progressive change. It means democratising the political parties, allowing membership to vote on policies and leader. It’s a long road put I’m optimistic that in my lifetime I’ll see it.
After reading this post it is obvious that this song should be our anthem: https://youtu.be/6iuvJozev6I