Today (June 3, 2026), the Australian Bureau of Statistics (ABS) released the latest - Australian…
Australia national accounts – return to unstable growth
Today, the Australian Bureau of Statistics released the – December-quarter 2016 National Accounts data – which showed that real GDP had rose by a strong 1.1 per cent after recording a negative 0.5 per cent outcome in the September-quarter 2016. Annual growth (last four quarters) was 2.4 per cent. The December-quarter result was driven by strong household consumption growth (even as wages growth was negative), public investment and net exports (on the back of a massive shift upwards in the terms of trade). A bright spot was the positive private investment growth. However, I consider the overall outcome to be an unstable situation. Households cannot continue to dominate the growth outcome when wages are flat or falling and the household debt ratio is already at record levels. The decline in the household saving ratio cannot be sustained. Further, public investment is spiky (large public infrastructure projects) and could just as easily turn negative next period. The overall trend in government intent is to cut back its contribution to growth in the coming year. Which means that growth becomes dependent on the swings in the terms of trade, which fluctuate substantially.
The main features of the National Accounts release for the December-quarter 2016 were (seasonally adjusted):
- Real GDP increased by 1.1 per cent after recording a 0.5 per cent decrease in the previous quarter. The annual growth rate is 2.4 per cent, remains below the rate that is required to keep unemployment from rising given productivity and labour force growth.
- The main positive contributor to real GDP growth was Household final consumption expenditure (0.5 percentage points), public investment (0.3 points) and net exports (0.2 points).
- The only negative contributing factor was the decline in inventories (0.2 points).
- The public sector overall (consumption and investment) added 0.3 points to growth in the December-quarter as a result of a boom in public infrastructure spending.
- Our Terms of Trade (seasonally adjusted) rose sharply by 9.1 per cent in the quarter and 15.6 per cent over the 12 months. This is a “dramatic” reversal of the recent negative trend and it remains to see how long the bull run will last.
- Real net national disposable income, which is a broader measure of change in national economic well-being rose by 2.9 per cent for the quarter and by 6.8 per cent for the 12 months to the December-quarter 2016, which means that Australians are better off (on average) than they were at that point 12 months ago.
- The Household saving ratio (from disposable income) fell from 6.3 per cent to 5.3 per cent and remains well below the levels we saw just after the GFC. The problem now is that flat wages are straining households who are resorting to credit to sustain consumption expenditure.
Overall growth picture – unstable
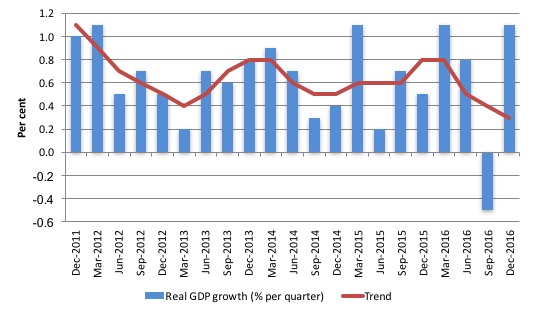
The following graph shows the quarterly percentage growth in real GDP over the last five years to the December-quarter 2016 (blue columns) and the ABS trend series (red line) superimposed.
Growth rebounded in the December-quarter 2016 – 1.1 per cent on the back of a “dramatic improvement” in export prices.
The ABS summed it up:
DRAMATIC IMPROVEMENT IN BALANCE ON EXTERNAL INCOME
The Balance on external income, which reflects net income paid to non residents, improved sharply this quarter due to record export receipts. The Balance on external income is at its lowest level since September quarter 2001 …
A significant rise in export prices accompanied with strong demand for resources and minerals contributed to this result in GOS. The strength in export prices can be observed in the Terms of trade, which was also up 9.1% this quarter. This was the strongest growth rate experienced in the Terms of trade since June Quarter 2010 …
Compensation of employees (COE) fell by 0.5% this quarter …
The Household saving ratio was 5.2% in seasonally adjusted terms in December quarter 2016, down from the 6.3% recorded last quarter. This decline was driven by weak growth in household Gross disposable income of 0.2% while household spending lifted to 1.2% from subdued growth of 0.6% in the previous quarter.
So Australia is once again riding the Terms of Trade roller coaster with the major benefits going to profit recipients as workers not only experience wage cuts (nominal and real) but also go further into debt as the household saving ratio drops.
This is not a balanced growth outlook.
The annual growth figure of 2.4 per cent is well below trend growth and well below the figure required to maintain stable unemployment (much less reduce it). But if the Terms of Trade keep booming then the next year will see strong growth.
The graph clearly shows that the trend has been downwards for 4-quarters now although it will turn up soon if the export prices remain at elevated levels.
Analysis of Expenditure Components
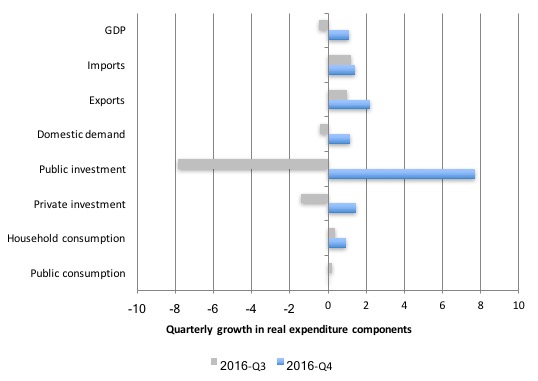
The following graph shows the quarterly percentage growth for the major expenditure components in real terms for the December-quarter 2016 (blue bars) and the September-quarter 2016 (grey bars).
The large swing in public sector capital investment expenditure is clear and significant for the overall growth result (see below).
Domestic demand growth rose by 1.2 per cent in December-quarter up from the negative 0.43 per cent in the September-quarter 2016.
This was the result of the strong public investment and household consumption growth.
Private investment grew modestly (1.5 per cent) reversing the 1.4 per cent decline in the September-quarter 2016. Perhaps we are at the end of this large decline in private capital formation.
Exports grew by 2.2 per cent and outstripped the growth in imports of 1.4 per cent. Export prices also improved significantly in the quarter – a 9.1 per cent rise in the Terms of Trade.
Contributions to growth
What components of expenditure added to and subtracted from real GDP growth in the December-quarter 2016?
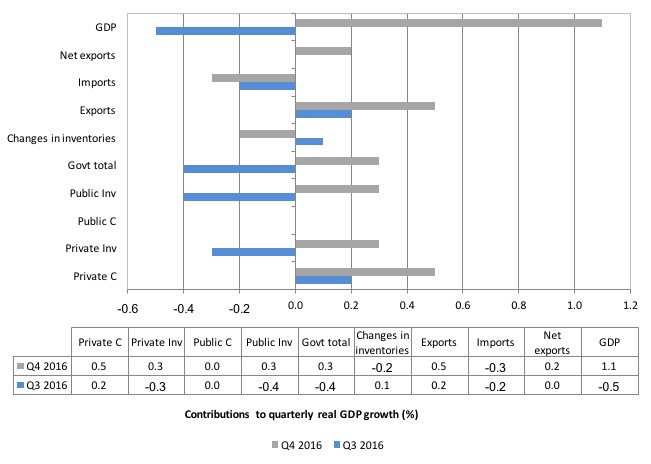
The following bar graph shows the contributions to real GDP growth (in percentage points) for the main expenditure categories. It compares the December-quarter 2016 contributions (gray bars) with the September-quarter 2016 (blue bars).
Net exports added 0.2 percentage points from growth in the December-quarter driven by an increase in volumes and the “dramatic improvement” in the Terms of Trade.
Private household consumption contributed a strong 0.5 percentage points to growth but it came at the cost of a declining saving ratio (and recording levels of indebtedness) as worker compensation growth was negative.
The public consumption contribution remained a zero contribution.
But public investment (capital formation) was the second strongest contributor to growth (0.3 points) rebounding from a negative contribution last quarter.
The overall contribution of the government sector to growth was thus 0.3 percentage points and was a stronger contributor than th external sector, despite all the hype about exports and commodity prices (which benefit profit recipients in the main).
The overall contribution of private investment on growth moved from a negative (-0.3 percentage points), in the last quarter to a positive 0.3 points in the December-quarter. This is a good sign and may signal the longperiod of slack capital formation is over.
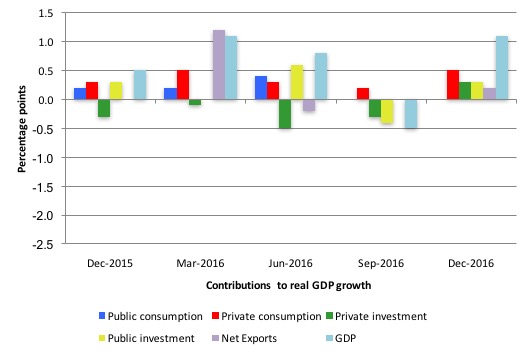
The next graph shows the contributions to real GDP growth of the major expenditure aggregates since the December-quarter 2015 (in percentage points). The total real GDP growth (in per cent) is also included as a reference.
This is why the ABS calls it a broad-based growth outcome – all of the expenditure components made some contribution to growth.
Australians overall are better off now in income terms than they were in December 2015
The ABS tell us that:
A broader measure of change in national economic well-being is Real net national disposable income. This measure adjusts the volume measure of GDP for the Terms of trade effect, Real net incomes from overseas and Consumption of fixed capital.
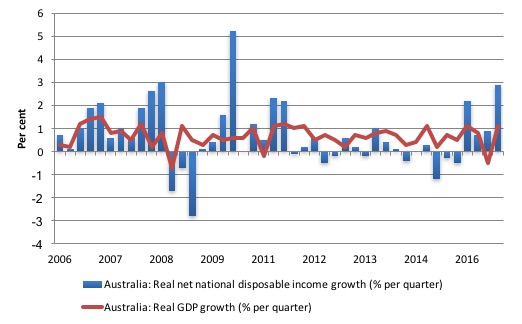
While real GDP growth (that is, total output produced in volume terms) grew by 1.1 per cent in the December-quarter, real net national disposable income growth grew by 2.9 per cent as a result of improving terms of trade over this period.
Real net national disposable income growth has been weak since 2011 and has been criss-crossing the zero line for the last three or so years.
Over the last year (to end of June 2016), real net national disposable income has increased by 6.8 per cent which means that Australians were better off in December 2016 in income terms than they were in December 2015.
This conclusion has to be tempered because with wages growth turning negative in the December quarter and profits booming, overall income inequality will be rising as a result of the flush of income from the external sector.
The following graph shows the evolution of the quarterly growth rates for the two series since the December-quarter 2006.
Household saving ratio fell sharply to 5.2 per cent
The squeeze on wages in Australia is manifesting in two ways. Rising indebtedness and falling saving out of disposable income.
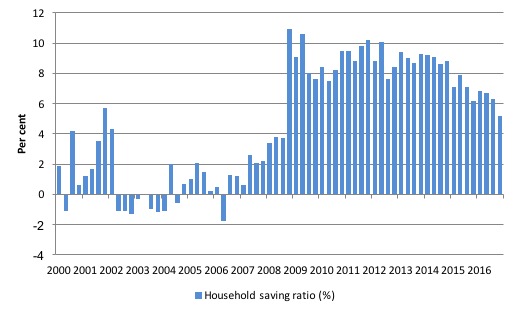
The following graph shows the household saving ratio (% of disposable income) from 2000 to the current period. The household saving ratio fell to 5.2 per cent in the December-quarter 2016 from 6.3 per cent in the September-quarter.
The ratio has been falling since the September-quarter 2014.
Further, even though Household consumption expenditure remains positive and was the strongest contributor to the overall growth outcome it is clearly not sustainable with wages so flat and debt so high.
The decline in the Household saving ratio from its 2011 levels has been associated with a renewed rise in household indebtedness – back to record levels.
After the GFC hit, the household sector sought to reduce the precariousness in its balance sheet exposed by the GFC.
Prior to the crisis, households maintained very robust spending (including housing) by accumulating record levels of debt. As the crisis hit, it was only because the central bank reduced interest rates quickly, that there were not mass bankruptcies.
In June 2012, the ratio was 11.6 per cent. Since the December-quarter 2013, it has been steadily falling as the squeze on wages has intensified.
While the recent trend has been downwards, it is unlikely that households will return to the very low and negative saving ratios at the height of the credit binge given that the household sector is now carrying record levels of debt.
At some point, household consumption growth will fall unless growth is supported by public spending (given the poor outlook for private investment and net exports).
This also means that government surpluses which were strong>only were made possible by the household credit binge are untenable in this new (old) climate.
The Government needs to learn about these macroeconomic connections. It will learn the hard way if net exports weaken and it tries to impose further austerity.
Real GDP growth and hours worked
Over the last several years, there has been the sharp dislocation between what is happening in the labour market and what the National Accounts data has been telling us.
Growth in employment and hours worked has been very modest over the period while annual real GDP growth has been around 3 per cent.
At those GDP growth rates, employment growth should be much stronger than it has been.
Today’s data shows that GDP per hour worked (productivity of labour) rose by 1.9 per cent in the December-quarter 2016 after rising by 1.3 per cent in the September-quarter 2016.
Hours worked rose by 0.4 per cent while real GDP rose by 1.1 per cent.
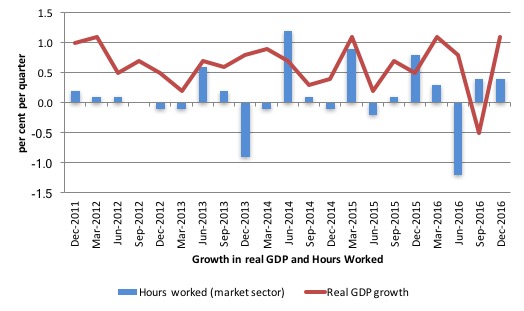
The following graph presents quarterly growth rates in trend GDP and hours worked using the National Accounts data for the last five years to the December-quarter 2016.
You can see the major dislocation between the two measures that appeared in the middle of 2011 persisted throughout 2013 and has reasserted itself in early 2016.
In the December-quarter 2016, real GDP growth and hours worked moved in tandem.
The GDP growth has driven by capital-intensive exports and more recently, capital infrastructure growth, which is one reason why labour productivity growth had been strong and employment growth weak.
Just in case you think the labour force data is suspect, the hours worked computed from that data is very similar to that computed from the National Accounts.
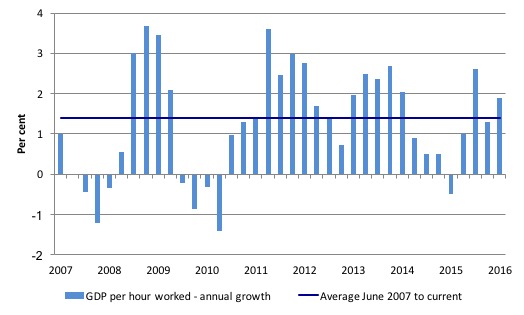
To see the above graph from a different perspective, the next graph shows the annual growth in GDP per hour worked (so a measure of labour productivity) from the December-quarter 2007 quarter to the December-quarter 2016. The horizontal blue line is the average annual growth since December-quarter 2007.
The relatively strong growth in labour productivity in 2012 and the mostly above average growth in 2013 and 2014 helps explain why employment growth has been lagging given the real GDP growth. Growth in labour productivity means that for each output level less labour is required.
In the December-quarter 2016, annual labour productivity growth was at 1.9 per cent (above the recent average of 1.4 per cent).
Conclusion
Remember that the National Accounts data is three months old – a rear-vision view of what has passed and to use it to predict trends is difficult
Today’s National Accounts data indicates that the Australian economy jumped on the Terms of Trade roller coaster again as commodity prices boomed.
But the strongest contributors to growth were household consumption and public investment.
Think about that.
Households are spending like crazy even though wages fell in the December-quarter. The saving ratio is declining steadily and the sector is already holding record levels of debt.
That cannot be sustained.
And, the government is doing everything it can to impose austerity in the form of spending cuts but should realise that it has been providing support for growth.
Even with the booming terms of trade, the external sector growth contribution was modest.
The positive growth in private investment is welcome and might signal the long period of declining private capital formation is over.
Overall, this is not a balanced growth outcome.
That is enough for today!
(c) Copyright 2017 William Mitchell. All Rights Reserved.
Annual growth for 2016 was 2.4%, with contributions to growth for Dec 15 to Dec 16 as follows: Households 1.5, Government consumption 0.6, GFCF 0 (zero)… that is a disgrace
Are these figures really worth worrying about?
They are based on a seven period moving average of the seasonally adjusted quarterly estimates of income.
Are the raw numbers published anywhere?
GDP sharply negative – employment and wages growth poor.
GDP booming – employment and wages growth poor.
GDP is clearly becoming a measure that no longer has much relevance for the state of the economy as experienced by the average person.
Were households really spending like crazy in the December quarter? Profits in retail trade, wholesale trade, accommodation and food services, transport, postal and warehousing all went negative over the December quarter – what exactly were households consuming in such a frenzy? Not many of the things normally associated with household consumer spending it seems.
Perhaps the huge explosion in financial sector profits coupled with the strong performance by construction might give a clue. Speculative property investment is going gangbusters with home ownership now basically out of reach of your typical young couple in Sydney and Melbourne and we have been riding a huge wave of apartment construction.
I suspect there’s some kind of relationship between all these things, the falling savings (or more accurately “not spending”) rate and an economy that records weak outcomes in employment and wages and weak profits in the sectors where workers typically spend their wages – regardless of wether GDP is slumping or booming.
Regardless of the headline figure, real annual GDP growth per capita has been running at the lowest rate since the early 1980’s – falling under 1% – even lower than the trough in the severe 1990 recession.
Yesterday’s solid headline print has done nothing to change the fact that the economy as experienced by John and Jane Average is close to recession, if not actually in it.
But as long as the headline figure continues to be given primacy as a guide to economic policy, governments will have an excuse to do nothing.
Bill, excellent analysis as usual!
I know it is time consuming, but I am wondering if you would be able to do a similar decomposition for US and some other major economies? I am having trouble buying into the new rosy forecasts for high growth in the US and in Europe.
Thanks for the hard work.
William
It appears the household consumption spending was very concentrated so it’s little wonder that both wages and profits in retail and related sectors managed to go backwards over the quarter, even as household consumption made the stand out contribution to growth. It was mainly in “luxury” items such as furnishings etc Gerry Harvey did well while lots of other kinds of retailers struggled.
I guess you have to furnish all those booming investment properties.