Over the last several years, I have been indicating that I think we are in…
OECD youth report – not a job in sight – Groupthink reigns supreme
Last week, the Australian National Accounts data showed that Australia had achieved 25 years without a recession. I commented on that data release in this blog – Australian national accounts – public spending saves nation from negative growth. I did several media interviews last week on this topic and, in general, the approach of the interviewer was to build this up into something almost mythical. The Government also rose beyond their usual smugness and claimed Australia was leading the world in economic policy given this track record. They don’t admit that the growth was spawned by a credit binge that has left households with record levels of debt and a housing market that is unaffordable for low income earners and young homebuyers. They also do not admit that more recently, a major fiscal intervention that continues has saved Australia from recession. Below the headlines though is a very murky situation and none more than the teenage labour market, a topic I have been trying to bring to the forefront in the public debate for many years now. The Brotherhood of St Laurence did eventually start agitating on this topic which gave it a higher visibility in the debate. But, in general, the Federal government is doing nothing constructive to solve the youth labour market crisis. And today’s release of the major OECD report – Investing in Youth: Australia – is so full of neo-liberal Groupthink language that it is clear the mainstream hasn’t grasped the problem yet – we need at least a hundred thousand new full-time jobs in the 15-19 segment alone!
By my reckoning, Australia is heading into deep trouble. I have already said that it is becoming a part-time employment nation.
86 per cent of net jobs created in the last 12 months have been part-time. An increasing proportion of these are casualised with limited entitlements.
Please read my blog – Australian labour market – the part-time employment nation – for more discussion on this point.
More people than ever are underemployed (and on average desire around 15 hours extra work per week). In July 2016, there were 1133.7 thousand underemployed persons or 8.9 per cent of the labour force.
Multiply the desired extra hours by the 1.133 million who want them and you quickly appreciate the massive waste that our nation is enduring.
An increasing proportion of the jobs created in Australia are low-paid. Please read my blog – Australia’s race to the bottom to part-time jobs with low-pay – for more discussion on this point.
Total labour underutilisation in July stood at 14.5 per cent (adding unemployment and underemployment).
Factor in the depressed participation rate (64.9 per cent in July and well below its recent November 2010 peak of 65.8 per cent) and we get an adjusted unemployment rate of 7 per cent rather than the official rate of 5.8 per cent.
Then the adjusted labour underutilisation rate rises to around 16 per cent and that understates the degree of waste because the adjustment only considers the change in hidden unemployment (discouraged workers) since November 2010. Even at that benchmark date there was some hidden unemployment.
That sort of data should put the crowing about 25 years without a recession into some context.
But while that data is bad enough there is a simmering crisis that is building up that will undermine prosperity of our nation into the future – the teenage wastage.
I have written about this before:
1. Age discrimination against our teenagers should end (February 2012).
2. Teenage employment decline in Australia reaching catastrophic proportions.
Here is an update and it coincides with the release today of a major OECD report – Investing in Youth: Australia – which is so full of neo-liberal Groupthink language that the underlying message of gloom struggles to reveal itself.
Teenage employment has been falling for more than 8 years
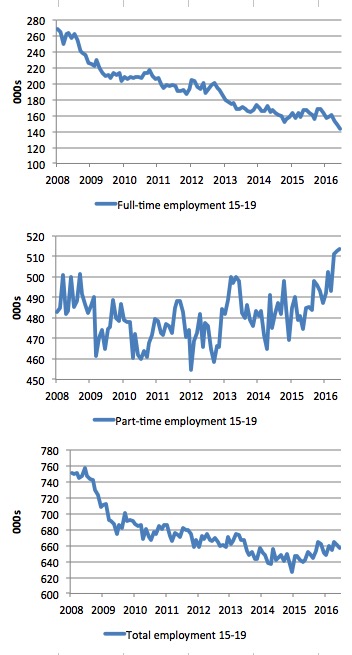
I have already documented the declining employment for teenagers on a monthly basis. Since February 2008 (up to July 2016), there have been only 1,321 thousand (net) jobs added to the Australian economy but teenagers have lost a staggering 94.5 thousand over the same period. It is even more stark when you consider that 125.4 thousand full-time teenager jobs have been lost in net terms.
Overall, the total employment increase is modest. Further, around 54 per cent of the total (net) jobs added since February 2008 have been part-time, which raises questions about the quality of work that is being generated overall.
Even in the traditionally, concentrated teenage segment – part-time employment, teenagers have gained only 30.9 thousand jobs (net) even though 808.2 thousand part-time jobs have been added overall.
How do we assess that in proportional terms? In July 2016, the 15-19 year olds constituted 6.5 per cent of the labour force. A 6.5 per cent share of the total part-time jobs added since February 2008 would yield a teenage share of 52.3 thousand jobs.
In other words, even in the most favourable segment of the labour market, teenagers have been going backwards.
The following graph shows this sordid history.
To put the teenage employment situation in a scale context we use the employment-population ratio, which is shown in the following graph for males, females and total 15-19 year olds since February 2008 (the month which coincided with the low-point unemployment rate of the last cycle).
You can interpret this graph as depicting the loss of employment relative to the underlying population of each cohort. We would expect (at least) that this ratio should be constant if not rising somewhat (depending on school participation rates).
The facts are that the absolute loss of jobs reported above is depicting a disastrous situation for our teenagers. Males, in particular, have lost out severely as a result of the economy being deliberately stifled by austerity policy positions.
In the last few months, with the part-time employment situation improving, there has been some reversal in the downward trends in these ratios.
The male ratio has fallen by 10.6 percentage points since February 2008, the female ratio has fallen by 5.2 percentage points and the overall teenage employment-population ratio has fallen by 8.0 percentage points. That is a substantial decline in the employment market for Australian teenagers.
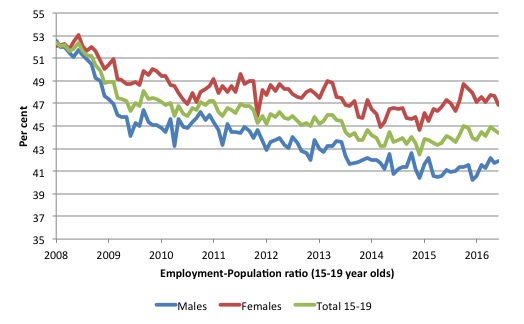
These are dramatic shifts.
Youth unemployment rates
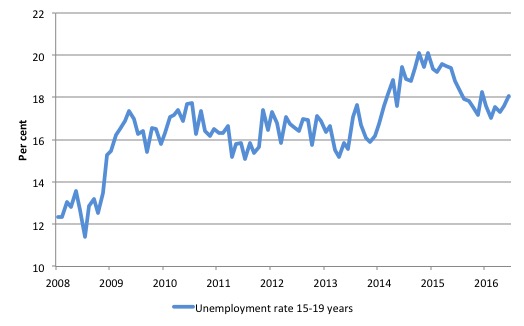
The teenage (15-19) unemployment rate was 12.4 per cent in February 2008, which marked the low-point unemployment of the last cycle nationally (the peak of the output cycle). There was a sharp increase in the unemployment rate as the economy slowed but that was arrested by the fiscal stimulus.
However, the stimulus was not sufficient large or maintained for long enough and the overall economy failed to grow fast enough to reabsorb those 15-19 year olds who lost work during the early period of the slowdown.
Now the economy is slowing again, the unemployment queue for 15-19 year olds is increasing, notwithstanding the plunge in participation and the unemployment rate is rising again.
In July 2016, the official unemployment rate stood at 18.1 per cent, a 46 per cent deterioration since 2008.
This amounts to an extra 33.7 thousand extra unemployed workers in the 15-19 age cohort. Total unemployment (all ages) has risen by 283.6 thousand. A 6.5 per share share of that increase would amount to a rise of 18.4 thousand.
So teenagers have borne a disproportionate share of the rise in unemployment since February 2008.
Over the same period, the 20-24 year cohort has seen its unemployment rate rise from 6.1 per cent to 10 per cent, again a similar sort of deterioration.
It is of course obvious that many teenagers in February 2008 have remained unemployed for the last 8.5 years and are now in that older age cohort.
Broad teenage labour underutilisation
Since July 2014, the ABS has been publishing monthly data by age and sex on broad underutilisation (unemployment plus underemployment).
In July 2016:
1. There were 1133.7 thousand people underemployed (9.5 per cent of total employment). The broad labour underutilisation rate was 14.5 per cent (of total labour force).
2. The same data for 15-24 year olds was – 363.7 thousand underemployed (19.8 per cent of total youth unemployment). The broad labour underutilisation rate was 28.9 per cent (of total labour force).
3. The 15-24 year olds constituted 17.3 per cent of the total labour force. That share of the total underemployment would yield 196 thousand underemployed rather than the actual figure of 363.7 thousand. This group is thus disproportionately bearing the burden of the labour market slack.
As we will show in the next section, the ABS estimate of broad underutilisation of 15-24 year olds is a serious underestimate because it ignores the dramatic rise in hidden unemployment since February 2008.
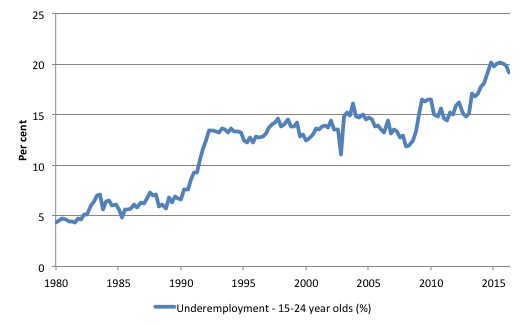
The following graph uses the quarterly ABS data on underemployment and shows the underemployment rate (%) for the 15-24 year old cohort from January 1980 to July 2016.
In February 2008, that rate was 11.8 per cent. By the May-quarter 2016, it had risen sharply to 19.1 per cent.
So not only has employment plummetted, unemployment risen sharply, and participation collapsed, but those who have managed to keep part-time employment are now increasingly facing hours rationing below their desired working levels.
The following graph shows the evolution of the youth underemployment rate since January 1980.
The initial sharp rise in youth underemployment (and underemployment in general) occurring during the 1991 recession when employers took advantage of the slack to shed full-time work and replace the jobs with increasingly fractional appointments.
The next major surge came with the 2008 downturn.
These events are cyclical and unrelated to worker preferences for part-time work etc. They require a cyclical rather than a ‘structural’ response – contrary to the narratives you will find in the IMF and OECD publications.
Participation rate has fallen sharply
The other staggering statistic relating to the teenage labour market is the decline in the participation rate since the beginning of 2008 when it peaked in January at 61.4 per cent.
In January 2008, just before the GFC was starting to hit the Australian labour market, the teenage participation rate had peaked at 61.4 per cent. By July 2016, it has fallen to 54.1 per cent. This is a major decline (see related analysis later of the rising NEET problem).
The following graph shows the decline (the blue line is the total participation rate and the red is the 15-19 year old participation rate).
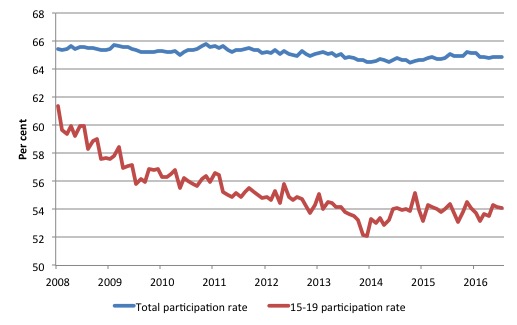
The July 2016 participation rate of just 54.1 per cent means that an additional 107.3 thousand teenagers who have dropped out of the labour force as a result of the weak conditions since the crisis.
If we added them back into the labour force the teenage unemployment rate would be 27.8 per cent rather than the official estimate for July 2016 of 18.1 per cent. Some may have decided to return to full-time education and abandoned their plans to work. But the data suggests the official unemployment rate is significantly understating the actual situation that teenagers face in the Australian labour market.
Bringing this all together to estimate the true broad labour underutilisation rate for teenagers
In July 2016, we know that:
- Since February 2008, teenagers have lost 94.5 thousand jobs overall and 125.4 thousand full-time jobs
- The official teenage unemployment rate was 18.1 per cent.
- The participation rate was 54.1 per cent down on its January 2008 peak of 61.4 per cent. It is thus likely that hidden unemployment has risen dramatically as teenagers have found search futile given the lack of jobs available to them.
- Youth underemployment has risen from 11.8 per cent to 19.1 per cent since February 2008.
So, what does this all mean for the true broad labour underutilisation rate for teenagers? The following Table breaks down the individual components of the broad rate into official unemployment, the rise in hidden unemployment due to the participation effect, and the underemployment component.
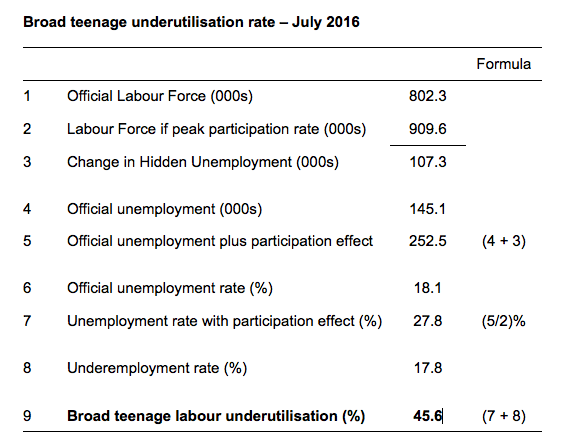
First, the participation rate effect. What does that imply about hidden unemployment for 15-19 year olds? If we consider all the decline in participation rate decline to be the result of a discouraged worker effect (which will not be far off the mark given there has been no major changes in education policy in the meantime), then the 15-19 year old labour force would be around 909.8 thousand in July 2016 rather than the official estimate of 802.3 thousand which was officially recorded.
The decline in the participation rate since January 2008 thus translates into 107.3 thousand teenagers having left the labour force since the crisis began as their employment prospects vanished. That figure has to be added to any hidden unemployment that was present at January 2008 to get a true indication of the extent of hidden unemployment.
We can assume that given the peak participation rate, that hidden unemployment was relatively low at that time. But the strict interpretation of the participation effect estimated here is that it tells us about the change in hidden unemployment since January 2008.
Second, if we add the change in hidden unemployment (107.3 thousand) to the official unemployment (145.1 thousand in July 2016) then we would estimate that some 252.5 thousand 15-19 year olds were either unemployed or near unemployed (the difference is the activity test for participation) in July 2016.
Third, the official unemployment rate of 18.1 per cent would be revised upwards to 27.8 per cent if we added in the participation effect.
So the declining labour force as a result of the falling participation rate means that the official unemployment pool is lower than it would have been had the participation rate remained constant at its January 2008 value.
Fourth, if we then add in the underemployment rate of 17.8 per cent (noting again that this is the 15-24 year old rate and so we are approximating) we get a broad labour force underutilisation rate for teenagers of 45.6 per cent in July 2016.
In summary:
The more accurate broad labour force underutilisation rate for teenagers as at July 2016 would be 45.6 per cent rather than the official estimate of 19.1 per cent.
OECD releases its Investing in Youth: Australia
The OECD released its Investing in Youth: Australia report today (September 12, 2016) to supplements its so-called Action Plan for Youth, which aims to generate the “successful engagement of youth in the labour market”.
The OECD recognises that such engagement:
… is crucial not only for their own personal economic prospects and well-being, but also for overall economic growth and social cohesion.
The OECD acknowledges that “Australia was hit much less heavily by the Great Recession than most other OECD countries, yet the labour market situation for young people has improved little since”.
They also claim that the:
The labour market situation of youth in Australian (sic) is quite favourable by international standards.
I suppose when one compares our youth outcomes (which are terrible) with Spain, Greece, Estonia, Ireland, Italy etc (which are catastrophic) then one might sit at one’s desk and type something facile like that.
Given the data I have presented above, the inference that the labour market for young people has improved is grossly misleading.
The youth labour market has gone backwards – substantially.
And one would expect our youth labour market to be in much better shape than elsewhere given the earlier observation about Australia avoiding recession.
The OECD conclude that:
The situation is not as positive, however as before the Great Recession.
Which is an understatement.
The OECD report focuses on the NEET problem which it calls a “More meaningful measure of the labour market performance of young people”.
The OECD indicates that:
… the share of youth not in employment, education or training (NEET) is 1.4 percentage points higher in 2015 than it was 2008 (11.8 vs 10.4%), with 580 000 young Australians out of education and work in 2015.
One of the disturbing trends in the last 15 years has been the increasing number of young people that are neither in employment, nor in education or training (NEET). This suggests that the systems which provide transitions between education and employment are breaking down and labour market demand is deficient.
The main reason is the lack of jobs available.
The OECD say that:
With a NEET rate of 11.8% in 2015 Austrlia does substantially better than OED countries on average (14.6%), but significantly worse than in 2008 (10.5%). NEET rates in Australia moreover vary substantially across states and territories, reaching nearly 23% in the Northern Territory compared to only 6% in the Australian Capital Territory.
The Northern Territory statistics refers to our ill-treatment of indigenous Australians which are among the most disadvantaged people in the world.
NEET risk is highest:
1. With low education attainment.
2. For females (60% of NEETS).
3. For indigenous youth.
4. For migrants from non-English-speaking countries.
For those trapped in NEET status, they “exhibit higher rates of psychological stress and lower levels of life satisfaction” compared to “non-NEET youth”.
They are not happy young people and take this depressed outlook on life into adulthood.
The OECD provides a list of what it calls “key policy options”. They are:
1. “Improve further the identification of youth at-risk of dropping out of school”. Okay, that is important.
2. “… ensure that all young people obtain the qualifications needed to continue their studies or find work”. Yes.
3. “Promote the development of after-school activities for at-risk youth” – which is important to break the cycle of disadvantage that children from poor backgrounds inherit from their parents.
As Jan Pen noted in the early 1970s “Parents are advance secret agents of the class society”.
Lots of funds are needed to facilitate this and the government severely underfunds this important area of development.
4. “Continue the efforts to increase completion rates of VET and apprenticeship programmes”. The reality is the Government (both federal and state) have significantly damaged the training sector by forcing the Technical and Further Education (TAFE) sector to compete with fly-by-night private training providers.
There have been many scandals in the last few years as these private providers are exposed as scams. TAFE is in crisis and needs a massive injection of funds. The governments are not likely to provide these funds because it would offend their ideological preference for private provision.
5. “Ensure available and affordable childcare, particularly for lone parents”. Child care is underfunded and in crisis. There are too few places and poorer mothers find it nearly impossible to place their children in care while working.
6. “Strengthen the gatekeeping of disability benefits” – read – cut benefits recipients. This category of income support always goes up when there are too few jobs.
7. Improve the accessibilty of government job services for young jobseekers. The privatised employment services sector in Australia is a scandal and the government overseeing body Centrelink is obsessed with punishment rather than human development.
8. “Follow up on the recent tightening of benefit eligibility and activity requirements for young people” – that is, make it even harder for this cohort to access income support despite the collapse of employment in the labour market.
9. “Promote further young jobseekers’ participation in training” – yes, but not outside of paid work opportunities. Much job training is useless if divorced from an actual job.
10. “Ensure that the impact of social and employment programmes are evaluated more systematically and more rigourously”. Sure.
How many actual jobs did you count in these ‘key’ policy options?
I counted none. That is, zero jobs.
Conclusion
Whether the politicians want to recognise this or not – figures like these are catastrophic for the current lives of our teenagers and young adults and for the future prosperity of the nation.
Australia has a rising dependency ratio. The challenge that presents relates to the capacity of the economy to produce new goods and services and to generate employment and productivity growth.
A government that issues its own currency clearly always has the capacity to pay – in the sense that it can always buy whatever is for sale in the currency that it issues. There is no sense in which a currency-issuing government can ever ‘run out of money’.
But there is a possibility – one that can be avoided, or at least attenuated through sound economic policy – that an economy will fail to produce sufficient real goods and services commensurate with the expectations (concerning the standard of living) of the population.
It is in this respect that rising dependency ratio presents a challenge that must be met by government. The obsession with fiscal surpluses that current policy is driven by will actually undermine the future productivity and future provision of real goods and services.
The quality of the future workforce will be a major influence on whether our real standard of living (in material terms) can continue to grow in the face of rising dependency ratios.
Governments should be doing everything that is possible to educate, train and employ our youth so that they will achieve higher levels of productivty into the future and offset the inevitable rises in the dependency ratio.
This requires:
1. That there is significant investment in education – governments should not try to ‘save’ money (as part of some mis-guided fiscal consolidation program) by cutting expenditure to public schools. The recent fiscal statement plans if carried out will severely undermine the quality of our education system.
2. There should be ways to ensure the youth are either in education or work.
The first thing a forward-looking government should do is to introduce a Youth Guarantee – which would ensure that no teenager is without work should they decide to participate in the labour force.
At the other end of the age spectrum, the concern is clear – older workers who are forced to exit the labour market prematurely are not able to bring their considerable experience to bear on developing high productivity workplaces.
The Youth Guarantee should embrace both ends of the age spectrum – the older workers bring their experience to develop skills for the teenagers who cannot find work elsewhere and do not wish to participate in full-time education.
This should be a policy priority. It is now an emergency.
All the OECD can think up is more training, more compliance and some administrative reforms. Pretty weak really but then what would we expect!
That is enough for today!
(c) Copyright 2016 William Mitchell. All Rights Reserved.
I find the debate an astonishing mishmash of hypocritical beliefs. We are told:
– we have a high dependency ratios. Yet we have the youth without work, and older workers struggling to find jobs that use their experience to the maximum. And that’s before we get into this artificial retirement age where people apparently stop doing anything useful for society overnight and are turned into paid off consumption units.
– yet at the same time we need to increase the dependency ratio by paying people off with a basic income and not bother creating anything for them to do.
So we have the crazy situation where state retirement pension age is going up, but the same people are proposing giving a pension to everybody because everything is going to be automated and there will be no work.
The human ability to hold half a dozen contradictory notions all at the same time never ceases to amaze.
Well said, Neil.
Even on the most basic level, raising the state pension age when youth are finding themselves starved of opportunity to contribute is nothing short of absolute insanity.
Even in the mainstream narrative, the idea that the middle aged should house and provide for their offspring until they are 25 while 66-year-olds continue to work is so contradictory it should cause any sane person to enrage. If I understand, this is the “story”:
* we cant afford the aged pension for so many people, so they must continue to work.
* this is depriving the youth of employment so they must stay at home longer.
* this is causing living standards of parents to drop so we need to give this age bracket tax cuts, negative gearing and capital gains tax discounts to compensate for providing for their twenty-plus year-old children
The circular logic is enough to drive a person to mental instability. And that’s before you apply the superb logo of MMT. Absolute madness.
If the driver is incompetent and unwilling to acknowledge that incompetence and improve then one needs to replace that driver. The Liberals, the Nationals and to a large extent the Labor Party are that driver.
Only a serious political challenge outside of the current neo-liberal duopoly is likely to bring positive change or even true democratic representation to this country. The duopoly is simply too constrained by the largely corrupt and manipulative main stream mass media and the massive power, financial resources and ‘post political and post bureaucracy career’ job opportunities offered by the right wing corporations and their lobbies. Some of the trade unions also have a negative influence for example with promoting the continuance and expansion of coal mining and coal fired power stations, gas fracking and the continued destructive clear felling of virgin native forests in Tasmania and Victoria primarily just for wood chips or paper pulp that can be better met by plantations.
U.S. Presidential nominee candidate Senator Bernie Sanders and to a lesser extent in the U.K., Labour leader Jeremy Corbyn and even UKIP’s Nigel Farage have shown how grass roots support can be built and harnessed to challenge the main stream corrupt, fundamentally undemocratic and debased neo-liberal path that has been pig headedly pursued for at least three decades now beyond any possible useful use by date.
Similarly Senator Nick Xenophon and his Centralist NXT Party has had major electoral success in South Australia (21% of the state-wide first preference House of Reps. federal election vote but only one seat plus 3 Senators) and there is no reason that this can’t be further improved and eventually repeated nationally with adequate organisation and preferably selection of high profile local candidates. Further some independents like Andrew Wilkie, Jacqui Lambie, Cathy McGowan, Derryn Hinch, Bob Katter and Pauline Hanson have shown that considerable political support can be gained by high profile local candidates. Also independents Tony Windsor and Rob Oakeshott, although they didn’t win the lower house seats that they contested, both could win in subsequent elections.
After decades of stagnant wages, deteriorating government services, increasing living costs and high levels of unemployment and underemployment, unsurprisingly the electorate appears to be screaming out for more political choices and a new substantial centre party and a right wing libertarianist party may even coalesce from the many independents and micro parties.
In future it appears that the ALP and LNP Coalition are probably unlikely to be able to attain a majority in the House of Reps in their own right and will need to form loose informal coalitions with the either the Greens or the other minor parties and independents. In time the Greens and a coalition of the centre and left may be able to form government in their own right. Hopefully this will be soon for the sake of our unemployed, underemployed, the environment and our rapidly declining manufacturing and stagnating knowledge/education/creativity intensive economic sectors.