Last Friday (December 5, 2025), I filmed an extended discussion with my Kyoto University colleague,…
Australian inflation rate – trending down and reflecting a weak economy
The newly-elected conservative Australian government has resumed office with further calls for public spending cuts. Today’s Australian Bureau of Statistics inflation data should disabuse them of this idea. The Australian Bureau of Statistics released the Consumer Price Index, Australia – data for the June-quarter 2016 today and showed that the June-quarter inflation rate was 0.4 per cent (-0.2 per cent) with an annual inflation rate of 1.0 per cent (down from 1.3 per cent last quarter). The headline inflation rate has been below the Reserve Bank of Australia’s lower target bound of 2 per cent for nearly two years now. Clearly, within their own logic where an inflation rate within the 2 to 3 per cent band reflects successful monetary policy, the RBA is failing. The RBA’s preferred core inflation measures – the Weighted Median and Trimmed Mean – are also now below the lower target bound and are trending sharply downwards. Various measures of inflationary expectations are also falling quite sharply, including the longer-term, market-based forecasts. With the labour market data demonstrating weakness and the economy stuck in this low inflation malaise, it is clearly time for a change in policy direction. I won’t hold my breath!
The summary Consumer Price Index results for the June-quarter 2016 are as follows:
- The All Groups CPI rose by 0.4 per cent compared with a fall of 0.2 per cent in the March-quarter 2016.
- The All Groups CPI rose by 1.0 per cent over the 12 months to the June_quarter 2016, compared to the annualised rise of 1.3 per cent over the 12 months to March-quarter 2016.
- The Trimmed mean series rose by 0.5 per cent in the June-quarter 2016 (0.2 per cent in the March-quarter 2016) and by 1.7 per cent over the previous year (1.7 per cent for the 12 months to March-quarter 2016).
- The Weighted median series rose by 0.4 per cent in the June_quarter 2016 (0.1 per cent in the March-quarter 2016) and by 1.3 per cent over the previous year (1.3 per cent for the 12 months to the March-quarter 2016).
- The most significant price rises this quarter are medical and hospital services (+4.2 per cent), automotive fuel (+5.9 per cent), tobacco (+2.1 per cent) and new dwelling purchase by owner-occupiers (+0.9 per cent).
- The most significant offsetting price falls this quarter are domestic holiday travel and accommodation (-3.7 per cent), motor vehicles (-1.3 per cent) and telecommunication equipment and services (-1.5 per cent).
The pressure is now on the RBA to reduce interest rates given that their preferred measures (see below) are now well below their targetting range (2 to 3 per cent).
The RBA may interpret the continuing weakness in the inflation data as a further sign that the economy is in trouble.
But then the RBA has little scope to influence total spending anyway. I dealt with that issue in this blog – Monetary policy is largely ineffective – which detailed why fiscal policy is a superior set of spending and taxation tools through which a national government can influence variations in activity in the real economy.
What is apparent from yesterday’s inflation figures and the most recent labour market data (see blog – Australian labour market – stagnating due to lack of overall spending – is that there is plenty of room for further fiscal stimulus.
How to align that reality with the political narratives from both sides of politics which is running the exact opposite line is the question.
Trends in inflation
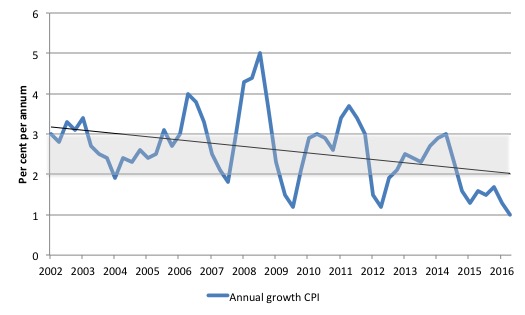
The headline inflation rate increased by 0.4 per cent in the June_quarter 2016 translating into an annualised increase of 1.0 per cent, down from 1.3 per cent in the March_quarter 2015.
This follows the negative inflation rate in the March_quarter of 0.3 per cent.
The following graph shows the annual headline inflation rate since the first-quarter 2002. The black line is a simple regression trend line depicting the general tendency. The shaded area is the RBA’s so-called targetting range (but read below for an interpretation).
The trend inflation rate is quite steeply downwards.
Implications for monetary policy
What does it mean for monetary policy?
The Consumer Price Index (CPI) is designed to reflect a broad basket of goods and services (the ‘regimen’) which are representative of the cost of living. You can learn more about the CPI regimen HERE.
Please read my blog – Australian inflation trending down – lower oil prices and subdued economy – for a detailed discussion about the use of the headline rate of inflation and other analytical inflation measures.
Is a headline rate of CPI at 0.4 per cent for the June_quarter 2016 (1 per cent for the year) significant for monetary policy decisions? To examine its lasting significance we have to dig deeper and sort out underlying structural inflation pressures and ephemeral price factors.
The RBA’s formal inflation targeting rule aims to keep annual inflation rate (measured by the consumer price index) between 2 and 3 per cent over the medium term. Their so-called ‘forward-looking’ agenda is not clear – what time period etc – so it is difficult to be precise in relating the ABS data to the RBA thinking.
What we do know is that they do not rely on the ‘headline’ inflation rate. Instead, they use two measures of underlying inflation which attempt to net out the most volatile price movements. How much of today’s estimates are driven by volatility?
To understand the difference between the headline rate and other non-volatile measures of inflation, you might like to read the March 2010 RBA Bulletin which contains an interesting article – Measures of Underlying Inflation. That article explains the different inflation measures the RBA considers and the logic behind them.
The concept of underlying inflation is an attempt to separate the trend (“the persistent component of inflation) from the short-term fluctuations in prices. The main source of short-term ‘noise’ comes from “fluctuations in commodity markets and agricultural conditions, policy changes, or seasonal or infrequent price resetting”.
The RBA uses several different measures of underlying inflation which are generally categorised as ‘exclusion-based measures’ and ‘trimmed-mean measures’.
So, you can exclude “a particular set of volatile items – namely fruit, vegetables and automotive fuel” to get a better picture of the “persistent inflation pressures in the economy”. The main weaknesses with this method is that there can be “large temporary movements in components of the CPI that are not excluded” and volatile components can still be trending up (as in energy prices) or down.
The alternative trimmed-mean measures are popular among central bankers.
The authors say:
The trimmed-mean rate of inflation is defined as the average rate of inflation after “trimming” away a certain percentage of the distribution of price changes at both ends of that distribution. These measures are calculated by ordering the seasonally adjusted price changes for all CPI components in any period from lowest to highest, trimming away those that lie at the two outer edges of the distribution of price changes for that period, and then calculating an average inflation rate from the remaining set of price changes.
So you get some measure of central tendency not by exclusion but by giving lower weighting to volatile elements. Two trimmed measures are used by the RBA: (a) “the 15 per cent trimmed mean (which trims away the 15 per cent of items with both the smallest and largest price changes)”; and (b) “the weighted median (which is the price change at the 50th percentile by weight of the distribution of price changes)”.
Please read my blog – Australian inflation trending down – lower oil prices and subdued economy – for a more detailed discussion.
So what has been happening with these different measures?
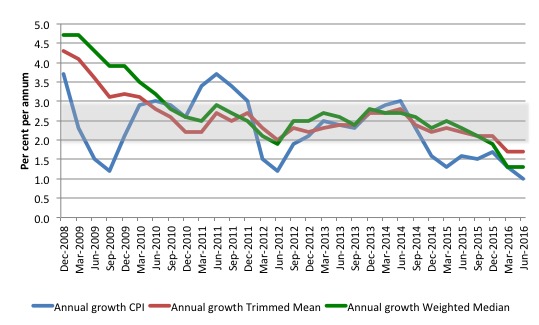
The following graph shows the three main inflation series published by the ABS since the December-quarter 2008 – the annual percentage change in the all items CPI (blue line); the annual changes in the weighted median (green line) and the trimmed mean (red line). The RBAs inflation targetting band is 2 to 3 per cent (shaded area).
The data is seasonally-adjusted.
The CPI measure of inflation (falling to 1.0 per cent) has been well below the RBAs target band for the last two years.
The RBAs preferred measures – the Trimmed Mean (1.7 per cent and stable) and the Weighted Median (1.3 per cent and stable) – are also well below the lower bound of the RBAs targetting range of 2 to 3 per cent.
How to we assess these results?
First, there is clearly a downward trend in all of the measures. The “core” measures used by the RBA have been benign for many quarters even with a relatively large fiscal deficit and record low interest rates. They are now trending down sharply.
Second, it is clear that the RBA-preferred measures are well below the lowest inflation-targeting band rate of 2 per cent.
The RBA will also be mindful that real GDP growth is well below trend and faltering and the labour market is weak and getting weaker.
In terms of their legislative obligations to maintain full employment and price stability, one would think the RBA would have to cut interest rates in the coming month given the failing economy and the benign inflation environment.
The RBA has little excuse but to cut now that all three measures are below the targetting range and deflation has arrived.
What is driving inflation in Australia?
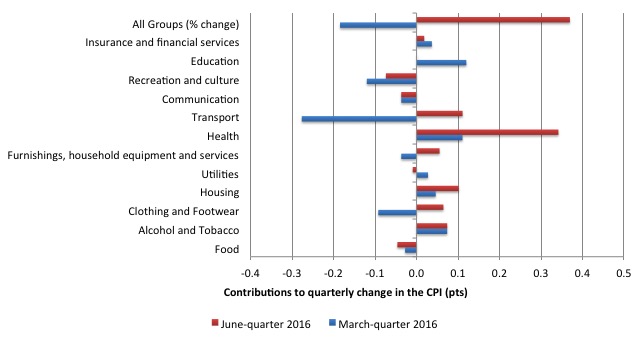
The following bar chart compares the contributions to the quarterly change in the CPI for the June_quarter 2016 (red bars) compared to the March_quarter 2015 (blue bars).
The ABS say that:
The most significant price rises this quarter are medical and hospital services (+4.2%), automotive fuel (+5.9%), tobacco (+2.1%) and new dwelling purchase by owner-occupiers (+0.9%).
The most significant offsetting price falls this quarter are domestic holiday travel and accommodation (-3.7%), motor vehicles (-1.3%) and telecommunication equipment and services (-1.5%).
The ABS also note that the “increase of 4.2 per cent for medical and hospital services was driven by the annual increase in Private Health Insurance (PHI) premiums, which rise on 1 April every year.”
Our system of compulsory PHI, which was introduced by the conservative government during the 1990s was a blatant strategy to guarantee the profits of the private health fund providers. Many would have failed without the forced subsidy.
They then abuse that compulsion on an annual basis by pushing up premiums well beyond the inflation rate – it is a scandal – especially in the context of our excellent national public health service.
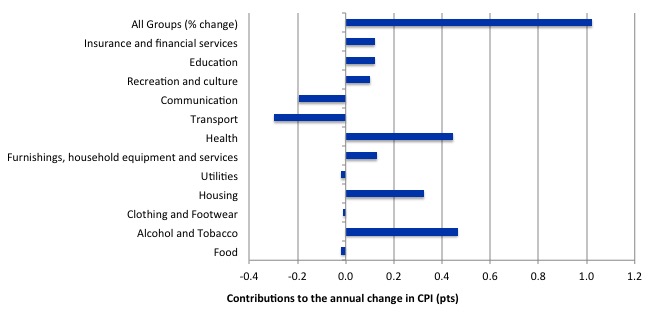
The next bar chart provides shows the contributions in points to the annual inflation rate by the various components.
In the twelve months to March 2016, the major drivers of inflation were Health, Housing, and Alcohol and Tobacco Prices. The tobacco and health price rises largely reflect government policy changes.
Inflation and Expected Inflation
The fear of inflation, in part, drives the misplaced faith in monetary policy over fiscal policy.
In my blog yesterday – The Bank of Japan needs to bring in Overt Monetary Financing next – I provided further evidence that massive expansion in bank reserves (central bank money) do not push up inflationary expectations.
If we went back to 2009 and examined all of the commentary from the so-called experts we would find an overwhelming emphasis on the so-called inflation risk arising from the fiscal stimulus. The predictions of rising inflation and interest rates dominated the policy discussions.
The fact is that there was no basis for those predictions in 2009 and seven years later inflation is turning into deflation despite the rising estimates of the fiscal deficit.
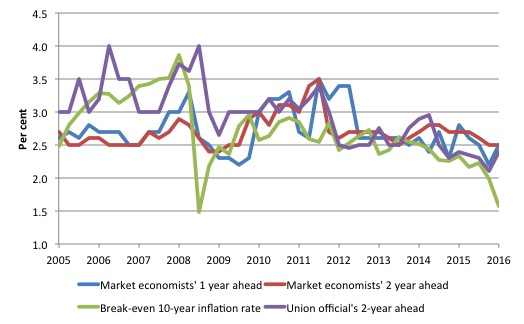
The following graph shows four measures of expected inflation expectations produced by the RBA – Inflation Expectations – G3 – from the June-quarter 2005 to the June-quarter 2016.
The four measures are:
1. Market economists’ inflation expectations – 1-year ahead.
2. Market economists’ inflation expectations – 2-year ahead – so what they think inflation will be in 2 years time.
3. Break-even 10-year inflation rate – The average annual inflation rate implied by the difference between 10-year nominal bond yield and 10-year inflation indexed bond yield. This is a measure of the market sentiment to inflation risk.
4. Union officials’ inflation expectations – 2-year ahead.
Notwithstanding the systematic errors in the forecasts, the price expectations (as measured by these series) are trending down in Australia, which will influence a host of other nominal aggregates such as wage demands and price margins.
The market economists’ two-year ahead is well above the Break-even 10-year inflation rate while the Union officials seem to have a more realistic outlook.
This is no surprise as the ‘market economists’ systematically get movements in the economy wrong and one wonders if their organisations actually bet money on their analysis!
The most reliable measure – the Break-even 10-year inflation rate – is now at 1.6 per cent, well below the lower bound of the RBA targetting range.
It has falling rapidly towards the actual inflation rate in the last few quarters, reflecting the weak state of the Australian economy.
The expectations are still lagging behind the actual inflation rate, which means that forecasters progressively catch up to their previous forecast errors rather than instantaneously adjust, a further piece of evidence that refutes the mainstream economics hypothesis that we have ‘rational expectations’ (that is, on average get it right).
Conclusion
Just before the GFC hit all the macroeconomic policy talk in Australia was about getting deficits down and into surplus to ensure that inflation didn’t accelerate.
It was nonsensical talk even then when growth was stronger and unemployment lower.
The doomsayers were completely wrong when they predicted the fiscal stimulus in 2008-09 would generate dangerous inflation impulses.
The trend has been down for some years now and some nations are fighting deflation rather than inflation.
Australia is now a member of the low-inflation/deflationary brigade as a result of our austerity-obsessed national government which is dominated by neo-liberal Groupthink. I should add the Labor Opposition are part of this Groupthink.
SO my criticism is really about the convergence of the major political parties to the flawed neo-liberal position.
Something has to give in the policy debate which remain dominated by a supposed urgent need to record fiscal surpluses.
We should be thankful that the fiscal deficits are actually rising (through the automatic stabilisers). The real economy – where peoples’ lives depend – would be in worse shape than it currently is if the politicians actually succeeded in carrying out their desires to reduce the fiscal balance.
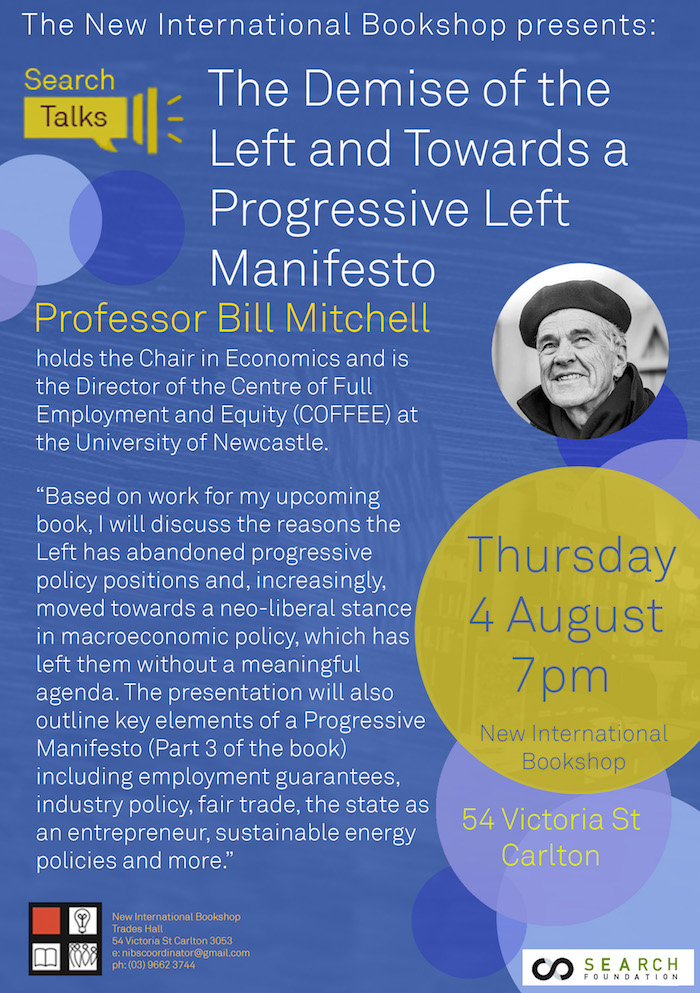
Upcoming talk at the New International Bookshop in Melbourne – August 4, 2016
On August 4, 2016, I will be giving a talk at the New International Bookshop in Melbourne (Australia) on the topic – The demise of the Left and towards a Progressive Left Manifesto – which is the topic covered in my latest book project that is nearing completion.
The talk will run between 19:00 and 20:30 and the venue is at 54 Victoria St, Melbourne, Australia 3053 – which is part of the Victorian Trades Hall.
The actual room will now be the Bella Union bar (upstairs from the Bookshop) and drinks will be available there.
There is a Facebook Page for the event.
The Bookshop is staffed by volunteers who appreciate any support they can get.
I spent many hours in my youth sifting through all sorts of radical books in its previous incarnation as the International Bookshop (operated by the now defunct Communist Party of Australia) in Elizabeth Street, Melbourne.
When I was a university student without much cash at all one – great staff member – there used to give me an orange on a regular basis – she always had one available and I guess she knew I haunted the place.
Here is the flyer. It would be great to see people at the event and the small entry fee goes to helping sustain the Bookshop, which has a long history in providing alternative and radical literature to Australian readers.
That is enough for today!
(c) Copyright 2016 William Mitchell. All Rights Reserved.
Looks like mortgage debt is cooling off, should do a pool on when the cash rate will hit zero.