Today (January 22, 2026), the Australian Bureau of Statistics (ABS) released the latest labour force…
The labour market is getting sicker
While all the green shooters out there are constantly searching for signs that things are improving the fact is they are typically focusing on financial variables. So they feel good that the share market is recovering a bit (for the time being). But I almost always focus on real variables and then more usually on the labour market. Employment is the connection that the vast majority of us have with the economy and the distribution system and the quality and quantity of employment is a crucial indicator of how well things are travelling. The latest data out today reinforces the data from last week and shows one thing and one thing only – the labour market is sick. It also points to the urgent need for a third stimulus package which unlike its predecessors should be “job laden”. If the Government fails to take responsibility in the coming weeks and funds direct job creation projects on a massive scale then the situation will worsen and we will be stuck with high rates of labour underutilisation for the next several years.
On the positive side, I think the debate is shifting in Australia. Just today, I have been invited to give keynote/panel speeches at three major events around Australia the coming weeks – to talk about employment, low wages, the role of the public sector in job creation, the scope for job guarantees and regional employment imperatives. The invitations came from different groups representing a broad cross section of our society. I am also going to address a Greens National Conference in Adelaide later this month on these issues. So I think there is a gathering momentum to force these issues into the public debate.
The shift in the debate will require the Government to start answering questions such as:
- Why aren’t they using their fiscal capacity to directly create public sector employment?
- Why aren’t they ensuring that there are jobs available for the most disadvantaged workers
- Why are they relying almost entirely on supply-side (neo-liberal) labour market programs which have failed us in the past?
If I can play a small role in pushing this debate forward so that the Government does start to take more responsibility for job creation and less for plasma TV production then I will feel better.
A Financial Review journalist asked me today about the participation rates. There is a view out there that the fact participation rates have not fallen since the downturn began is a sign that things are not as bad this time around.
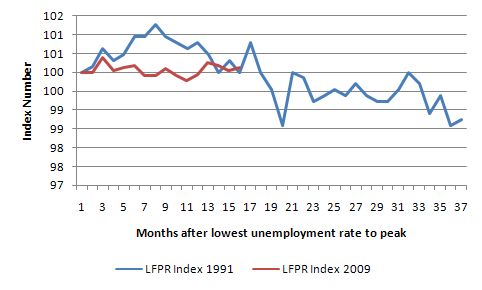
Since the downturn started (in labour market terms the low-point unemployment rate of 3.9 per cent was in February 2008), labour force participation has risen from 65.4 to 65.5 per cent (persons). For males, it has dropped slightly from 72.6 to 72.2 per cent which for females it has risen from 58.4 to 58.9 per cent. The journalist was advancing the idea that this has been a gender-biased recession to date – against males. The data suggests that so far.
To put this in perspective, in December 1989 the low-point unemployment rate for that cycle was 5.6 and things became grim after that. By the time the unemployment rate had risen by 1.8 per cent from this low-point (so a similar situation as now) participation had also risen.
Over the entire recession (December 1989 to December 1992 – where unemployment peaked at 10.9 per cent). male participation fell from 75.2 to 73.6 per cent; female participation remained constant at 51.7 per cent; and total participation fell from 63.3. per cent to 62.5 per cent. Clearly, the participation rates are higher now overall which reflects the length of the growth period we have just exited.
However, during the 1991 recession (which dragged out in labour market terms until December 1992 and the unemployment rate remained above 10 per cent until March 1994 despite GDP growth resuming in 1992), total participation also rose in the first several months of the slowdown and reached 63.8 per cent in April 1991 as GDP was plunging.
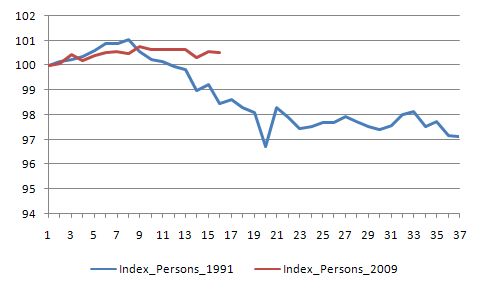
The following graph shows the labour force participation rates indexed to 100 at the start of the 1991 and 2009 downturns. The actual base months are December 1989 and February 2008, respectively, which represented the low-point unemployment months in the respective cycle. In 1991, labour force participation actually rose more (blue line) than in the current downturn (red line). At a similar point in the cycle (months after the low-point) you would not say there was very much difference between the two episodes. The deterioration set in after several months (about the point we are approaching in the current cycle).
Labour force participation rate dynamics – 1991 and 2009
So the point is that we should not feel comfortable now looking at participation rates given their behaviour in the last recession.
So far the “added worker” effect is dominating the “discouraged worker” effect. The former suggests that households add hours of work (typically the second breadwinner – female usually) as the economy deteriorates to ensure family income is maintained as the primary breadwinner loses hours or their job. The latter suggests that ultimately people give up actively seeking work as vacancies dry up and they “drop out of the labour force” using the official definitions applied by the national statistician. In the early part of the downturn the former effect dominates.
This is likely to be reinforced by the fact that in the early stages of the downturn full-time work drops sharply and firms replace labour with part-time hours. They also try to hang onto labour by cutting hours rather than sacking the workers. This is clearly going on in the Australian labour market at present.
The stimulus package was more focused on the service sector than on the goods-producing sectors (such as manufacturing). The relative fortunes of these two broad sectors is having a gender effect.
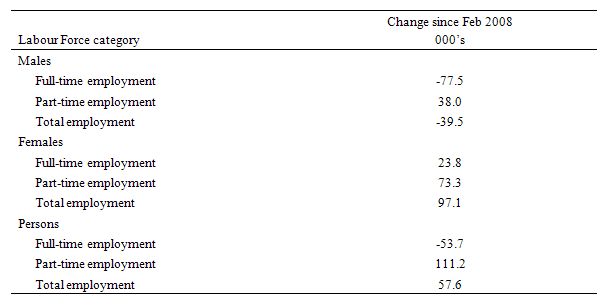
The following table shows the employment changes since the low-point month of February 2008 to May 2009 (taken from the ABS Labour Force Survey). It is clear that to date males are losing full-time work faster than they can get part-time work, while females have enjoyed growth in both segments of the labour market.
Employment changes since February 2008
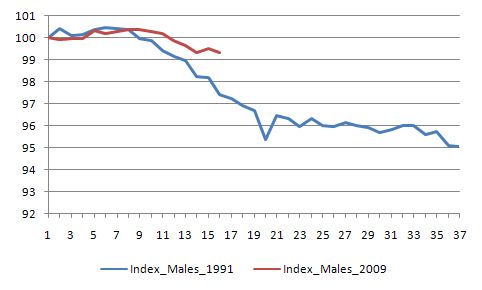
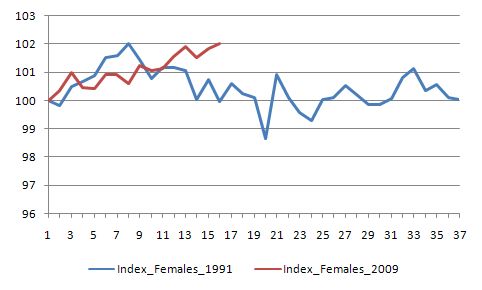
To put this is perspective relative to 1991, the following three graphs compares the evolution of employment for males, females, and all persons from the low-point unemployment rate month (noted above) for each cycle. The blue line is the low to high unemployment rate period for the 1991 recession and the red line is the period since February 2008. The horizontal axis are months since the low-point.
You can see that males are following the same downward trajectory as in 1991 although the loss of employment is not yet as severe. Full-time losses were more severe in 1991.
Male employment dynamics – 1991 and 2009
The next graph is for females. It shows that at a similar stage in the cycle (measured in months since the low-point which may not be a similar stage defined in other terms), females are faring better this time. In part, this is due to the strange behaviour of female full-time employment this time. In 1991, this fell away sharply along with male full-time work. The current behaviour needs further research.
Female employment dynamics – 1991 and 2009
The final graph shows the same dynamics for persons (total employment). It reinforces the fact that something happened around the 9th or 10th month into this downturn that has held employment up relative to the 1991 downturn. The early stages of each downturn saw employers shedding full-time work overall but more than replacing it with part-time employment. It wasn’t until the demand constraints were considered to be worse than first considered that employers starting shedding labour overall in 1991.
But I suspect the stimulus packages which came early into the downturn and were fairly substantial have extended the period in which firms are prepared to carry workers instead of firing them. This is referred to as labour hoarding. It was largely absent in the 1991 recession but then the Government failed to react until it was too late – remember the “soft landing” rubbish that was fed to us then as an excuse for the Government to do nothing.
Total employment dynamics – 1991 and 2009
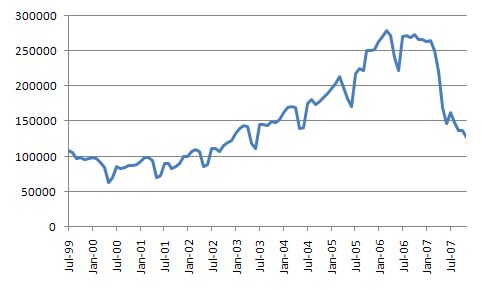
Anyway, with all that in mind, today’s labour market data indicates that the labour market is deteriorating further. While so far employers might have been prepared to adjust hours instead of persons in meeting the waning aggregate demand, the ANZ Job Advertisements Series shows that vacancies (evidenced by job advertisements in newpapers and on the Internet) are falling away sharply.
The total annual decline to June 2009 has been 51.4 per cent with the advertisements declining by 6.7 per cent in the last month alone. It is also the 14th consecutive month that the series has fallen. The following graph shows the ANZ series and the extent of the recent plunge.
ANZ Job Advertisement Series, July 1999 to June 2009
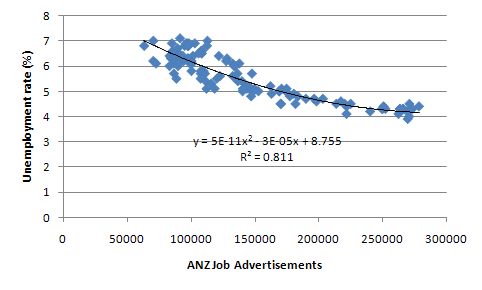
The next graph shows the very strong (scatter) relationship between the ANZ series (horizontal axis) and the official unemployment rate (vertical axis) since 1999. So when the job ads fall we would expect the unemployment rate to rise. The simple quadratic regression reported suggests that the unemployment rate will rise marginally in the June (data out soon).
ANZ Job Advertisement Series and ABS Unemploymenr Rate, July 1999 to May 2009
The spokesperson for the ANZ said that the close relationship between the job ads series and the unemployment rate is not as obvious at present. He said:
It doesn’t tell us whether corporations are firing workers or shedding labour … The official numbers are performing a lot better than what the job ads, or indeed many business surveys, are telling us you would have expected to have seen, and that’s telling us that corporate Australia is hoarding labour, that it’s holding onto skilled workers, that it’s trying to weather this economic storm, that it’s doing that by reducing hours but it’s not, at this stage, actually laying off workers.
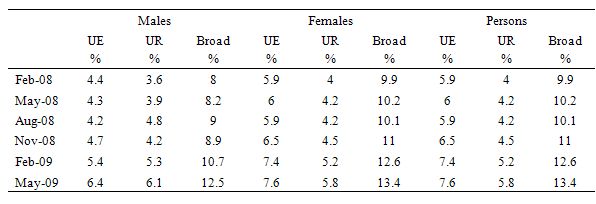
And that is being borne out by the broader labour market indicators published by the ABS which I show in the following table. The slack is being borne by rising underemployment (UE) at present. The broad indicator is the sum of UE and the official unemployment rate (UR). The sharp rise in the broad measure since February 2008 is indicative of a failing economy. We now have around 13.4 per cent of our willing workers underutilised.
The employment gains made since the downturn began in volume do not equate to quality. The labour market is creeping along with increased casualisation, lower pay and low productivity growth. Further, this situation cannot persist. If aggregate demand continues to lag then firms will start retrenching workers in increasing numbers which will work to reinforce (or multiply) the downturn. Even part-time employment would start to fall under this scenario.
Broad labour underutilisation, February 2008 to May 2009
Meanwhile the other data that came out today shows that inflation is not a problem – rather that deflation threatens. The latest private survey data released today from the . The TD-Securities/Melb Institute series suggests that inflation rose 0.4 per cent in June but fell by 0.3 in May and was flat in April. Taken as an annualised rate the so-called inflation ggauge rose by 1.4 per cent which is the lowest in this series history (albeit the history is not very long – mid-2002). Given the annual rate of inflation in May was 1.5 per cent, the June estimates show that inflation is falling.
Conclusion
The current situation is consistent with a labour market teetering on the edge of a serious decline. It indicates that the stimulus packages to date have probably helped prevent a major deterioration. But the nature of the stimulus is such that it will peeter out in the coming months and was not very “job laden” or “job rich” in the first place.
I consider that another major expansionary package will be needed sooner rather than later if the Government is to assume its proper responsibilities to defend jobs. The next package will have to be orientated to large-scale job creation or things may look pretty bleak this time next year.
Business does not seem particularly confident about the immediate future according to this report which has one-third of those surveyed expecting to lay off staff.
http://www.theaustralian.news.com.au/business/story/0,28124,25742576-643,00.html
The labour market impact of the global recession is definitely ahead of rather than behind us. Changes, both good and bad, in the casino economy always predate changes in the real economy. That’s the real reason to look for “green shoots” in that casino economy – if they’re not happening, then the real economy will be in deep sh*t in a year’s time. The fact is that they are happening, so it looks like we’ll avoid the worst-case scenarios about the depth and length of the slump.
Which is not to say that average folks aren’t facing some real pain over the next year or so, which given hysteresis in the labour market means that a minority will be facing real pain for a decade or so. I dunno about direct job creation, but we’ve got lots and lots of fiscal and some monetary ammunition in reserve. Why the RBA hasn’t tested the zero interest bound yet, and why the government hasn’t done another round of stimulus, I can’t work out. The only thing I can think of is that they have a “strong Aussie dollar” policy, which is folly.
I can’t fault your conclusions on where the labour market is heading. The question I’d like to pose is should the government be creating jobs or just aiming at making labour market transitions as painless as possible? Howard and co. spent years demonising the unemployed with such charmingly named programs as “work for the dole”. I suspect destigmatising unemployment, providing easier bankruptcy provisions and providing good support for labour market transitions may be a more cost effective way of dealing with what is looking to be a very long and painful period of transition. A government that drives itself into enormous debt at this stage is like a marathon runner treating the race like an 800 metre event.
@Rycoka: you’ve waved a red rag at a bull there! I’m sure Bill could say plenty in response (or perhaps just point you to various previous posts), but I’m sure two points would be amongst them: (1) why simply work at making unemployment “painless” when the Government has it in their power to create jobs and (2) the Australian Government is not fiscally constrained an simply happens to choose to match spending over and above tax receipts with bond issuance. For a real life example as to why the marathon analogy fails, just look at Japan in the 90s!
While most people here consider Steve Keen to be stark raving mad, does anyone think that he has a point regarding de-leveraging? In that he feels that growth has been driven by unprecedented levels of private debt expansion, that this can go no further and is rapidly unwinding and can no longer fuel growth at present. That the green shoots can probably only last as long as government is prepared to keep issuing stimulus packages.
Thanks Sean,
Actually I scanned back at a previous post and realised I might have stumbled into an area where my ignorance might leave me exposed. Not being shy though I’ll have a quick go at the points you raise:
1) Governments can of course create jobs, but by doing so they deny the skills they employ to the rest of the economy. In addition, I would think they would struggle to “create” good high paying jobs, perhaps trapping people in lower paid work.
2) The Australian government is surely constrained in its behaviour by its enagement in the world economy. Would not the currency markets operate to devalue a currency being managed by a government that abandoned fiscal restraint – meaning a hit for the average consumer of manufactured imports?
Try not to be too harsh in riposte!
Rycoka,
the wording of your post suggests to me that you believe public sector employment to be an inferior waste of resources and that only the private sector can properly utilize such resources.
Could you outline for me a clear reason why government should be simply incapable of employing labour and other resources in a manner that is beneficial to the economy? (Actually, we live in a society, not in an economy). By providing public health and education, government is surely denying the private-for-profit sector a great many highly skilled professionals. Would you consider that by providing some sembalence of public purpose and ensuring that those who lack the financial means to fully fund their own health care and education can at least access the basics, government is wasting resources?
Or if these things are not a waste of resources, why can the same argument not apply to other things as well?
Many people do not give thought to the fact that the unemployed are already in the public sector. If government can provide welfare, surely it can provide meaningfull employment.
As to your second point, I’m sure a lot of Aussie exporters and local producers who are constantly buffeted by unbeatable competition as capitalists shift production to the developing world in the pursuit of higher profits would not mind a little devaluation.
@Rycoka: Harsh? Never! At least I hope not. Job my means of a “Job Guarantee” is Bill’s baby, so I’d say the best response to that one is to point to one of his posts. Scroll down to “What is the Job Guarantee?” in this post (and it’s frequently discussed elsewhere). The key is that under the scheme the minimum wage is paid so the scheme should not siphon off those currently employed the moment the skills of those taking up the guarantee are valued highly enough by the rest of the economy, they could be poached away by paying more than the minimum wage. I am sure there are plenty of details in practice to get it right, such as where the minimum wage should be set and what sorts of jobs are offered (otherwise people may not want to move even with a pay rise), but the broad design is aimed precisely so as to avoid denying the broader economy the use of the skills of the unemployed which, after all, are not currently being utilised.
As for exchange rates, a fall in the Australian dollar is certainly possible. Initially this may occur based on fears that fiscal/debt approach would be inflationary (similar things have been happening, but only briefly, to long-dated yields), but looking at the Japanese example again, if the approach was managed so that spending remained within the supply capacity of the economy it need not be inflationary and if policy ended up not being inflationary, there would be no reason for the dollar to decline. Having said that, even if it did fall, while it would put pressure on imports it would also make our exports even more competitive, so the overall economic impact is not clear. However, it does highlight how important it is to the whole approach that the Government only have domestic currency denominated debt! If there was a collapse in the dollar, it would make it hard to repay foreign-denominated debt (fair money or no) and, while Bill may well disagree with me here, I do think that defaulting on foreign debt does create broader problems for trade. Even these problems may, however, be short-lived as the examples of Russia and Argentina would suggest.
Sean,
I just had a quick look at the “job guarantee” post and I have some concern that it leans towards a socialist / totalitarian model. In my minds eye I can see the armies of grey unemployed being marched off to their minimum wage “job” (I assume unemployment benefits would be denied those who would not “work”) and returning exhausted at the end of each day to their “public housing” barracks. As someone who spent some time unemployed in the eighties I say “no thank you”. Give me the private misery of boredom, minimum social security and third rate housing any day over forced labour.
Lefty,
I recommend a dose of Ayn Rand for you. She’s a bit of a ranter but her background gave her a good view of what happens when the state is running the economy. Mind you, you only have to look at the debt soaked households of Australia, the UK and the US to see what happens when the banks are left to run things. My personal view is that the state has a role in controlling the currency that implies direct power over the financial sector. It should also, given that it is possible, play a role in providing a floor on living standards (not by forced labour – God I hate work for the dole as a concept) including health care. Apart from that it should minimise its role. Have some faith in people to run their own lives, even if the results can appear messy.
Dear Lefty
I cannot recall ever having a poll about Steve on this blog. The only comment I have made is that Steve chooses, unwisely in my view, not to place his analysis within the government-non-government structure of a fiat monetary system. I get along fine with Steve personally.
As to de-leveraging Steve was not the first to be writing about this in Australia. I checked back to my published academic work and found I first started to write about this in 1994. There are many papers (chapters in books, journal articles etc) where I develop this theme. The following section comes from a paper that came out in 1995 (it is the earliest published material I can find) on the topic:
My core message over many years has been that if you run surpluses, then growth can only proceed with private debt unless you have a Norwegian situation where the net exports are very strong (which cannot be a universal model). I have also consistently said that the net spending of government has to fill the saving desires of the non-government sector. These are core billy blog messages and resonate through my academic work for years now.
So I don’t see what juxtaposition you are making here Lefty.
best wishes
bill
Lefty/Bill: I’ve been giving the whole question of deleveraging a lot of thought lately (might even post on the topic in my own blog). While any kind of debt availability can assist an asset bubble, I think that the nature of the deleveraging process can vary significantly depending on the structure of the debt. The classic type of debt that can trigger severe asset price falls are margin loans: they create a vicious cycle as margin calls force borrowers to sell which pushes prices down which leads to margin calls. This is not the only type of forced selling: in the case of property, the main case is foreclosures which can result from rising interest rates (either through market rates rising or step-ups of the sort seen in many US sub-prime loans) or rising unemployment (with a job the loan can be services, without it cannot). Where loans are long term, interest rates remain low and unemployment doesn’t increase too rapidly, deleveraging need not result in asset price collapse as many people will be reluctant to crystallise losses. Instead prices can go sideways for an extended period. This is what happened in Australia in the early 90s while prices collapsed in the UK. Unlike Steve Keen, I suspect this is the more likely scenario for deleveraging in Australia this time around too.
Rycoka: Despite Bill’s libertarian tendencies I suspect he’s sufficiently left-leaning to be less than enamored of Ayn Rand. As for the totalitarian scenario, I don’t think that Bill envisages making the jobs compulsory. It’s more a matter of making jobs available for those willing and able to work when there is insufficient private sector demand for labour.
Rycoka,
I was actually asking you what you think not what Ayn Rand thinks.
But I am glad to see that you agree that government has a role in providing a floor under living standards, though tend to suspect you would favour a floor somewhat lower and narrower than one I would favour. Good, I would hate to think that you were one of those people who, while standing in a position safely out of the water, call for the life preservers to be cut off those who are in the water.
Bill,
Thanks for your response about de-leveraging.
But as to the other issue, I seem to recall comments passed on this blog to the effect that Keen was a worthy person but as an economist was barking mad. I don’t recall any names but I do seem to remember more than one person alluding to it. So I am not making it up although I suppose I could be getting it confused with a different political-economics blog as I surf many on a daily basis.
Sean,
Thanks for your response to the de-leveraging question. It seems an interesting issue to me.
One thing I find interesting to note though Sean, is the (if Keen’s statistics are accurate) huge ratio of private debt to GDP. The graph was given for the US but I imagine it is probably similar for Australia, maybe not quite as extreme.
It appears that the only time that the ratio approached anything like it was just before the crisis broke out was just before the great crash of 1929. It then plunged and kept plunging for about 15 years. It took around 73 years – a whole human lifetime – to again draw level with the pre-1929 levels and then exceed them.
In the last recession, the ratio was only a bit more than half the 1929 ratio. This time, it is at a historic high, close to 300% of GDP as opposed to around 240% in 1929.
You don’t think this is particularly significant?
cheers
Lefty: I do think it is significant and I do expect that like the rest of the world, Australia will experience a period of deleveraging. My point is that deleveraging can take take different forms: at one extreme, debts vanish through default (which is generally accompanied by forced asset sales) at the other extreme borrowers do not default but switch to paying down debt rather than increasing their borrowing. My hypothesis is that the US is closer to the first extreme and we are closer to the other. Keep in mind as well that, as Bill regularly points out, simple accounting identities imply that Government fiscal deficits and matched by private sector saving and vice versa. We have now switched from private sector borrowing to private sector saving and for many, saving simply means paying down their debts.
The comparison with 1929 raises another interesting point. Back then much of the private sector debt was margin lending for share investors. While the increase in debt in Australia certainly included margin lending, much of that has already been unwound (and, consistent with my earlier comment, share prices fell rapidly during that process). Since then in both Australia and the US a range of Government policies and developments in consumer finance have led to far broader access to home finance and so I suspect (but do not have the data to hand) that the composition of the private sector debt both here and in the US is very different to the composition back in 1929 and this can make a big difference to the way deleveraging takes place.
While it’s a bit off topic, last year I wrote about some of the similarities and differences between the US and Australia in the GFC. It could probably do with an update, but some of it is relevant to the distinction between the US and Australian mortgage market circumstances.
Thanks Sean.
What fascinates me is the sheer size of the private debt. Even before I stumbled across Bill’s blog and recieved some basic economics tuition, I have always wondered what would happen when this situation eventually started to reverse itself.
Unless I am mistaken, all anecdotes I have seen have suggested that private households in the US (and here as well) have accrued a level of debt not seen before in modern history. When a huge surge of private households switches from spending to paying down that debt then I imagine that the economic impact could well be severe. As you say, the composition of the debt is probably different to 1929. Perhaps much of it is a combination of grossly inflated real estate prices and consumers living on credit for everyday consumption.
I guess the cut and thrust of my musings here is that it looks to me as though economic growth has been quite heavily driven by an expansion of private debt to a level never seen before. It appears that world leaders believe that after weathering a rough patch, we will simply go back to business as normal. So they appear to think that private debt as a proportion of GDP can simply continue to expand to ever more stratospheric levels and continue to underpin growth. Further, the general rumblings out there are that they should get back to balanced budgets as quickly as possible.
I am concerned that private debt as a driver of growth can go no further and governments obsessed with neo-liberalism will end up trying to cut spending and we will end up with high unemployment and a spluttering economy as those in control cannot bring themselves to abandon their core ideology. Maybe I’m wrong. Maybe the train will land straight back on the same track and keep on chugging down it. Maybe a private debt to GDP ratio of 300% is sustainable. Maybe it can grow to 4 or 5 or 600%. Maybe 1000% (don’t think so though).
I do know that we will continue to live in interesting times.
Dear Lefty
Your understanding of the dilemma is sound. Unless governments go back to the practice of funding private saving via deficit spending on a more or less continuous basis we will have the debt binge-crisis episodes as repeating events in our forthcoming history. And persistently high labour underutilisation and rising inequality which has been the hallmark of our most recent episode will dominate our social landscape.
By the way, you cannot get private debt data for Australia during the 1930s. Most of the debt was public anyway. But the comparisons are unsound because the monetary system was different then. The governments had to go into debt to fund their net spending. Now they do not.
best wishes
bill
Lefty: I don’t think you are mistaken. There is certainly an upper limit to private sector debt since GDP(broadly) represets income borrowers have to service their debt from their income. If we assume a generously low average interest rate, if debt/GDP was more than 1400% there simply wouldn’t be enough income to service the debt. Of course, in practice some in the private sector have debt and some do not, so the real upper bound is much lower. For example, if you assumed that half the GDP generators had no debt and the other half all had the same % level of debt, then the upper bound would have to be more like 700%. Again, this figure is almost certainly still too high. The actual level of the upper bound is very hard to determine, but it’s out there!