Yesterday, the Reserve Bank of Australia finally lowered interest rates some months after it became…
Not a wages breakout in sight
Australian readers will recall earlier in the year when the Federal Employment Minister Eric Abetz warned the public that there would be a wages breakout unless union power was curbed and they negotiated collective agreements with employers that were in the national interest. The ABC news report (January 14, 2014) – Eric Abetz warns of wages ‘explosion’ unless employers stop ‘caving in’ to unions – said that the Minister berated “weak-kneed employers” who caved into “unreasonable union demands” and then lobbied him to cut union power. The same scaremongering accompanied the decision by Fair Work Australia to lift the minimum wage by xx per cent on June, 2014. This was not only a wages explosion but would cause a catastrophic loss of low-paid jobs according to the right-wing anti-worker cheer squad, including leading figures in the Federal government. The problem is that these ‘beat ups’ are lies.
In a speech to the right-wing think tank, The Sydney Institute, the Federal Minister said:
We risk seeing something akin to the wages explosion of the pre-accord era when unsustainable wage growth simply pushed thousands of Australians out of work.
I loved the word ‘akin’ – which means ‘of similar character’. So what could be similar to a wages explosion but is not a wages explosion? I guess a wages breakout! Well at least that is sorted.
Like all these right-wing zealots, the Government ministers are big on advertising their own self-importance but very weak on reality. They just lie whenever they choose and hope the public will not scrutinise their comments. Invariably their hopes are fulfilled.
The wage series is the quarterly ABS Wage Price Index (last published March 2014). The Non-farm labour productivity per hour series is derived from the quarterly National Accounts.
A compact dataset can be downloaded from the RBA Table H2 Labour Costs and Productivity.
Anyway, here are the facts (and some interpretations based on the facts). At least I start with the facts. The Government appears unable to conduct itself in that way.
Workers not sharing in productivity growth
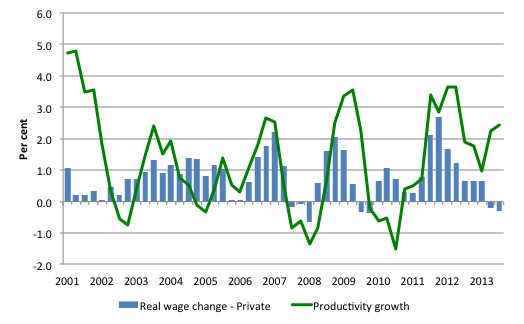
The next graph shows the annual hourly real wage change for the private sector (blue bars) and the annual hourly productivity growth (green line) since the March-quarter 2001. Productivity growth is booming at present, which is one reason why employment growth is so flat. For each extra dollar of real output, less workers are needed when productivity growth rises.
The usual payoff is that the rising productivity growth is shared out to workers in the form of improvements in real living standards. Higher rates of spending then spawn new activity, which soaks up the workers lost to the productivity growth.
The problem is that the payoff has been clearly absent over the last 3 years with real wages growth lagging productivity growth.
Real wages and productivity growth – a massive redistribution to profits
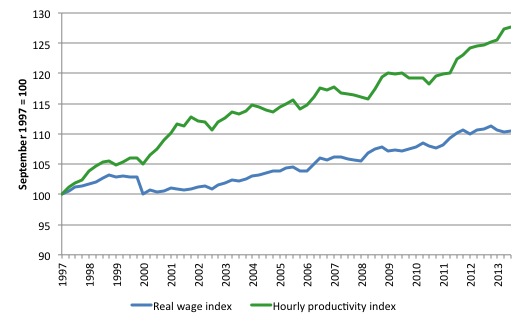
The following graph shows the indexed growth in hourly real wages and labour productivity per hour since the September-quarter 1997. If I started the index in the early 1980s, when the gap between the two really started to open up, the productivity index would stand at around 170 and the real wage index at around 115.
Starting the index in the September-quarter 1997 produces a smaller gap, which just goes to show that one can manipulate data to achieve a range of ends (often quite contrasting) by altering the sample size. That is one of the oldest tricks in the book. Sometimes just dropping one or two observations produces radically different results. Remember our spreadsheet champions R&R who deceived the world with their public debt threshold nonsense only to be found to be incompetent at best as a result of poor spreadsheet use.
What is clear is that since the September-quarter 1997, real wages have grown by only 10 per cent (so just over 0.6 per cent on average per year), whereas hourly labour productivity has grown by 28 per cent (or 1.65 per cent on average per year).
This is a massive redistribution of national income to profits and away from wage-earners and the gap is widening each quarter.
Where does the real income that the workers lose by being unable to gain real wages growth in line with productivity growth go? Answer: Mostly to profits. One might then claim that investment will be stimulated. The Investment ratio is
As the real wage declines and the gap between productivity rises, the Investment ratio (percentage of private investment in productive capital to GDP) has barely risen over the course of the crisis period (since February 2008) and since the June-quarter 2013 it has fallen from 24.4 per cent to 22.1 per cent. Quite a drop.
Some of has gone into paying the massive and obscene executive salaries that we occassionally get wind of.
Some will be retained by firms and invested in financial markets fuelling the speculative bubbles around the world.
For workers, the problem is that they rely on real wages growth to fund consumption growth and without it they borrow or the economy goes into recession. The former is what happened around the world in the lead up to the crisis (and caused the crisis).
The latter is more or less what is happening now.
Australia is doing worse than the US
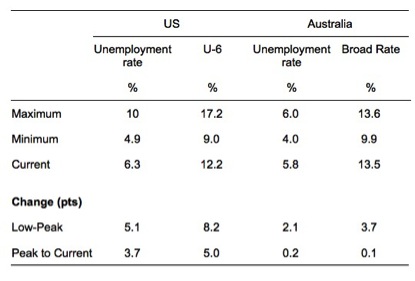
For those who claim that the lower real wages growth has helped Australia beat the world in terms of rising unemployment rates in the recent recession the following Table is interesting.
It compares the US unemployment rate (as at May 2014), with the US U-6 measure ( Total unemployed, plus all marginally attached workers plus total employed part time for economic reasons, as a percent of all civilian labor force plus all marginally attached workers) available from the US Bureau of Labor Statistics with the Australian unemployment rate (as at May 2014) and the ABS Broad Labour Underutilisation rate (which is the sum of unemployment and underemployment).
So the U-6 and Broad measures are compiled because unemployment rates are too narrow to capture trends in labour wastage. The U-6 measure is broader than the ABS Broad measure because it includes workers not classified within the labour force. The comparison that follows would be further in the favour of the US if I had have taken the time today to compute an equivalent Australian measure to the U-6 US measure.
The data being compared is between February 2008, which was the low-point unemployment rates in each country before the recession. In the US it was 4.9 per cent and in Australia 4.0 per cent. The U-6 measure was 9 per cent and the ABS Broad was 9.9 per cent. So fairly similar positions, although Australia had more underemployment than the US and slightly less official unemployment.
As the downturn hit, the US aggregates soared to 10 per cent and 17.2 per cent (for the two measures) – unemployment rising by 5.1 percentage points and the U-6 measure rising by 8.2 percentage points.
Australia contained the rises somewhat – unemployment rose to 6 per cent so a change of 2.1 percentage points (rounded) and the ABS Broad measure rose to 13.5 per cent (a rise of 3.7 percentage points).
But the recovery in the US is much faster since the peak labour wastage (trough of the output cycle). The unemployment rate has fallen by 3.7 percentage points compared to Australia’s fall of 0.2 percentage points. The direction of change in the US is down, whereas the Australian labour market is looking at higher unemployment.
In terms of the broader measures, the US has seen a 5 percentage points improvement in its U-6 measure from the worst month whereas Australia has only seen its broad rate drop by 0.1 percentage points.
There has been no recovery in Australia in net terms when we compare the situation now to February 2008. All the gains made by the fiscal stimulus have been squandered and the outlook is poor.
Real wages are falling and the volume labour market measures are turning against us (employment down, participation down, and unemployment up).
Perhaps if workers were paid more they would spend more without having to rely on credit to keep some semblance of growth in their expenditure going.
Conclusion
Not a wages breakout or explosion in sight!
All a bit premature
Just as Groupthink in economics has left millions of people without jobs without any good reason, the same sort of thinking in international relations has left millions of people dead without any good reason.
Time to have a ‘non-war on terrorism’. Start creating jobs and expand public education in areas where danger emanates from (including among Republican strongholds in the US). That might stir some hope in people rather that the fear that the neo-liberals and neo-cons like to create.
That is enough for today!
(c) Copyright 2014 Bill Mitchell. All Rights Reserved.


Bill, has your book on the euro been published already? I intend to buy it.
Regards. James