Today (January 22, 2026), the Australian Bureau of Statistics (ABS) released the latest labour force…
Australian government policy failing our youth
The Council of Australian Governments (COAG) Reform Council, which is part of the federal-state government machinery released a report this week – Education in Australia 2012: Five years of performance (2 mgbs) – under the terms specified in the National Education Agreement that was signed in January 2009. The agreement was a major piece of policy in the term of the previous Labor government and aimed to ensure that “all Australian school students acquire the knowledge and skills to participate effectively in society and employment in a globalised economy”. The Report considers the progress of the policy frameworks to see “whether these outcomes have improved over the five years since the agreement was developed”. Some of the key findings are very disturbing and demand immediate policy action.
From COAG we learn that:
The Council of Australian Governments (COAG) established the COAG Reform Council as part of the arrangements for federal financial relations to assist COAG to drive its reform agenda. Independent of individual governments, we report directly to COAG on reforms of national significance that require cooperative action by Australian governments.
In other words, its brief is to report “on the performance of governments under National Agreements” and provide advice at various levels.
The Key Findings of the Report are:
1. “Participation in preschool is high and school outcomes in the early years are improving. Nationally, average scores improved in Years 3 and 5 in reading and in Year 5 in numeracy, but there were no improvements in Years 7 and 9. Australia is also performing behind top countries in these key areas.”
2. “Reading and numeracy improving in the primary years but not in secondary … there was little improvement in the proportion of students achieving the minimum standards.”
3. “Australia’s average scores for Year 4 and Year 8 students reached the intermediate benchmark in reading, maths and science. But the proportions at the advanced benchmark (around 10%) are well below the top performing countries, especially Singapore (24%-48%). In Year 4 science, Australia’s performance went backwards from 10% reaching the advanced benchmark in 2007 to 7% in 2011.”
4. “More young people attain Year 12 but fewer are fully engaged in work or study after school … The proportion of young people (17-24 year olds) fully engaged in work or study following school declined from 73.9% in 2006 to 72.7% in 2011. This was due to a fall in full-time employment which more than offset increases in the rate of young people who were studying full-time.”
5. “Indigenous children are more than twice as likely to start school developmentally vulnerable. There were no improvements in Indigenous school attendance over five years with decreases in some years. Indigenous students are much less likely to meet the minimum standards in reading and numeracy. In five years nationally, only Year 3 reading improved but Years 3 and 7 numeracy declined.”
6. “Outcomes for students from the lowest socio-economic backgrounds still poor … In 2011, after leaving school, 41.7% of young people from the lowest socio-economic backgrounds were not fully engaged in work or study, compared to 17.4% for young people from the highest socio- economic backgrounds. This gap widened between 2006 and 2011.”
So on all fronts, the schooling system in Australia is creating and entrenching disadvantage and reinforcing class boundaries.
The Report clearly highlights that significant numbers of young Australians are failing to reach international standards. The failure extends into poor school-to-work transitions.
The disadvantage that this dysfunctional schooling system creates then remains throughout the person’s adult life.
The report finds that more than 27% of Australian youth (17-24 year olds) are neither in full-time study or employment. Where are they? Out there, alienated, socially excluded, and failing to gain the skills and experiences that will increase their chances of a prosperous (broadly defined) future.
This failure is the result of an under-performing Australian labour market.
Since February 2008 (the low point unemployment month of the last cycle), our youth have lost out dramatically in the labour market as the government has obsessively pursued a budget surplus.
Sure enough, in 2008-09, the Federal government saved the economy from a major recession by introducing a massive fiscal stimulus. But it then succumbed to the manic pressure from the conservatives to cut the deficit, and as a result of the fiscal contraction that followed, employment growth overall has been near zero since 2011.
But for teenagers, in particular, the outcomes have been nothing short of disastrous.
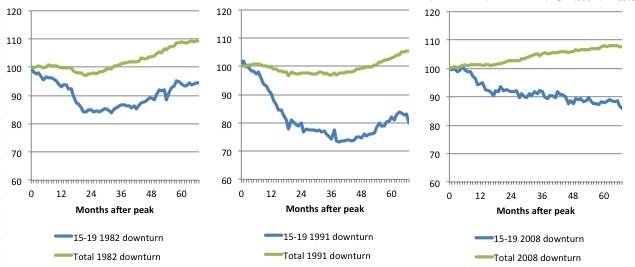
The following graph compares the behaviour of employment in total and teenage (15-19) employment over the last three recessions (1982, 1991 and current period).
The graphs are indexes, where the base period in each case is the low-point unemployment rate for each of the cycles in question (June 1981, December 1989 and February 2008). The indexes then track the evolution of each series for 68 months (which coincides with months since February 2008 to September 2013). The vertical scales are common to aid visual comparison.
Several points are worth noting:
1. Teenagers experience much sharper cuts in their employment in percentage terms than the rest of the workforce when the economy moves into recession. This relates to the fact that they are cheaper to sack then more experienced workers.
2. The 1991 downturn was the most severe of the three recessions shown, and there is debate whether we should refer to the current episode as a recession given that real GDP did not contract for two successive quarters.
3. Teenage employment in the 1982 and 1991 recessions plummeted – but bottomed out after 21 months in 1982 (having fallen to an index number of 84.2, that is about 16 per cent contraction); and after 39 months in 1991 (having fallen to an index number of 73.1, that is about 27 per cent contraction. In the current episode the index number currently stands at 85.7 (14.3 per cent contraction) but, after 68 months the contraction continues.
4. While the contraction in the current episode was less severe than the previous two recessions, this should be seen in the context of the massive fiscal stimulus there was provided in 2008-09, which is evident in the behaviour of total employment.
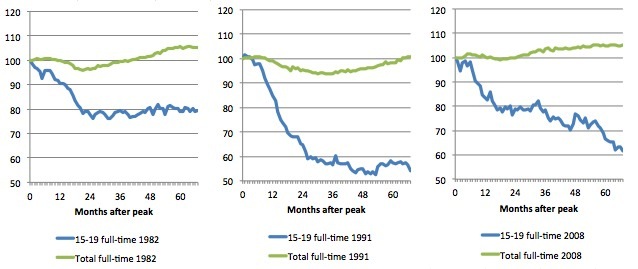
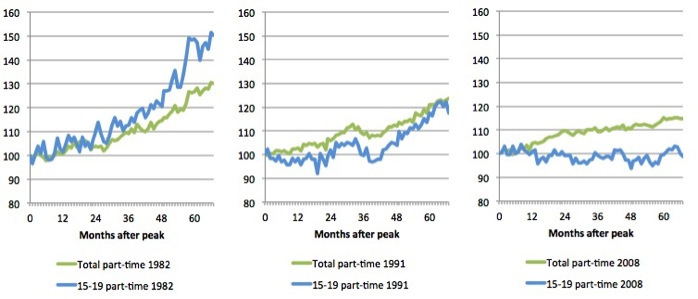
The next graphs compares the behaviour of full-time employment in total and teenage (15-19) employment in the top panel and part-time employment in total and teenage (15-19) employment (bottom panel) over the last three recessions (1982, 1991 and current period). As before the graphs are indexes (see above for details).
You might also want to move your eyes back and forth between the panels to form a coherent view of what happens during a recession.
Full-time Employment Indexes, Australia

Part-time Employment Indexes, Australia

First, during recessions a marked switch from full-time work to part-time work occurs resulting in a greater proportion of workers in short-duration jobs (this is accentuated for males).
It is also clear there is a disproportionate impact on teenage full-time employment, a fact replicated across the three cycles shown. The 1991 recession was very severe in terms of full-time employment for both cohorts, but particularly so for teenagers.
Second, full-time employment declines almost lockstep with the turn in GDP and persists before weak recovery begins. Part-time work, however, continues to increase as GDP moves from peak to trough, until it also succumbs to the effects of demand deficiency. In the recovery phase, the economy initially generates strong growth in part-time work.
The experience of the current episode is, however, different as a consequence of the massive fiscal stimulus. Full-time employment did fall but certainly not by as much in percentage terms as in the previous two recessions. But note the behaviour of teenagers in the current episode.
Teenage full-time employment has fallen from 274.8 thousand in February 2008 to its current level of 169.1 thousand (September 2013), a dramatic decline of 105.5 thousand or 38.4 per cent.
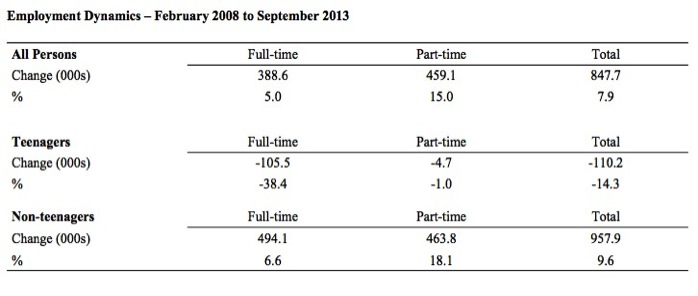
If we consider the fact that this was a time when total employment was growing (see next Table), the current experience of teenagers in the labour market is dismal.
The following Table captures the shifts since February 2008 in full-time and part-time employment (absolute and percentage changes) for All Persons, Teenagers and Non-Teenagers.
The contraction in employment for 15-19 year olds is unprecedented and represents a total failure of government policy structures.
Third, during a recession and subsequent recovery, part-time employment recovers more quickly (and in the early part of the recovery rises rapidly before stabilising at the higher level with the underlying trend towards increased part-time work then reasserting itself).
In the past recessions, part-time employment opportunities have grown for teenagers in line with the rest of the labour force. However, in the current episode, not even the traditional source of jobs has grown at all (declining overall by 1 per cent).
Conclusion
The Report finds that our schooling system in Australia is failing our younger cohorts. The disadvantage that it spawns falls disproportionately on lower socio-economic cohorts including indigenous children.
Then the children have to face up to an appalling labour market situation, deliberately created by the failed policies of the federal government, which have starved the economy of jobs growth in the obsessive (and failed) pursuit of a budget surplus.
Overall, the performance of the teenage labour market is close to disastrous. It doesn’t rate much priority in the policy debate, which is surprising given that this is our future workforce in an ageing population. Future productivity growth will determine whether the ageing population enjoys a higher standard of living than now or goes backwards.
The longer-run consequences of this teenage “lock out” will be very damaging.
The problem is that in the modest growth period that the Australian labour market enjoyed as a result of the fiscal stimulus and mining investment, teenagers failed to participate in the gains – they went backwards.
Now, with the economy entering a new period of slowdown, these losses will be added too given that teenagers are among the first in line to be shown the door by employers seeking to reduce staff levels in the face of declining aggregate sales.
The previous Government’s response was to push this cohort into endless training initiatives (supply-side approach) without significant benefits. The research shows overwhelmingly that job-specific skills development should be done within a paid-work environment.
I would recommend that the new Australian government immediately announce a major public sector job creation program aimed at employing all the unemployed 15-19 year olds, who are not in full-time education or a credible apprenticeship program.
It is clear that the Australian labour market continues to fail our 15-19 year olds. At a time when we keep emphasising the future challenges facing the nation in terms of an ageing population and rising dependency ratios the economy still fails to provide enough work (and on-the-job experience) for our teenagers who are our future workforce.
The way we are wasting our children and young adults is beyond madness! Neo-liberal ideology has run amok!
One can only hope that in the coming decades, when a growing criminal cohort are created out of this disadvantage, that the costs of the resulting crimes fall disproportionately on the demographic groups (particularly the top-end-of-town) who have goaded successive governments to cut welfare and educational spending, eschew public employment programs, and demonise the unemployed.
Minor digression
There was a recent Inside Story Op Ed – A mess? A shambles? A disaster? – written by Rodney Tiffen, which sought to provide some reason and balance to the discussion surrounding the previous Federal government’s homeinsulation scheme – a centrepiece of the fiscal stimulus in 2008.
The program was decried as a total “a mess. A shambles. A disaster” by prominent political commentators and the media frenzy of hatred towards the scheme peaked when we learned that “four workers had died while installing insulation and that there had been ninety-four house fires related to insulation.”
The then Opposition leader (now Prime Minister) said that the scheme was “the most monumentally bungled government program in Australia’s history”.
I will leave it to you to read the article. It shows how a debate can be framed in a particular ideological way to totally distort what happened. We were led to believe this was a massive government failure when in fact the negative aspects of the programme revealed more about the dishonesty, unscrupulousness and incompetence which is rife at the level of small business in Australia.
The programme was introduced in early 2008 when it looked like the global financial crisis was going to have devastating consequences for the Australian economy. It was considered that the intervention had to be substantial and rapid, or prudent parts of any fiscal intervention when private demand is falling quickly.
It was accompanied by a school building programme and other stimulus measures, including cash handouts (the latter being provided in late 2008 to stimulate Xmas shopping).
The plan was to install home insulation across Australia, which combined the government’s “green agenda” with the need for a large-scale stimulus.
As Rodney Tiffen writes:
The Rudd government’s scheme was unprecedented in its scope, aiming to insulate two million homes in two and a half years at a cost of $2.45 billion.
The energy savings alone were estimated to be massive – “putting ceiling insulation in 2.2 million homes would save as much energy as taking a million cars off the road”.
In March 2010, I wrote that it is possible that some parts of the stimulus intervention (a relatively minor proportion of total funds spent) were problematic in terms of administrative issues. There has been a major beat up about this program in the media but the facts are in dispute. I would conclude it wasn’t a very good program but the facts that are available are very blurred.
But the point was that large-scale stimulus interventions of the type taken by the Australian Government – which in international terms was early and large relative to GDP – are very complicated and you can expect some administrative inefficiencies. Imagine if the private sector had to ramp up investment spending to that scale within a quarter or so – what do you think would be the outcome of those projects.
I also indicated that the neo-liberal era has been marked by a major reduction in Departmental capacity to design and implement fiscal policy – given the obsession with monetary policy and the major outsourcing of “fiscal-type” government services to the private sector. Many of the major Federal government policy departments are now just contract managers for outsourced service delivery. So with the voluntary reduction in “fiscal space”within the federal government over the last 20 years or more it is no surprise that the overall capacity of the government machine to implement efficiently and speedily complicated nation-wide infrastructure programs has been diminished.
I also pointed out in the interview that while complex interventions will not be perfect in design or execution you have to consider what would have been the case if we had have followed the Chicago school (or the Harvard school) line – and left it to the private market to sort the mess out. It is clear to me that we were facing a repeat of the Great Depression such was the damage to the financial system and the plunge in real output in the major economies.
Finally, the Australian downturn was less severe than we thought at the time of the intervention. It is easy to look back with the benefit of the 20-20 vision and say that in some areas too stimulus was provided.
The major point is that at the time the stimulus packages were designed and announced, the Government believed we were on the precipice of another Great Depression. The international events demonstrate that the crisis has been very severe. So the government rightly assumed that there would be major idle labour skills available to be brought back into productive work. That was a reasonable assumption and the fact that the downturn hasn’t been as bad as that demonstrates that the fiscal stimulus has been very effective.
However, I would have concentrated the stimulus on efforts to provide public sector jobs to the most disadvantaged workers who bear the brunt of unemployment and underemployment. They are still idle and without sufficient income. It would have delivered much more to the economy than competing for tradespersons with other “private” demands for those services, however, weak they were at the outset of the crisis.
There are also proposed so-called progressives who who still claim today that the programme was a disaster and should have been delegated to the state governments to run. These arguments are essentially spurious because they failed to understand that the essence of a large-scale fiscal stimulus is size and speed of implementation.
Proponents of this view clearly have no direct experience of the way in which large-scale public programs are designed and executed.
Given the highly politicised federal-state relations in Australia and the fact that, at the time, there were particular state governments of the opposite political persuasion to the federal government posturing about all sorts of matters, it would have been nigh on impossible to implement a programme of the necessary size and timing that was required.
A long flight coming up – to calm me down!
That is enough for today!
(c) Copyright 2013 Bill Mitchell. All Rights Reserved.


The senselessly hysterical braying of the MSM over the HIP drowned out all measured discussion seeking the facts and additionally, a crucial piece of contextual information necessary for the public to gain even a basic understanding of the issue was – deliberately IMO – left out of the narrative: the fact that we were witnessing not a wide-scale mass disaster in a somewhat elevated number of jobs but rather, about 15 years worth of work being completed in the space of 12 months. Therefore, the number of incidents which the public does not normally notice since they are spread out over a decade-and-a-half was much more noticeable in such a short span of time, especially when screeched from the rooftops by the media.
I have no doubt that there were problems with such a hastily put together programme but to describe it as the unmitigated disaster – of which it has now become entrenched in our popular folklore as – is clearly an outright fiction.
Not satisfied with jeapordising the prevention of recession by halting that flow of spending, they then moved on to the school building programme. As someone who works within the state school system – at least until Mr Newman says I have to go, which is very likely on the cards – I can say that wild claims in the media of massive and widespread structural and safety failures are just that: confected nonsense. I haven’t personally seen a bad job yet, nor spoken to anyone within the system who has.
Hi Bill,
You should double check the labels on your graphs; you’ve got the colours the wrong way round for many of them and you have labelled 2008 as 1991 on the part-time employment graph.
Otherwise great post.
Prof. Mitchell,
Have the labels on the charts been switched? It looks like the blue lines should be the teenagers to me.
Best regards,
Will
Dear Andrew and Will
Thanks very much. I was rushing today to catch a flight and speed became errors.
Fixed now.
best wishes
bill
And,of course,the whole miserable recession/depression episode will be repeated in the not too distant future because absolutely zero has been done about addressing the causes.
Hi Professor,
“So with the voluntary reduction in “fiscal space”within the federal government over the last 20 years or more it is no surprise that the overall capacity of the government machine to implement efficiently and speedily complicated nation-wide infrastructure programs has been diminished.”
This reduction is achieved by the application of the “efficiency” dividend. Its a wonder government departments are able to effectively monitor these programs at all.
bob