I started my undergraduate studies in economics in the late 1970s after starting out as…
The term fiscal stimulus” has been expunged from the public debate
Australia is in the final stages of a federal election campaign and it is likely that the conservatives will be returned to power after being out of office for eight years. The current government, allegedly non-conservative, is so close in most respects to the conservatives that it is hard to distinguish between the two. One significant point of difference over the last several years relates to the effectiveness of the fiscal stimulus that the current government introduced in late 2008 to attenuate the consequences of the global financial crisis. The conservative opposition claimed they would not have allowed the budget to move back into deficit during this period. Given the scale of the crisis, they would have had no choice anyone because the cyclical impacts via lost tax revenue would have been sufficient to drive the budget into deficit irrespective of the discretionary stimulus packages that were introduced in stages by the current government. Both major parties are obsessed with pursuing budget surpluses without the slightest recognition that in current circumstances such a policy orientation is destructive to growth and employment. I was examining some data relating to the construction industry today for another project, which demonstrates why the introduction of the 2008-09 fiscal stimulus packages were extremely effective in reducing the output and employment losses that might otherwise have occurred. The future under a surplus-obsessed conservative government for workers looks rather bleak. Here is some evidence.
There has been long-held interest among economists, starting with the work of Wesley Mitchell and Arthur Burns.
Mitchell first published his book – Business Cycles in 1913 (University of California PRess).
In 1946, he published with Burns – Measuring Business Cycles (National Bureau of Economic Research) – which defined the way the NBER analysed business cycles – the methods are still used today.
Mitchell was an institutionalist and eschewed the free market approach to economic theory.
As an aside, Wesley Mitchell was the director of research at the NBER and influenced a progressive research agenda, with an emphasis on institutional and historical context being as important as the more narrow concerns that neo-classical economics concerns itself with.
It is interesting to compare his period with the NBER and what happened to it in more recent, three-decade period under the directorship if Martin Feldstein. How an institution was wrecked by free market dogma!
If you examine the research and publication agenda of the NBER you will appreciate that under Feldstein’s direction various mainstream economic policies were promoted – including his obsession with privatising the US pension and the health systems.
I reported on Feldstein’s tenure at the NBER in this blog – Martin Feldstein should be ignored.
Arthur Burns was also a noted institutionalist and and his first major book – Production Trends in the United States Since 1870 – was published in 1934. He later became the Chairman of the US Federal Reserve during Nixon’s ill-fated tenure as President and was often in conflict with the political administration.
Notably, he refused to accept the growing conservative putsch that monetary policy should be so restrictive as to drive up unemployment to defend an artificially low inflation target.
He is notable otherwise for being the senior professor at Columbia University who rejected the Phd thesis submission by rabid libertarian Murray Rothbard. The thesis was only accepted for the award when Burns left Columbia to take up the role of head of the Council of Economic Advisors.
Anyway, a digression as a result of re-reading some of this early literature over the last day or so.
In Australia, the first fiscal stimulus package (October 2008 – the Economic Security Strategy) mainly consisted of cash handouts to pensioners and families. There was an extension to the First homeOwner Grant Boost and some training places offered.
However, the second package (the Nation Building Package) focused on infrastructure development. This was followed in February 2009, as the recession looked like deepening with the $A41.5 billion (that is, economically significant with respect to GDP) allocated to the Nation Building and Jobs Plan.
While there were further cash handouts the bulk of the proposed spending was focused on the construction sector (educational infrastructure development, social and defense housing and the home insulation scheme.
The early cash payments timed initially to coincide with the Xmas spending rush in December 2008 were designed to put increased purchasing power into the hands of those who would spend it quickly. The evidence supports the argument that this occurred.
The infrastructure spending was concentrated on schools and there were several arguments mounted to support this part of the stimulus plan.
First, there are schools in every locality – where people live and work. Second, the construction industry is big with about 1 million workers and it always contracts severely in a recession. Third, construction in schools could be implemented without delay (land availability, less applicable local planning regulations). Fourth, the specific building plans could be used throughout the nation.
This part of the fiscal stimulus was thus designed to support an industry that typically contracts early and significantly in any economic downturn.
A further $A$22.5 billion was announced in the May 2009 budget for the Nation Building Infrastructure program.
It was clear that private construction was in decline but the stimulus packages (specifically the school hall packages) was kick starting the overall construction industry and preserving employment in that sector.
What does the data tell us about this period?
The Australian Bureau of Statistics released the latest – Construction Work Done, Australia, Preliminary, Jun 2013 – data series today, which provides estimates of the state of the construction industry in Australia.
Construction is an interesting industry because it has long been identified as being very cyclically-sensitive. When real GDP growth declines, construction is one of the industries that goes into free fall.
In August 2010, I considered this issue in the blog – Fiscal stimulus and the construction sector.
Today, I am updating that analysis based on the most recent data.
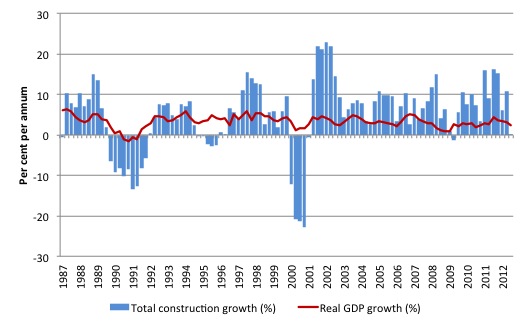
The first graph is taken from the Construction Work Done, Australia, Preliminary, Jun 2013 data released today and ABS National Accounts data and shows the annual growth in Total Construction (blue bars) and real GDP (red line) from September 1987 to March 2013. This sample corresponds with the revised seasonally adjusted data available from the ABS.
The period captures the 1991 and early 2001 downturns and the recent downturn. Note that by taking annual changes we attenuate the cyclical effects. The 1991 recession was the only “official” recession during this period. The 1982 recession was also severe but the construction data doesn’t include that period.
It is clear in the 1991 and 2001 downturn total construction fell in line with real GDP contractions. But the pattern was broken in the recent downturn.
The construction sector actually boomed on the back of the fiscal stimulus even as real GDP growth moved towards the zero line as private spending growth fell dramatically.
The next graph shows the recent period is more detail – starting in March 2007. The data is now in index number form (March 2007 = 100) and thus shows the quarterly growth movements.
The one quarter contraction in real GDP that occurred in the December-quarter 2008 at the time the first of the stimulus packages was introduced.
After that the surge in public spending, concentrated on funding infrastructure and hence directly boosting the construction sector, not only meant the decline in that sector was short-lived but also that positive real GDP growth returned in the first quarter of 2009.
The behaviour of the private sector construction was normal – that is, growth collapsed quickly as the economic downturn emerged. Had the public sector construction activity not boomed, the overall construction sector would have entered a severe recession and it is certain that the overall economy would have become bogged down in a lengthy recession – 1991-style.
Some might argue that the easing of monetary policy also was important. The Treasury subsequently estimated that it was very minor compared to the fiscal impact.
The next graph compiles butterfly plots for total construction, public construction and private construction for the 1991 and 2009 downturns.
Butterfly graphs are very useful for examining the symmetry of the cycle (or lack of it) – before and after the peak (or trough) of the cycle.
They are volume indexes set at 100 for the peak in total activity in the 1991 and 2009 downturns. They show the four quarters before the peak and the 21 quarters after the peak for each recession.
The behaviour of this important recession bell-weather sector was starkly different in the period supported by the stimulus. In 1991, the Federal government refused to engage in a fiscal stimulus until it was too late. By the time there was any fiscal expansion introduced the private sector confidence had collapsed and unemployment was spiralling above 10 per cent.
This time largely as a result of the early fiscal stimulus which was targetted on the construction sector the situation was very different.
The contraction in private construction was smaller and the industry overall served to bolster real GDP growth.
Construction Employment Impacts of the Stimulus
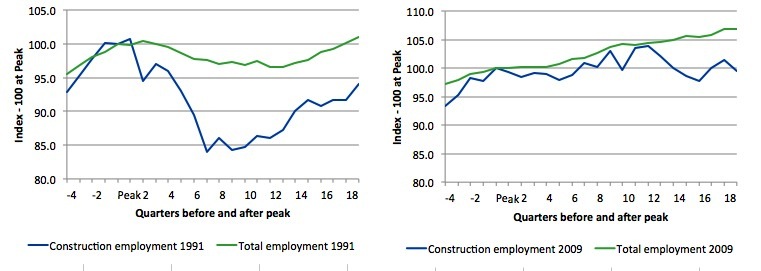
The following butterfly plots show what happened to construction industry employment relative to employment overall.
The graphs are constructed from ABS Labour Force by Industry data. They are employment indexes set at 100 for the peak in total employment in the 1991 (left-panel) and 2009 (right-panel) downturns. They show the four quarters before the peak and the 19 quarters after the peak for both recessions (currently to May 2013 being the latest quarterly industry employment data available).
They provide a very good picture of the different fortunes encountered by total employment and employment in the construction industry during the respective downturns.
The 1991 recession displayed typical behaviour and a reluctance by the federal government of the day to engage an early and significant fiscal stimulus. The willingness of the Australian government in 2008 to introduce a substantial fiscal intervention sets the two periods apart.
It is clear that the construction industry and total employment in the current period behaved very differently to the 1991 episode.
Construction in the US and Australia
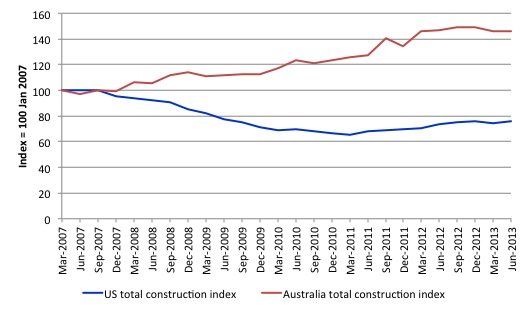
The following graph compares the fortunes of the construction sector in Australia and the US from the first quarter 2007 to the June 2010 quarter. The US data comes from the US Census Bureau. The lines are indexes set at 100 in the first quarter 2007.
The graph provides some of the explanation as to why the Australian economy has been less severely affected by the recession. The differences have been driven by the different focus and scope of the respective fiscal interventions.
The US government certainly did not target the construction sector, which subsequently contracted sharply and is still well below the March 2007 levels of activity.
Conclusion
In all the hoopla about the severity of our so-called budget deficit crisis that both sides of politics in Australia are promoting, the evidence seems to be lost.
In the same way, that the conservatives appear to be concentrated among the climate change deniers, they are also in denial about the massive benefits that the fiscal stimulus in 2008-09 provided to the Australian economy.
The problem is that both sides of politics have adopted conservative economic positions. Both the major parties are touting their economic credentials on the basis of how quickly they will get the deficit is eliminated.
So blinkered is the debate, that the current government, which is almost certain to lose office the following Saturday, has barely mentioned the fact that it was responsible for saving the Australian economy from the same fate that befell the other advanced economies on the back of collapsing private spending and excessively timid fiscal responses from the relevant national governments.
It is almost as if the word fiscal stimulus has been expunged from public use. I’m sure the construction industry workers and the major firms in the industry realise that without the public stimulus their lot would be considerably worse than is the case today.
That is enough for today!
(c) Copyright 2013 Bill Mitchell. All Rights Reserved.


Your conclusion is not quite accurate Bill. During the televised “debate” between Rudd and Abbott this evening, Rudd made much of the role of the government in saving the Australian economy in 2008-9 via its fiscal stimulus program. Also I have an excellent recollection of Rudd and other ministers mentioning the matter – several times – during the election campaign.
I do not know the Australian context very well, so cannot comment. But here is a link to a discussion by Glenn Greenwald comparing Obama, the candidate, with Obama, the president. If you didn’t know better, you would be forgiven for thinking that the utterances were from two quite different people, as one set of utterances completely contradicts the other.
http://www.theguardian.com/commentisfree/2013/aug/28/ongoing-nsa-work
Canada’s conservative majority targeted stimulus directly at public infrastructure and home improvements if memory serves correctly.
They continue to talk about deficit elimination by 2015 (election time) despite still high levels of un/underemployment.
It’s infuriating how national debt mythology gets used as a political tool by all parties still.
Bill,don’t be so quick to write off the present government. I know the polls are predicting a ? narrow win for the Liberals. But there is only one poll that counts and that is the one on September 7.
It took 10 long years to get rid of Howard in 2007. Heaven help us if we end up with a bunch of Howard retreads on 7/09/13.Some of the insane policies that the Tories are coming up with beggar the imagination. I am no ALP supporter but I’m hoping that Rudd can pull off a Keating/1993 as the lesser of two evils.
Any port in a storm.
Umm .. Podargus, with little more than one week to go, the polls are currently predicting a net loss of 12 government-held HoR seats. If that prediction became reality, it would translate into a majority for the opposition party of more than 20 seats in the lower house … a sizeable majority by any standards.