I am travelling today to Tokyo and have little time to write here. But with…
Australian national accounts – oh, the irony
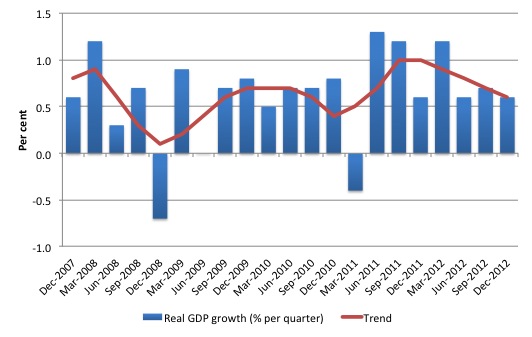
The Australian economy grew in trend terms by 1 per cent in the December-quarter 2011, 0.9 per cent in the March-quarter 2012, 0.8 per cent in the June-quarter 2012, 0.7 per cent in the September-quarter 2012, and in today’s Australian Bureau of Statistics – Australian National Accounts – data covering the December-quarter 2012, the real GDP growth figure was 0.6 per cent. Further, the two main growth drivers in the December-quarter – Net exports (0.6 percentage points) and Public Investment (1.1 percentage points) – will not endure. Outlook: poor. But the irony is that while the Federal government is doing its best to undermine the economy by imposing fiscal austerity, it was the public corporations at the State/Local government level that provided the public capital infrastructure boost. Without this government spending support, the Australian economy would be in a deepening recession! I wonder what those who say that public spending undermines growth would say today! Gravity denial would be out in full force. I will keep my ears peeled and report back on the more ingenious contributions. While the spin is that the economy grew at 3 per cent over 2012, which is true, the forward-looking assessment is that the national growth rate is running around 2 to 2.5 per cent and falling, which is already well below trend. Employment growth was flat and real net national disposable income fell sharply in the December-quarter. The terms of trade, which has been helping to drive growth in the external sector also fell sharply. The State and Territory Final Demand data also shows that the East Coast and South Australia area, where the vast majority of the population lives and seeks work is now in recession. The outlook is decidedly negative.
The main features of today’s National Accounts release for the December 2012 quarter were (seasonally adjusted):
- Real GDP increased by 0.6 per cent after recording a 0.7 per cent increase in the September-quarter (revised upwards from 0.5 per cent).
- The main positive contributors to expenditure on GDP were Total public gross fixed capital formation (1.1 percentage points) up from , and Net exports (0.6 percentage points).
- The main negative factors were the sharp contraction in private capital expenditure (-0.9 percentage points) and a run-down in inventories (-0.4 percentage points).
- Our Terms of Trade (seasonally adjusted) continued to fall (-2.7 per cent. Over the year to December 2012, the Terms of Trade have fallen by 12.9 per cent and that trend is the reason that forward-looking estimates of private investment (mining related) is looking very subdued in 2013 and into 2014.
- Real net national disposable income, which is a broader measure of change in national economic well-being fell by 0.1 per cent in the December-quarter but rose by 0.3 per cent over the year to December 2012. In other words, we are now going backwards in real terms after, largely, marking time in 2012.
The ABC News report – GDP shows Australian economy ‘okay overall’ – noted that “the economy’s output rose 0.6 per cent over the final three months of last year, bringing economic growth for 2012 to 3.1 per cent”, which might be a good thing to know historically but not very useful as a guide to where we are heading.
More pertinent was this comment in the ABC report:
The December quarter pace of growth was less impressive, with a 0.6 per cent rise implying an annual economic expansion of 2.4 per cent if it does not improve over coming quarters.
The reality is that net exports contributed 0.6 per cent to growth in the December quarter on the back of improved commodity prices. But that “surge in coal and iron ore exports” has gone and the March-quarter 2013 will show a dip in net exports.
The Sydney Morning Herald report’s headline – Public spending drives economic growth – captured the irony of the current situation.
As we will see, the public investment contribution (all from State/Local government public corporations) added 1.1 per cent to real GDP growth. That is an abnormally high number and once the details are made public will probably reflect a large, lumpy investment in infrastructure. That is, it will be unlikely to appear again next quarter.
Without the contribution from the State and Local Government investment expenditure, real GDP growth would have been -0.5 per cent in the December-quarter. That should concentrate minds in Canberra. The Federal government (in Canberra) is contributing nothing to growth now and is running policy settings that are biased to making a negative contribution.
There is an urgent need for a stronger Federal government contribution to economic growth.
Overall growth picture – continuing to trend down
The following graph shows the quarterly percentage growth in real GDP over the last five years to the December-quarter 2012 (blue columns) and the ABS trend series (red line) superimposed. After the decline in trend growth was arrested by the fiscal stimulus in 2008-09 the decline in government support saw the dip in trend growth in 2010.
Initially, the growth in private investment associated with the record terms of trade and the resulting mining boom has helped drive the new rise in trend growth and that appears to have ended in the December-quarter 2011.
The average quarterly real GDP growth over the last year is 0.8 per cent (trend 0.8 per cent). Today’s data indicate that over the last year the Australian economy grew by a strong 3.1 per cent although that is dominated by the strong growth in the March-quarter 2012 (1.2 per cent) following the a surge in private investment spending.
In the June-quarter 2012, real GDP growth fell to 0.6 per cent; then was 0.7 per cent in the September-quarter 2012, dropping to 0.6 per cent in the December-quarter.
Trend growth has been declining for the last four quarters of published data, notwithstanding the March-quarter surge.
Real GDP growth and hours worked
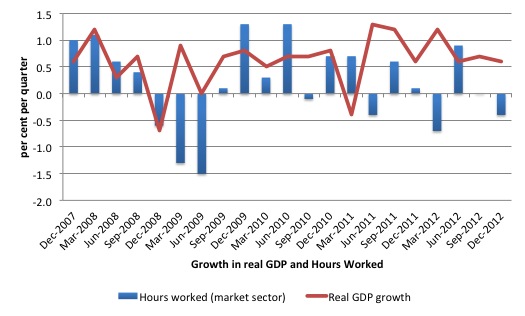
One of the puzzles over the last two years or so has been the sharp dislocation between what is happening in the labour market and what the National Accounts data has been telling us.
Employment growth and hours worked has been virtually flat over the period while reaL GDP growth has been well over 2 per cent per annum. Today’s data suggests dislocation is continuing. Even though growth is slowing, it remains around the 2 per cent per annum mark (at least). But there is no employment dividend of any significant amount forthcoming.
The following graph presents quarterly growth rates in trend GDP and hours worked using the National Accounts data for the last five years to the December-quarter 2012.
You can see the major dislocation between the two measures that appeared in the middle of last year has persisted into 2012. Hours worked increased in the June-quarter more in line with what we would expect but have collapsed again and the situation is worsening.
Just in case you think the labour force data is suspect, the hours worked computed from that data is very similar to that computed from the National Accounts.
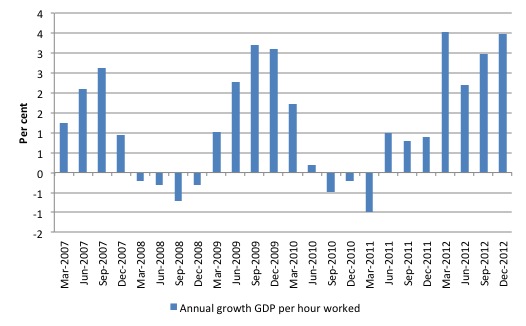
To see the above graph from a different perspective, the next graph shows the annual growth in GDP per hour worked (so a measure of labour productivity) from the March 2007 quarter to the December-quarter 2012. The relatively strong growth in labour productivity helps explain why employment growth has been lagging given the real GDP growth. Growth in labour productivity means that for each output level less labour is required.
Contributions to growth
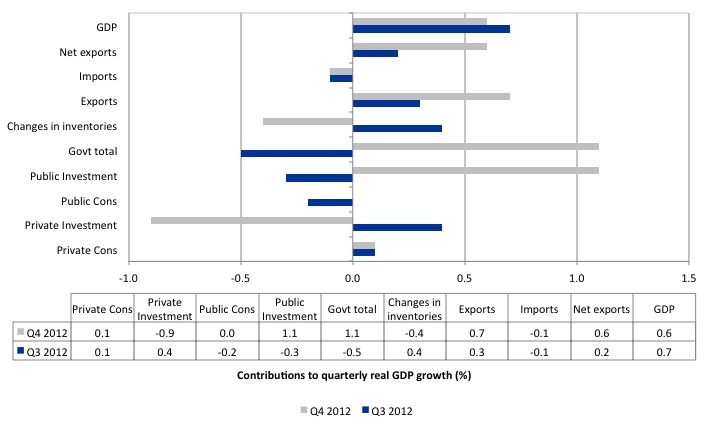
What components of expenditure added to and subtracted from real GDP growth in the December-quarter 2012?
The following bar graph shows the contributions to real GDP growth (in percentage points) for the main expenditure categories. It compares the December-quarter 2012 contributions (grey bars) with the September-quarter 2012 (blue bars).
First, note that without the massive spike in public investment (all within State and Local government Public corporations), real GDP growth would have been -0.5 per cent in the December-quarter. So while net exports contributed 0.6 percentage points to the 0.6 per cent quarterly real GDP growth rate, that non-government sector contribution is dwarfed by the government sector input.
Second, private consumption is essential weak and flat.
Third, the turnaround in private investment is notable. Last quarter, the contribution was 0.4 percentage points, whereas in the December-quarter it was -0.9 percentage points. This is likely to be a combination of timing issues (with lumpy investments) and the more worrying fact that with the Terms of Trade now diving (12.9 per cent fall in seasonally adjusted terms in the 12 months to December 2012) the mining investment cycle is over.
The latest ABS data on investment intentions confirmed that the coming quarters will see a slowing contribution to real GDP growth from private capital formation.
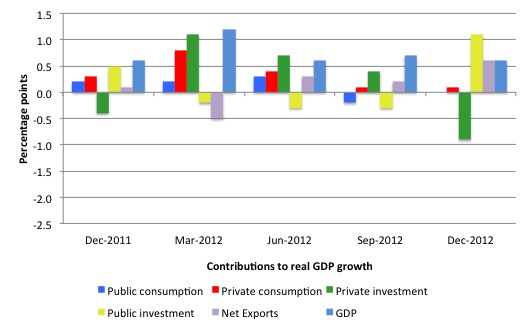
I prepared another graph showing the contributions to real GDP growth of the major expenditure aggregates since December-quarter 2011 (in percentage points). The total real GDP growth (in per cent) is also included as a reference.
The data suggests that household consumption (and public consumption) is weak and getting weaker. The private investment boom associated with the mining sector is also in decline as the record terms of trade moderates.
Net exports are now making a contribution to growth but with the growth in the Chinese economy likely to be moderate, notwithstanding the decision yesterday by the Chinese government to ramp up their budget deficit to ensure growth doesn’t decline too far, the volume gains in exports will soften in the coming year.
The stand-out result is the contribution of public capital formation. This contribution came from the State and Local government public corporations. The Federal government contribution to growth overall was zero (at least it was not negative).
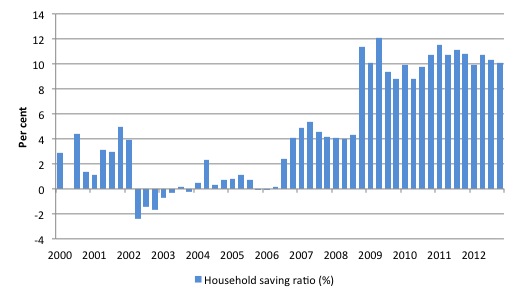
Household saving ratio steady around 10.1 per cent
The following graph shows the household saving ratio (% of disposable income) from 2000 to the current period. The household sector is now behaving very differently since the GFC rendered its balance sheet very precarious. Prior to the crisis, households maintained very robust spending (including housing) by accumulating record levels of debt. As the crisis hit, it was only because the central bank reduced interest rates quickly, that there were not mass bankruptcies.
The household saving ratio is now steady around 10.1 per cent of disposable household income.
For the economy to continue to grow strongly while households are maintaining this higher levels of saving (from disposable income), public spending, private investment and/or net exports has to increase.
Clearly, the contribution from private investment is now fading (and was negative in the December quarter) and the net exports contribution in the current quarter while strong will not endure given the movements in the terms of trade.
Which means that continued growth will require a much stronger contribution from the government sector. The 1.1 per cent contribution from the State and Local government public corporations is an outlier and will not endure.
The problem is that if incomes start to drop and the households continue to pursue this saving proportion aggregate demand will decline even further. What the Government fails to understand is that the household sector is now carrying record levels of debt as a result of the credit binge leading up to the crisis and we are unlikely to see a return to the low saving ratios that were evident in the period 2000 to 2005.
That means that government surpluses which were associated with the credit binge, and only were made possible by the unsustainable credit binge are untenable in this new (old) climate. The Government needs to learn about these macroeconomic connections.
A return to higher saving ratios is surely signalling a need for a return to more or less continuous budget deficits, depending on what happens to the external sector.
Regional growth disparities have opened up
In media interviews over the last 6-9 months I have been saying the “East Coast” of Australia is either in or close to recession and it is only the mining states of Western Australia and the Northern Territory, which are keeping Australia in the positive real GDP growth range.
The record terms of trade that Australia has enjoyed in recent years (since around 2005) has promoted exchange rate appreciation. Since early 2001, the Australian dollar has fluctuated significantly. In March 2001, the Trade-Weighted Index was 47.4. By June 2008, it had risen to 73.4 (a 55 per cent increase). Then it plunged to 53.2 six months later (a drop of 28 per cent), only to rise again on the rebound in commodity prices to 79.2 (a 49 per cent rise). Similar movements against the major currencies also occurred. It is now over parity with the US dollar.
However, the commodity prices for non-base metals have not enjoyed the same increases as for the mining commodities. This suggests a classic “Dutch Disease” situation. In the Australian context, the concept typically applies to the impact of a resources boom on the Australian dollar.
The appreciating currency then: (a) damages the competitiveness of ‘import-competing’ sectors (dominated by manufacturing, service and agricultural firms) because import prices fall relative to local cost levels; and (b) promotes wage pressures which further damage sectors who are not enjoying buoyant demand conditions.
A trend that has been emerging in Australia for several years, whereby some sectors (such as manufacturing) and regions (such as Sydney and Victoria) are struggling while other sectors (such as mining) and regions (such as Western Australia) are booming is consistent with these exchange rate dynamics.
These developments – popularised by the term ‘two-speed economy’ – whereby serious sectoral and regional imbalances accompany overall economic growth, challenge the fundamental patterns of our economic and social settlements and threaten the financial viability of many Australian households.
While the term ‘two-speed economy’ has taken on a number of meanings in different countries the imbalance of most interest here is the precariousness of the NSW (particularly, Sydney) and Victorian (Melbourne) economies relative to the prosperousness of the mining regions of Western Australia, Queensland and the Northern Territory.
Several coincident factors are driving the ‘two-speed’ economy some of which have not received much public attention (for example, the fiscal austerity that the national government imposed before the non-government sector had recovered from the 2008-09 slowdown.
This is a danger for any nation where exports are highly specialised and where the traded-goods sector is comprised of one dominant industry group. It is clear that mining has been growing at the expense of manufacturing and agriculture.
While the Australian Bureau of Statistics produces annual measures of Gross State Product, they also produce quarterly measures of State Final Demand (Australian National Accounts: State Accounts, cat. no. 5220.0). State Final Demand is thus the best estimate of economic activity available at the State/Territory level on an on-going basis (quarterly).
The ABS define State Final Demand as:
a measure of economic demand for products in the economy. It is an aggregate obtained by summing government final consumption expenditure, household final consumption expenditure, private gross fixed capital formation and the gross fixed capital formation of public corporations and general government. It is different from Gross State Product (GSP) as it excludes international and interstate trade as well as change in inventories.
What does the evidence tell us about the existence of a “two-speed” (or multi-speed economy)?
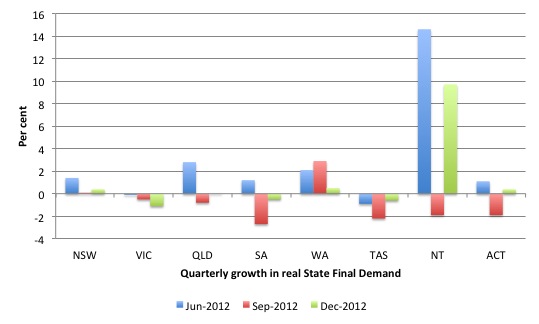
The following graph shows the quarterly growth in real State Final Demand for the last three quarters by State/Territory. It is clear that Victoria, South Australia and Tasmania are in recession (at least two consecutive quarters of negative output growth).
New South Wales is close to recession and Queensland avoided that classification by a whisker (zero growth in the December-quarter). Western Australia is also slowing now as the peak of the mining boom fades.
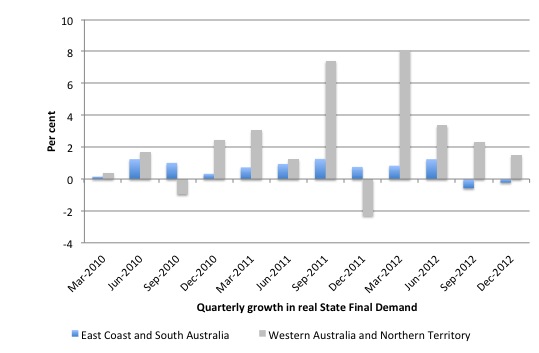
The next graph aggregates the States/Territories into two groups – East Coast plus South Australia and the two mining strongholds of Western Australia and the Northern Territory. I excluded the Australian Capital Territory because of the dominance of the public sector. Most of the Australian population are concentrated around the East Coast. Very few Australians live in Western Australia or the Northern Territory (although Perth, the capital of WA is a large city).
The data shows that the East Coast (Tasmania, Victoria, New South Wales, and Queensland) plus South Australia are now in recession as hypothesised.
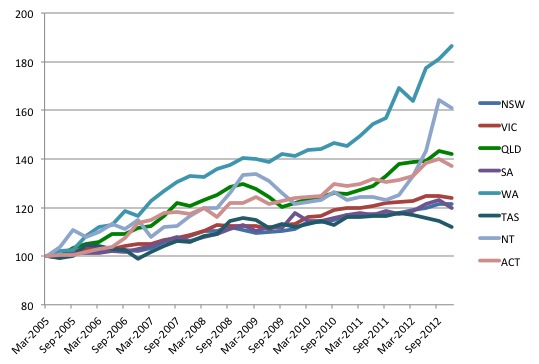
To give you some idea of the disparity in growth across States/Territories since the Mining boom began, the following graph indexes real State Final Demand from the March-quarter 2005 (base quarter). This was about the time the first phase of the commodity price boom started.
It is clear that the Western Australian economy has been the stand-out performer given its concentration of mining. The Northern Territory and Queensland (both who enjoy strong mining sectors) have also enjoyed similar prosperity although they both flattened out during the economic crisis.
As the nation’s capital and public service centre, the ACT has also enjoyed relatively strong growth in State Final Demand.
Contrast that to the manufacturing states of NSW, Victoria and South Australia and the smaller state of Tasmania. Their performance over the period has been modest at best and all are in recession or near recession now.
Conclusion
Today’s National Accounts data is now clearly indicating an economy that continues to slow. The aberration in lump State/Local government capital expenditure which saved the economy from a dire growth result in December will not persist.
Remember that the National Accounts tells us what was happening in 3-6 months ago. The most recent evidence suggests that net exports will not contribute as much to growth in the March-quarter as they did in the December-quarter.
Whether the sharp drop in private investment in the December-quarter spells the end of the investment cycle associated with the commodity price boom is questionable. Related data released last week suggests investment will remain strong throughout 2013.
But the terms of trade fell by around 13 per cent last year and the current evidence suggests they have fallen again in the first three months of 2013. That will stop the investment boom in the mining sector.
The blanket statement that Australia grew close to trend in 2012 not only obfuscates the fact that the current growth rate is well below trend and declining even further but also hides the fact that the majority of the population are living in regions which are in recession. That paints a totally different picture than the political spin coming from the Government.
I think today’s national accounts data paints a gloomy overall picture for the Australian economy.
Snake oil from the Business Lobby
Here is some snake-oil from the Business Council of Australia. The ABC News reported this morning (March 6, 2013) that – Business leaders question Labor’s fiscal strategy – the Business Council of Australia, the peak lobbying body for about 100 large businesses, has waded into the upcoming budget deliberations with some of its own special economic analysis.
The federal government is under pressure to fund a major upgrade of public education in Australia after a review found that we are lagging behind the advanced world in basic educational outcomes and the gap is widening. Our students are being left behind because successive federal and state governments have starved public education of funds in their mindless pursuit of budget surpluses.
The long-term consequences of the deterioration in our public education standards will be devastating in terms of lost national income. That is how powerful the neo-liberal mantra is. Staring us in the face every day are the losses from this policy travesty – persistently high unemployment and underemployment and failing productivity growth.
Yet despite it looming so large we cannot see it because we have been conditioned by the relentless media onslaught conducted by the conservatives to think that 12.5 per cent labour underutilisation rates are either full employment or the product of lazy no-hopers who will not work and need their income support withdrawn.
These two “stories” are pulled out of the hat on any given day depending on the context and who is making the pronouncement. But despite their inherent inconsistency and their factual inaccuracy we (the people) believe them – intuition is a bad thing sometimes.
The other area where government spending will be required is the “national disability scheme”, which finally recognises that we have allowed the lives of Australians with mental and physical disabilities to lag behind in quality terms because governments have refused to fund adequate services.
I did a study of the opportunities for youth with psychosis a few years ago and found that the private sector is not interested in employing these workers because they are in the “too hard” basket. They need some care and some specific job design but are very productive when they are able to work. We recommended public sector job guarantees for this workforce.
Anyway, with the economy growing well below trend despite the massive investment going on in mining the government’s revenue growth is well under the estimated growth. This is largely because the government is shooting itself in the foot by pursuing surpluses that are killing growth.
However, the expected surplus in the current year will not be realised as a result and the conservatives are going ape about the need for more disciplined spending to ensure fiscal policy reflects the reality of slowing revenue.
So we get these ridiculous analyses appearing from organisations like the Business Council and a host of “experts” come on national TV and radio or write articles in the media berating the government for over-spending.
We are below trend still caught in the downturn cycle where revenue growth is always lower than previously yet these idiots want spending to be cut to match the revenue so that surpluses can be achieved. It is hard imagining a worse understanding of macroeconomics than that sort of reasoning.
Australia is lucky the government has failed to achieve its surplus obsession because at least there is some net spending support for growth coming from the deficits. Things would have been much worse if they had cut spending growth even more than they had.
Of-course, the BCA has their own special version of this nonsense. Their CEO thinks the government will have a problem making “room” for the educational and disability spending and it has:
… started to commit to new expenditure which hasn’t been fully offset by either revenue or savings in other areas.
The CEO won’t actually say that these two large national imperatives are not worth pursuing. That would put them on the wrong side of national opinion, which is alarmed at the findings of the Gonski Review into public education standards.
The Business Council though reiterated that the government should aim for surpluses but please don’t touch any of the largesse that the top 100 companies enjoys from the Budget in the form of corporate welfare.
The CEO said:
If revenues are volatile, if spending has continued to increase and if it’s increasingly difficult to get back into surplus, don’t jump to raising revenue – making more ad hoc changes to the business concessional tax arrangements, and don’t make ad hoc changes to super …
That is, leave our hand-outs and the concessions to the highest income earners in the land alone. Cut elsewhere – like punish the unemployed, single mothers and the disabled even more!
Of-course, the ABC report didn’t challenge the underlying logic of the Business Council’s entreaty – that budget surpluses are required when the non-government sector is not spending enough to maintain growth in the face of increasing fiscal drag.
That is enough for today!
(c) Copyright 2013 Bill Mitchell. All Rights Reserved.
Bill, thanks for the analysis but I should point out that the spike in public investment and slump in pvt investment were two sides of the same coin. It came about simply because of the handover to the state govt of the god-forsaken desal plant in Victoria. Net impact on GDP is likely to be zero from that transaction. I suspect public investment will need to come to the rescue soon – let’s see the May budget.
Second point is that it is a little bit fraught to conclude that one or other state in is ‘technical’ recession from the final demand numbers as they they do not represent GSP. State-based final demands exclude changes in
inventories and exports both internationally and interstate. Fwiw, my best guess is that tassie is in recession and VIC/SA not too far off. The GSP figures released in November (which are an annual number) suggested otherwise. I suppose it would be a helluva lota work to get those numbers on a qtrly basis. I think that NSW may be scraping by though as it is benefiting from a rebound in retail and its mfg sector is increasing productivity (finally!) but it’s a close call.
As for the ‘tards at the Business Council, heaven help us if it had its way on every issue.
Bill, I have re-read your article and seen your caveat re GSP. Cheers!
Hi Esp.
Regarding the transfer, for the effect to be neutral wouldn’t what the government spent acquiring the asset need to be equal to what the private company would otherwise have spent investing in it…in the same quarter?
Would the company really have invested the equivalent of the sale price of the asset – a sum big enough to affect the GDP figure – in one quarter alone, had it not been transferred to government? Desal plants take years to build, how long has this thing been dragging on for before government took ownership?
Go easy on me if I have this wrong, I’m not an economist.
cheers
Letter in Toronto Star, Canada’s largest newspaper:
Austerity obsession killing Canada
Re: Slow economic growth may mean more spending cuts: Flaherty, March 2
After World War II, our government wanted to make certain that returning soldiers had work, so even though the debt-to-GDP ratio was three times what it is today, the government built infrastructure, introduced new social services, and made sure the economy was functioning at close to full employment.
Contrast that with the situation today. The Harper government is obsessed with cutting the deficit, and when revenues decline, Finance Minister Jim Flaherty threatens to slash ever more government spending, risking a downward economic spiral.
It is apparent that Eurozone austerity programs over the last several years have been disastrous, resulting in unemployment rates reaching 25 per cent for the general population and 50 per cent for youth. In the United States, President Barack Obama labelled the billion dollar sequestration spending cuts inexcusable and dumb because they threaten 750,000 jobs and could send the U.S. into recession.
When will media commentators expose as an egregious failure the Conservative government’s fixation with balanced budgets that keeps 1.3 million Canadians involuntarily unemployed, costs our economy billions in lost production, and causes untold personal suffering to individuals and their families?
Larry Kazdan, Vancouver
http://www.thestar.com/opinion/letters_to_the_editors20130304austerity_obsession_killing_canada.html
I totally agree with your criticism of the Business Council’s bogus rhetoric. However, you say something like these terrible neo-liberal policies have led to … [among other things] failing productivity growth. Yet, your graph of labour productivity shows an increase there in the last year or so. Even over the span of the whole graph, it looks as if there’s probably been a net increase in the “GDP / hour worked” figure. Am I misinterpreting the graph and/or your sentence about the BCA?
Hi Lefty,
In this case i think the answer is no. The transfer to govt from the pvt sector takes the value of the transaction (about $4.5b) and reshuffles it across sectors. It is merely a book entry, but a necessary one so that future investment can be correctly measured. There would have been very little actual investment in the plant during the quarter as it’s finished (there will have been some maintenance capex at best). Does this answer your question?
The above link is missing several forward slashes. Hopefully the following paste will be correct:
http://www.thestar.com/opinion/letters_to_the_editors/2013/03/04/austerity_obsession_killing_canada.html
“In this case i think the answer is no. The transfer to govt from the pvt sector takes the value of the transaction (about $4.5b) and reshuffles it across sectors. It is merely a book entry, but a necessary one so that future investment can be correctly measured. There would have been very little actual investment in the plant during the quarter as it’s finished (there will have been some maintenance capex at best). Does this answer your question?”
In other words, the plant’s contribution to GDP had already been made, spread out in many small increments over the previous 8 – 12 quarters (or however long it took to construct) as the private sector paid it’s employees and contractors, paid it’s suppliers for the materials used in each stage of construction etc?
Which made the governments contribution to real, effective GDP in Q4 something of an illusion?
Which means that the economy in real terms probably contracted in Q4?
Lefty,
There ought to be zero or minimal impact on GDP in the Dec Qtr. Public sector investment added 1.1 percentage points, while private sector investment detracted 0.9 percentage points – for a net positive of 0.2 percentage points. Assuming the contribution of the hand-over was a full percentage point in either sector, had the transaction NOT taken place private investment and public investment would both have made a 0.1 percentage points contribution to GDP for the quarter – again a net positive of 0.2 percentage points. It was all about compositional changes rather than value add.
Cheers.