I am travelling today to Tokyo and have little time to write here. But with…
Australia National Accounts – its getting worse
In my assessment of the June-quarter 2012 National Accounts data the title indicated my assessment of where the economy was heading – Australian real GDP growth weakens and there is worse to come. Well, the worse to come came today with the release by the Australian Bureau of Statistics of the – Australian National Accounts – for the September 2012 quarter. The Australian economy continued to decline in the September-quarter and the trend is firmly down. The latest data available suggests that the slowdown in September (now officially revealed) has accelerated into the December-quarter, which is consistent with the trend shown in today’s data release. Today’s data release is now revealing for the first time the damaging impact of the fiscal austerity that the Government is pursuing. The government contribution to real GDP growth in the September-quarter was -0.5 percentage points, which totally nullified the positive contribution from private investment. A reasonable assessment is that the national growth rate is running around 2 to 2.5 per cent and falling, which is already well below trend. Employment and real net national disposable income are falling and the outlook is decidedly negative. As the former governor of the RBA said yesterday – fiscal policy is “just plain dumb” at present.
The main features of today’s National Accounts release for the June 2012 quarter were (seasonally adjusted):
- Real GDP increased by 0.5 per cent after recording a 0.6 per cent increase in the June-quarter.
- The main positive contributors to expenditure on GDP were Household final consumption expenditure (0.2 percentage points) down from 0.3 in the June-quarter.; Private fixed capital expenditure (0.5 percentage points), and Net exports (0.2 percentage points) down from 0.3 in the June-quarter. Inventories also contributed 0.5 percentage points, which is ominous.
- The main negative factors were the sharp contraction in Public capital expenditure (-0.4 percentage points), which meant that investment overall only added 0.1 percentage points.
- Our Terms of Trade (seasonally adjusted) fell by 4.0 per cent. Over the year to September 2012, the Terms of Trade have fallen by 13.7 per cent and that trend is the reason that forward-looking estimates of private investment (mining related) is looking very subdued into 2013.
- Real net national disposable income, which is a broader measure of change in national economic well-being fell by 0.7 per cent in the September-quarter and by 0.2 per cent over the year to September 2012. In other words, we are going backwards in real terms.
The ABC News story – Economic growth slows to 3.1pc – said that:
Australia’s economic growth slowed slightly last quarter, with the economy growing 3.1 per cent in the year to September.
Which is somewhat misleading because the strong March-quarter figure of 1.4 per cent reflected a lump of investment spending which will not be repeated any time soon.
But the June-quarter result combined with the September-quarter result today makes it clear that the trend is downwards and at present the Australian economy is growing around 2 per cent per annum, well under trend and less than is required to prevent unemployment from rising.
Last quarter I wrote the following:
The June quarter results reveals a substantial slowing and the latest data, which will feed into the September quarter 2012 results (that is, describing what is going on now) suggests that the economy has slowed even below its June-quarter result. That indicates that the Australian economy is growing well below trend.
That prediction has been realised in today’s data.
But also remember that due to the long lag (around 12 weeks) that is involved in getting the national accounts data out the result represent a very rear-view of where the economy has been and when there is a turning point evident the results may not be reliable guide to what is to happen.
My prediction is that the December-quarter results will be even worse than today’s results for the September-quarter.
The Sydney Morning Herald carried the headline this afternoon which the following graphic captures.
I thought it was going to be about today’s results but it is about the terrible road situation in Sydney, a result, by the way, of years of obsession about the need to run budget surpluses by the NSW State Government. Their argument was that this would preserve their AAA credit rating. A moment’s reflection demonstrates the ridiculous logic. They wanted to eliminate all State debt to keep the AAA rating, which really only mattered (at the State level) if they were borrowing!
Anyway, the headline surely describes the National Accounts results.
The Sydney Morning Herald did carry an article by Michael Pascoe – Swan and Hockey race to fiscal cliff – which summarises how stupid the Federal Treasurer (Swan) and his Opposition Shadow (Hockey) are in a more succinct way than I could.
Michael Pascoe points out that:
And Wayne Swan and Joe Hockey both promise further tightening of fiscal policy. With Hockeynomics, it could be a dramatic further tightening, unless there’s dramatic further spending as well – it’s hard to tell from the opposition’s promises to spend more and spend less and tax less, except when taxing more … the hypocrisy of simultaneously wanting the government to do more and less …
This is in relation to their respective reactions to the bad economic news. Swan claimed the economy was growing on trend, which is his mantra, but a lie nonetheless. He seems to be in denial as to the impact of government austerity.
He continually says that the government is giving the RBA space to cut interest rates. It is a strange way to conduct fiscal policy. They are deliberately creating a trend towards recession and forcing tens of thousands extra workers onto the unemployment queue and maintaining the unemployed in poverty conditions by refusing to increase the unemployment benefit, which is forcing the RBA to cut rates to historical lows in an attempt to avoid recession – and the Treasurer holds this out as responsible fiscal management. It is moronic and unethical.
Hockey is comical. He thinks the GDP figures are terrible but wants further fiscal austerity to give the private sector space to grow. What he understands about economics is zero.
The Sydney Morning Herald (December 5, 2012) article – ‘Just plain dumb’: Swan rejects fiscal ‘stupidity’ warning – reported the assessment by the former RBA Governor Bernie Fraser of the Government’s pursuit of a budget surplus in the current circumstances:
Australia is suffering from the “stupidity of government” by looking for a budget surplus while monetary policy is going the other way. It’s just plain dumb …
Yesterday, the RBA cut interest rates by 25 basis points to 3 per cent, the lowest since the depths of the GFC. The Statement by the RBA Governor was clear:
Global growth is forecast to be a little below average … Key commodity prices for Australia remain significantly lower than earlier in the year … The terms of trade have declined by about 15 per cent since the peak … recent data confirm that the peak in resource investment is approaching. As it does, there will be more scope for some other areas of demand to strengthen.
Private consumption spending is expected to grow, but a return to the very strong growth of some years ago is unlikely. Available information suggests that the near-term outlook for non-residential building investment, and investment generally outside the resources sector, remains relatively subdued. Public spending is forecast to be constrained.
The RBA is clearly realising that economic growth is slowing and fiscal policy, the other arm of government is exacerbating that slowdown.
The problem is that today’s National Accounts data demonstrates how ineffective monetary policy is.
The RBA has cut rates from 4.75 per cent in October 2011 to 3 per cent now. Over that time, real GDP growth has trended downwards and the only driver of growth has been private capital formation (in mining), which is largely insensitive to interest rate changes, and more driven by Terms of Trade movements.
Private consumption is flat and falling, which also suggests that monetary policy is relatively ineffective in terms of stimulating aggregate demand. That is no surprise. The idea that the Government and the majority of my profession is pushing is that fiscal policy is a poor cousin to monetary policy in terms of its effectiveness in stimulating growth. That is an ideological mantra and the evidence base would suggest otherwise.
As fiscal policy contracts, real GDP falls (relatively sharply) even over an extended period of monetary easing.
Bernie Fraser is correct in his assessment – both political parties are stupid – and the current policy settings amount to a sabotage act on the income producing capacity of the Australian economy.
Overall growth picture – trending down
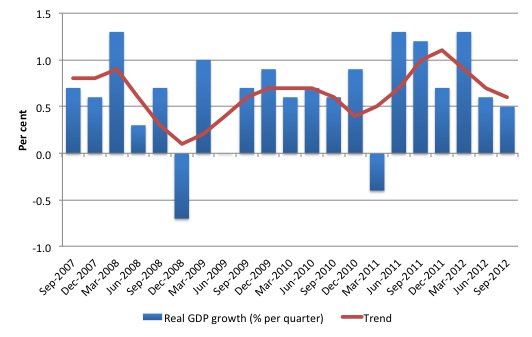
The following graph shows the quarterly percentage growth in real GDP over the last five years to the September-quarter 2012 (blue columns) and the ABS trend series (red line) superimposed. After the decline in trend growth was arrested by the fiscal stimulus in 2008-09 the decline in government support saw the dip in trend growth in 2010. Initially, growth in private investment helped drive the new rise in trend growth and that appears to have continued in the March 2012 quarter.
The average real GDP quarterly growth over the last year is 0.8 per cent (trend 0.8 per cent). Today’s data indicate that over the last year the Australian economy grew by a strong 3.1 per cent although that is somewhat influenced by the strong growth in the March-quarter 2012 following the a surge in private investment spending. The full extent of the fiscal contraction had also not been revealed until recent quarters.
Trend growth has been declining for the last four quarters of published data, notwithstanding the March-quarter surge.
Real GDP growth and hours worked
One of the puzzles over the last 18 months has been the sharp dislocation between what is happening in the labour market and what the National Accounts data has been telling us.
Employment growth and hours worked has been virtually flat over the period while reaL GDP growth has been well over 2 per cent per annum. Today’s data suggests dislocation is continuing. Even though growth is slowing, it remains around the 2 per cent per annum mark (at least). But there is no employment dividend of any significant amount forthcoming.
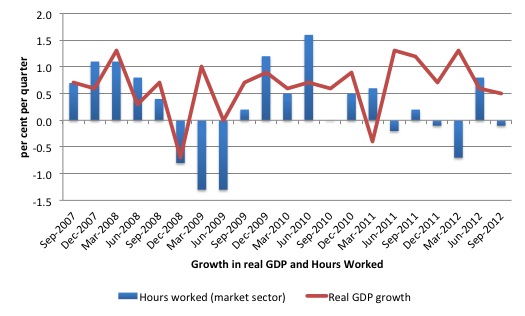
The following graph presents quarterly growth rates in trend GDP and hours worked using the National Accounts data for the last five years to the September-quarter 2012.
You can see the major dislocation between the two measures that appeared in the middle of last year has persisted into 2012. Hours worked increased in the June quarter more in line with what we would expect but have collapsed again.
Just in case you think the labour force data is suspect, the hours worked computed from that data is very similar to that computed from the National Accounts.
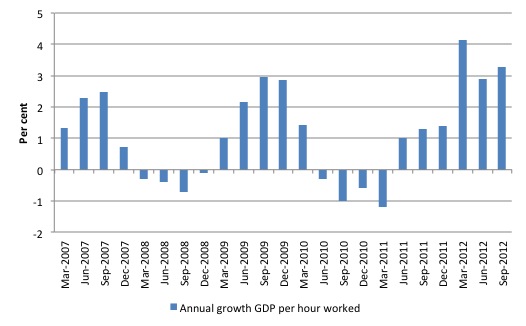
To see the above graph from a different perspective, the next graph shows the annual growth in GDP per hour worked (so a measure of labour productivity) from the March 2007 quarter to the September-quarter 2012. This also helps explain why employment growth has been lagging even with the relatively strong real GDP growth.
Growth in labour productivity means that for each output level less labour is required.
Contributions to growth
What components of expenditure added to and subtracted from real GDP growth in the September-quarter 2012?
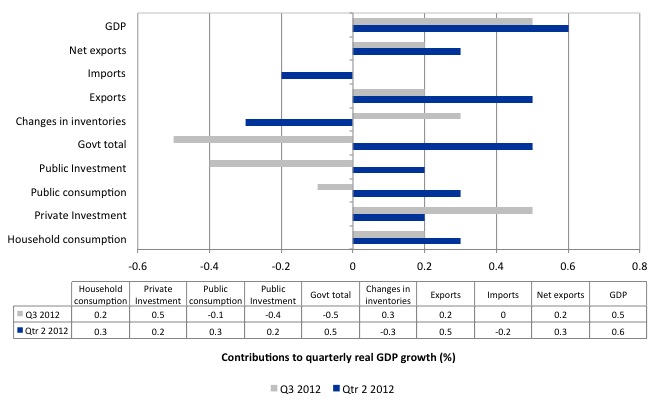
The following bar graph shows the contributions to real GDP growth (in percentage points) for the main expenditure categories. It compares the September-quarter 2012 contributions (grey bars) with the June-quarter 2012 (blue bars).
First, note that without the inventory build-up (0.3 percentage points) the overall real GDP growth rate would be very low (0.2 per cent). Why should I highlight that?
When we talk about deficient aggregate demand we are considering spending in relation to the capacity of the economy to produce real goods and services. This can also be viewed of as the capacity to employ workers at current productivity rates. So deficiency is a shortfall in spending which provokes firms to reduce output (so that they do not accumulate unsold inventories) and lay off workers.
The first signal firms get that household and/or public consumption is falling is in the unintended build-up of inventories. That signals to firms that they were overly optimistic about the level of demand in that particular period.
The question is whether the build-up of inventories in the September-quarter was the result of this sort of dynamic or a discretionary inventory-building exercise by firms, optimistic about the future.
All the evidence suggests it is that latter. Private consumption is weakening and public spending is now pulling growth down. In that environment, it is likely the rise in inventories is signalling a normal inventory-cycle effect where the firms have overproduced (their expectations of future aggregate demand was overly optimistic) and so they will start to cut back output in the next period.
That type of cycle results in firms laying-off workers and reducing hours of work (note this happened in the September-quarter) and the loss of income starts to multiply as those workers reduce their spending elsewhere.
Second, it is clear that the carbon tax offset bonuses given to consumers earlier in the year as a political sop to neutralise the carbon tax (and largely neutralise the good that the carbon tax was designed to achieve) has now dissipated. Household consumption contributed 0.2 percentage points in the September-quarter (down from the offset-aided 0.3 percentage points in the June-quarter. The most recent retail sales data (released last Monday) confirmed that spending is now very flat.
Private investment continued to add to growth (0.5 percentage points) but with the Terms of Trade falling, that contribution will wane over the next 12 months. The latest ABS data on investment intentions confirmed that the coming quarters will see a slowing contribution to real GDP growth from private capital formation.
The fiscal austerity is clearly apparent – overall reducing growth by 0.5 percentage points and nullifying the private investment contribution. For the Australian economy to be growing on trend the public contribution would have had to match the private investment contribution rather than render it neutral.
Household saving ratio steady around 10.5 per cent
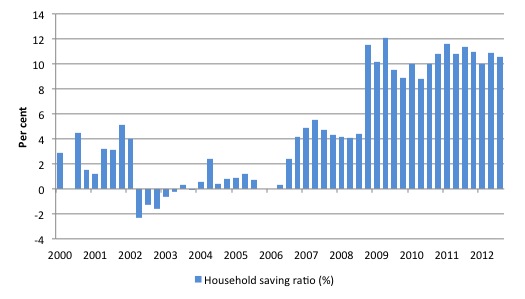
The following graph shows the household saving ratio (% of disposable income) from 2000 to the current period. The household sector is now behaving very differently since the GFC rendered its balance sheet very precarious. Prior to the crisis, households maintained very robust spending (including housing) by accumulating record levels of debt. As the crisis hit, it was only because the central bank reduced interest rates quickly, that there were not mass bankruptcies.
The household saving ratio is now steady around 10.5 per cent of disposable household income.
For the economy to continue to grow strongly while households are maintaining this higher levels of saving (from disposable income), public spending, private investment and/or net exports has to increase.
Clearly, the contribution from private investment is strong but likely to decline in the coming year and the net exports contribution in the current quarter is modest (and also not typical).
Which means that growth will also require expanding budget deficits, exactly the opposite to what the “stupid, plain dumb” government is doing.
The problem is that if incomes start to drop and the households continue to pursue this saving proportion aggregate demand will decline even further. What the Government fails to understand is that the household sector is now carrying record levels of debt as a result of the credit binge leading up to the crisis and we are unlikely to see a return to the low saving ratios that were evident in the period 2000 to 2005.
That means that government surpluses which were associated with the credit binge, and only were made possible by the unsustainable credit binge are untenable in this new (old) climate. The Government needs to learn about these macroeconomic connections.
A return to higher saving ratios is surely signalling a need for continuous budget deficits.
Conclusion
Today’s National Accounts data is now clearly indicating how much damage the Government’s obsession with achieving a budget surplus in the coming year is causing.
While private investment continues to contribute to growth its effect is being wiped out by the fiscal austerity. The Government is choosing to undermine jobs growth and real disposable income growth (both of which were negative in the September quarter) to chase its nonsensical surplus. They don’t seem to understand that spending equals income and the growth in income is now falling because they are undermining it.
The September-quarter data combined with the official data we have available since tells me that the economy is growing well below trend and there will not be any significant dents in the high levels of labour underutilisation that are persisting (around 12.5 per cent).
As the former RBA Governor said yesterday – we are being damaged by the “stupidity of government” and they are running policy that is “just plain dumb”. And assess what ideological bent is driving that policy and you conclude – neo-liberal is just plain dumb. It is the opposite policy stance at present to what the national government should be running.
Tomorrow, we will get the November Labour Force data. That will give a much more immediate view of what is going on.
That is enough for today!

“Fiscal Cliff” – I see we’re importing American metaphors as well.
I prefer the “Fiscal Bluff” as I heard on NPR this morning. Why “Bluff”? 1. Because it is a bluff, as in a hedge and 2. can also mean cliff as I understand it.
I do note Australia does have a “debt ceiling” limit just like the US. Whether Australia or the USA, is it economically feasible just to abolish that legislation?
Doesn’t the sectoral balance law say that higher household saving rate means that there has to be a higher budget deficit, whether the government wants it or not, unless there is some compensation by the saving rate of the banks and firms and/or the current account deficit is reduced? Or we could put it in reverse and say that the household saving rate can increase, whether householders want it or not, only if there is an increase in the budget deficit, subject to banks, firms and the current account.
Was the jump in saving rate in 2006 due to a current account surplus?
“Doesn’t the sectoral balance law say that higher household saving rate means that there has to be a higher budget deficit, ”
The domestic private sector consists of households, private non-financial businesses and financial businesses. They can all offset each other.
This is where our much less than democratic electoral system in the House of Representatives has landed us – in the cleft stick of the 2 party hegemony where both are smitten by the conventional “wisdom”.
The only viable third party,The Greens,are too busy chasing moonbeams like asylum seekers (aka illegal immigrants) and renewable energy to develop practical policy.
For a nation with many advantages we sure are squandering our future prospects in the pursuit of mindless ideology.
Neil, you only quoted half my sentence and the other half did cover your point, admittedly not a model of clarity.
It would be very interesting to see the rest of the story about the sudden increase in saving ratio in Australia. What happened to the banks and other businesses and to the net exports at the time? The jump in 2008 is not particularly surprising but I don’t understand why it happened in 2006. Did people see the GFC coming?
Quote: As the former governor of the RBA said yesterday – fiscal policy is “just plain dumb” at present.
Translation: We have a dumb Treasurer (and even dumber Shadow Treasurer).
Podargus, asylum seekers are not illegal immigrants – see United Nations Convention Relating to the Status of Refugees.