Today (January 22, 2026), the Australian Bureau of Statistics (ABS) released the latest labour force…
Australian Labour Force – weak outcome with a growing teenage crisis
Today’s release by the Australian Bureau of Statistics (ABS) of the Labour Force data for October 2012 reveals a labour market that remains weak, with employment growth failing to match the underlying population growth. The unemployment rate remains steady at 5.4 per cent because the labour force barely grew as a result of a continuing decline in the participation rate over the last 12 months. The fact that workers are giving up looking for jobs is a portent of a very sluggish labour market. So unemployment fell but hidden unemployment rose. The trend performance of the labour market is flat and these monthly shifts are merely fluctuating around that flat trend. The data is not consistent with any notions that the Australian labour market is booming or close to full employment. The most continuing feature that should warrant immediate policy concern is the appalling state of the youth labour market. My assessment of today’s results – worrying with further weakness to come. The government has in the past few weeks insisted it will pursue its budget surplus obsession and announced further cuts in discretionary net spending. Not only will that act of fiscal vandalism fail but in doing so it will further undermine a very weak labour market.
The summary ABS Labour Force (seasonally adjusted) estimates for October 2012 are:
- Employment increased 10,700 (0.1 per cent) with full-time employment rising by 18,700 and part-time employment falling by 8,000.
- Unemployment decreased by 8,800 (1.3 per cent) to 653,200.
- The official unemployment rate remained at 5.4 per cent.
- The participation rate increased by 0.1 points to 65.1 per cent.
- Aggregate monthly hours worked fell by 4.2 million hours (-0.26 per cent).
- The ABS broad labour underutilisation estimates (the sum of unemployment and underemployment) which are published on a quarterly basis (latest data published in August release) showed that the total labour underutilisation rate was 12.4 per cent in the third-quarter 2012.
The ABC National News Report – Unemployment steady on job rise – said that:
The unemployment rate has remained steady at 5.4 per cent in October, due to the creation of 10,700 new jobs.
Which might have been better written by adding that the fall in participation helped – meaning that official unemployment fell but hidden unemployment rose.
The rest of the story does tell readers that the labour force shrunk in October and that the “more stable trend unemployment rate, which smoothes out monthly volatility rose slightly from 5.3 to 5.4 per cent”.
If we are looking for signals from the data we need look no further than the sharp rise in the unemployment rate in Western Australia since June. Western Australia has been booming as a result of its mining sector, and its performance has been helping Australia stay in positive growth territory as the Government pursues its obsessive fiscal contraction.
In June, the unemployment rate in WA was 3.5 per cent and in October is had climbed to 4.6 per cent, adding an extra 0.6 percentage points in October alone. This accords with other evidence regarding the slowdown of investment in the mining sector as many projects are put on hold or abandoned due to the decline in commodity prices.
The Sydney Morning Herald report – Jobless rate stabilises in October – also focuses on the jobs added in October and what it meant for interest rates.
The article said that the “jobs market bucked forecasts of a further rise in the unemployment rate”, which would give the reader the impression that things were improving. They might has said these forecasts were from the bank economists who have an appalling track record of predicting the movements of the economy. Their predictions should definitely not be seen as the benchmark.
The article did, however, note that the outcome was weak and had the participation not fallen, then the weak net employment growth “would see unemployment rise”.
Economists quoted in the article used terms like “soft outcome”, “anaemic employment growth”, which is about right.
Employment growth – cycling around zero
The October data shows that employment growth was very weak again with total employment rising by by 10,700 (0.1 per cent) – full-time employment rose by 18,700 but part-time employment decreased by 8,000. While full-time employment rose, total hours worked fell indicating that the part-time jobs that were lost were at the upper-end of the hours distribution.
Today’s data reasserts the message that the labour market data is switching back and forth each month with an sluggish (slightly negative) underlying trend being fairly stable for some months now.
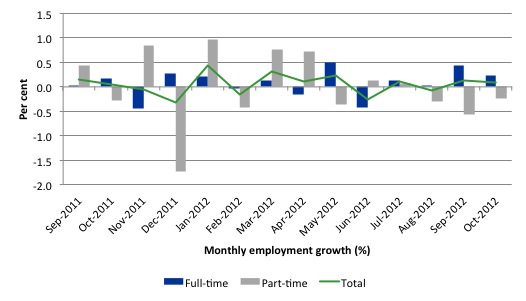
There have been considerable fluctuations in the full-time/part-time growth over the last year with regular crossings of the zero growth line
The following graph shows the month by month growth in full-time (blue columns), part-time (grey columns) and total employment (green line) for the 12 months to October 2012 using seasonally adjusted data.
Today’s results just repeat the topsy-turvy nature of the data over the period shown. The Australian labour market is struggling with the low GDP growth creating a near jobless growth environment.
While full-time and part-time employment growth are fluctuating around the zero line, total employment growth is still well below the growth that was boosted by the fiscal-stimulus in the middle of 2010.
The following table provides an accounting summary of the labour market performance over the last six months. The monthly data is highly variable so this Table provides a longer view (over the last 6 months) which allows for a better assessment of the trends. WAP is working age population (above 15 year olds). The first three columns show the number of jobs gained or lost (net) in the last six months.
The conclusion – overall only 29 thousand jobs (net) have been created in Australia over the last six months with 70.7 thousand full-time jobs being offset by the loss of 43.1 thousand part-time jobs (net). This is a very miserable employment growth performance.
The WAP has risen by 134 thousand in the same period while the labour force rose by 75.3 thousand. The relatively weak employment growth has not been able to keep pace with the underlying population growth and unemployment has risen as a result (by 48 thousand).
The rise in unemployment would have been greater had not the participation rate fallen (by 0.0.065 percentage points), which reduced the growth in the labour force.
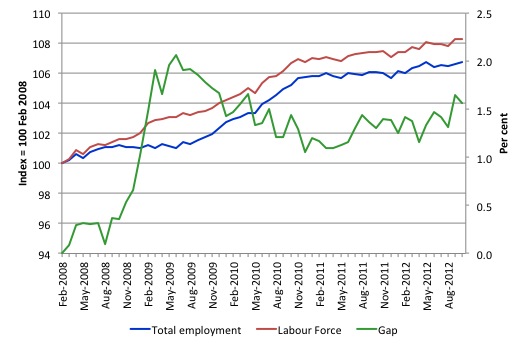
To put the recent data in perspective, the following graph shows the movement in the labour force and total employment since the low-point unemployment rate month in the last cycle (February 2008) to October 2012. The two series are indexed to 100 at that month. The green line (right-axis) is the gap (plotted against the right-axis) between the two aggregates and measures the change in the unemployment rate since the low-point of the last cycle (when it stood at 4 per cent).
You can see that the labour force index has largely levelled off and now falling and the divergence between it and employment growth has been relatively steady over the last several months with this month showing some improvement.
The Gap series gives you a good impression of the asymmetry in unemployment rate responses even when the economy experiences a mild downturn (such as the case in Australia). The unemployment rate jumps quickly but declines slowly.
It also highlights the fact that the recovery is still not strong enough to bring the unemployment rate back down to its pre-crisis low. You can see clearly that the unemployment rate fell in late 2009 and then has hovered at the same level for some months before rising again over the last two months.
The gap shows that the labour market is still a long way from recovering from the financial crisis that hit in early 2008. There hasn’t been much progress since November 2010, when the fiscal stimulus started to run out.
Teenage labour market – remains in a parlous state
The teenage labour market continued to slide backwards last month and is now in a deep crisis. Where the alarm bells from the press and the Government?
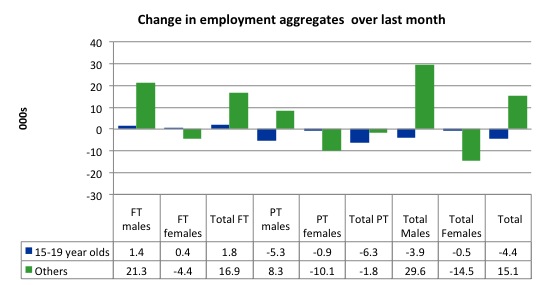
The following graph shows the distribution of net employment creation in the last month by full-time/part-time status and age/gender category (15-19 year olds and the rest)
Over the last month, teenagers lost 4.4 thousand jobs while the rest of the workforce gained 15.1 thousand jobs.
The conclusion is that the weak employment growth is providing no opportunities to teenagers to enter the employed workforce.
If you take a longer view you see how poor the situation is.
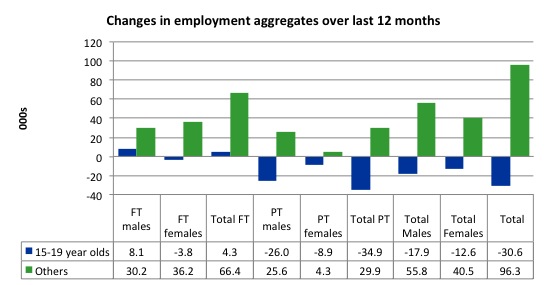
Over the last 12 months, teenagers have lost 30.6 thousand net jobs overall which the rest of the labour force have gained 96.3 thousand net jobs. Teenagers have gained 4.3 thousand full-time opportunities but lost 34.9 thousand part-time opportunities in net terms.
So the Australian labour market has further undermined the opportunities for this cohort over the last year.
The teenage segment of the labour market is being particularly dragged down by the sluggish employment growth, which is hardly surprising given that the least experienced and/or most disadvantaged (those with disabilities etc) are rationed to the back of the queue by the employers.
The following graph shows the change in aggregates over the last 12 months. Australian teenagers are going backwards which is a trend common around the world at present.
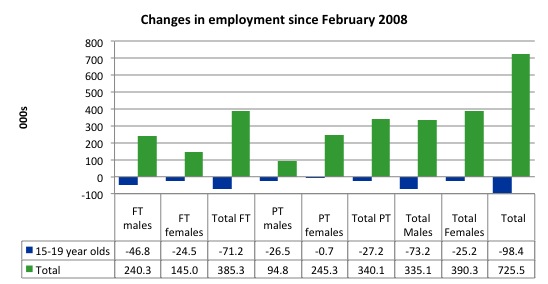
To further emphasise the plight of our teenagers I compiled the following graph that extends the time period from the February 2008, which was the month when the unemployment rate was at its low point in the last cycle, to the present month (October 2012). So it includes the period of downturn and then the “recovery” period. Note the change in vertical scale compared to the previous two graphs. That tells you something!
The results are stunning and represent a major policy failure.
Since February 2008, there have been 725.5 thousand (net) jobs added to the Australian economy but teenagers have lost a staggering 98.4 thousand over the same period. It is even more stark when you consider that 71.2 thousand full-time teenager jobs have been lost in net terms. Even in the traditionally, concentrated teenage segment – part-time employment – there have been 27.2 thousand jobs (net) lost.
Further, around 47 per cent of the total (net) jobs added since February 2008 have been part-time.
Overall, the performance over the last 12 months is poor and should receive a much higher priority in the policy debate than it does.
The longer-run consequences of this teenage “lock out” will be very damaging.
The Australian government has no coherent strategy to resolve this appalling state. Ensuring teenagers are included in paid work, if they do not desire to remain in school, should be a number one policy priority.
The Government’s response is to push this cohort into endless training initiatives (supply-side approach) without significant benefits. The research shows overwhelmingly that job-specific skills development should be done within a paid-work environment.
I would recommend that the Australian government announce a major public sector job creation program aimed at employing, in the first instance, all the unemployed 15-19 year olds.
It is clear that the Australian labour market continues to fail our 15-19 year olds. At a time when we keep emphasising the future challenges facing the nation in terms of an ageing population and rising dependency ratios the economy still fails to provide enough work (and on-the-job experience) for our teenagers who are our future workforce.
Unemployment
The unemployment rate was steady at 5.4 per cent in October 2012 although unemployment fell by 8,800. The fall in unemployment, however, masks the fact that the labour force participation rate fell.
The reality is that employment growth remains below the underlying population growth and it is only the sluggish labour force growth (being held back by these regular contractions in the participation rate) that has prevented a substantial rise in unemployment.
Overall, the labour market still has significant excess capacity available in most areas and what growth there is is not making any major inroads into the idle pools of labour.
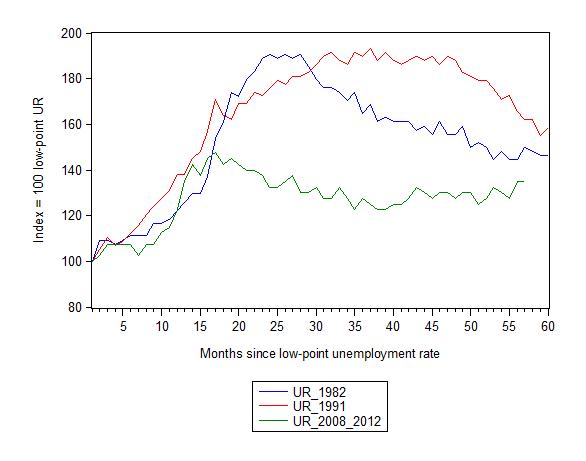
The following graph updates my 3-recessions graph which depicts how quickly the unemployment rose in Australia during each of the three major recessions in recent history: 1982, 1991 and 2009 (the latter to capture the 2008-2010 episode). The unemployment rate was indexed at 100 at its lowest rate before the recession in each case (October 1981; December 1989; April 2008, respectively) and then indexed to that base for each of the months as the recession unfolded.
I have plotted the 3 episodes for 57 months after the low-point unemployment rate was reached. For 1991, the end-point shown is the peak unemployment which was achieved some 38 months after the downturn began although the recovery was painfully slow. While the 1982 recession was severe the economy and the labour market was recovering by the 26th month. The pace of recovery for the 1982 once it began was faster than the recovery in the current period.
It is significant that the current situation while significantly less severe than the previous recessions is dragging on which is a reflection of the lack of private spending growth and declining public spending growth.
The graph provides a graphical depiction of the speed at which the recession unfolded (which tells you something about each episode) and the length of time that the labour market deteriorated (expressed in terms of the unemployment rate).
From the start of the downturn to the 57-month point (to October 2012), the official unemployment rate has risen from a base index value of 100 to a value 135 – peaking at 145 after 21 months. It has been hovering at the current level for some months now. Unlike the other episode, the current trend, at this stage of the cycle, is unclear.
At 57 months, 1982 index stood at 150 and oscillating, while the 1991 index was at 162 and falling steadily. It is clear that at an equivalent point in the “recovery cycle” the current period is more sluggish than our recent two major downturns.
It now appears that the recoveries are converging, which tells us that the current policy has failed to take advantage of the fact that the latest economic downturn was much more mild than the previous recessions. In other words, the policy failure is locking the economy into a higher unemployment rate than is desirable and otherwise attainable.
Note that these are index numbers and only tell us about the speed of decay rather than levels of unemployment. Clearly the 5.1 per cent at this stage of the downturn is lower that the unemployment rate was in the previous recessions at a comparable point in the cycle although we have to consider the broader measures of labour underutilisation (which include underemployment) before we draw any clear conclusions.
The notable aspect of the current situation is that the recovery is very slow.
Aggregate participation rate fell in October
The participation rate fell by 0.1 percentage points in October 2012 to 65.1 per cent. It remains 0.4 percentage points lower than it was 12 months ago.
It is still substantially down on the most recent peak of 66 per cent (November 2010) when the labour market was gathering pace courtesy of the fiscal stimulus.
This drop in participation in the last year or more has meant the labour force growth has been relatively subdued with the additional result being that the unemployment rate is considerably lower than would otherwise been the case.
In the current month, unemployment fell by 8.8 thousand but the unemployment rate rounded out unchanged at 5.4 per cent of the labour force. How much of that is due to the rise in participation and how much is due to the weak employment growth failing to keep pace with the underlying population growth?
The labour force is a subset of the working-age population (those above 15 years old). The proportion of the working-age population that constitutes the labour force is called the labour force participation rate. So changes in the labour force can impact on the official unemployment rate and so movements in the latter need to be interpreted carefully. A rising unemployment rate may not indicate a recessing economy.
The labour force can expand as a result of general population growth and/or increases in the labour force participation rates.
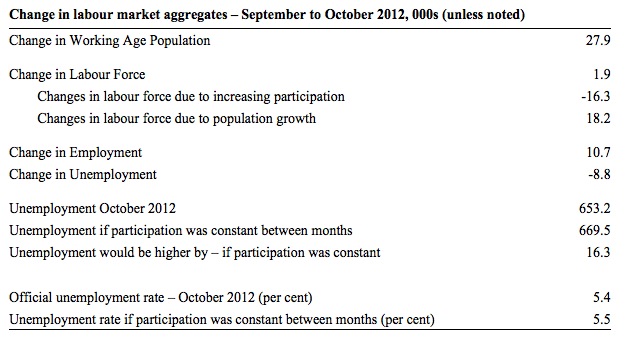
The following Table shows the breakdown in the changes to the main aggregates (Labour Force, Employment and Unemployment) and the impact of the rise in the participation rate.
In October 2012, employment rose by 10,700 while the labour force rose by a miserly 1,900, which meant that unemployment fell by 8,800
The labour force rose in October for two reasons:
- The underlying population growth added 18.2 thousand persons to the labour force. The population growth impact on the labour force aggregate is relatively steady from month to month; and
- The participation rate fall meant that 16.3 thousand workers left the labour force (relative to what would have occurred had the participation rate remained unchanged).
Clearly, employment growth was not sufficient to match the underlying population growth (a deficiency of 7.5 thousand).
But if the participation rate had not have fallen, at the current employment level, unemployment would have been 669.5 thousand instead of 653.2 thousand as recorded by the ABS.
So if the participation rate had have remained unchanged, the unemployment rate would have been 5.5 per cent rather than 5.4 per cent as officially published.
The conclusion is that unemployment would have actually risen by 16.3 thousand instead of falling by 8.8 thousand had the labour force participation not have fallen.
The difference is that hidden unemployment rose while official unemployment fell. In functional terms this signals a deterioration.
Hours worked fell in October 2012
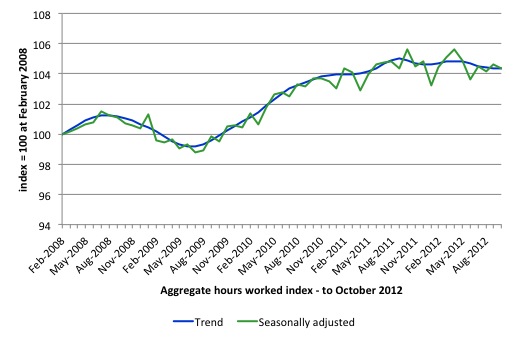
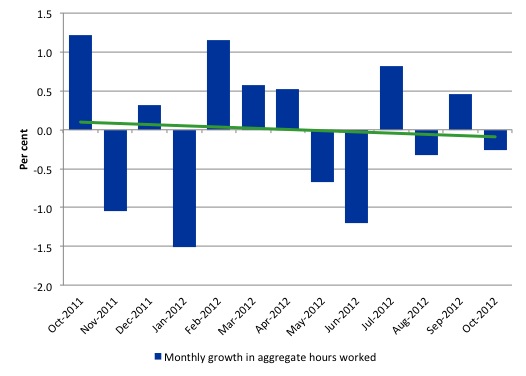
Aggregate monthly hours worked fell by 4.2 million hours (-0.26) per cent) in seasonally adjusted terms and the trend is now firmly down and signalling a labour market that is deteriorating.
The small swings up and down in monthly hours worked each month since the beginning of 2011 is being driven by similar fluctuations in full-time employment.
The following graph shows the trend and seasonally adjusted aggregate hours worked indexed to 100 at the peak in February 2008 (which was the low-point unemployment rate in the previous cycle). The rising trend which marked the early recovery courtesy of the fiscal stimulus is now clearly gone.
The next graph shows the monthly growth (in per cent) over the last 12 months. The green linear line is a simple regression trend – firmly down.
Once again the data doesn’t support the notion of a fully employed labour market that is bursting against the inflation barrier.
Conclusion
Overall, today’s data confirms that the labour market is weak and fluctuating around a zero employment growth trend. Employment growth is clearly not strong enough to even keep pace with the growth of the underlying population let alone eat into the huge pool of unemployment and underemployment.
Variations in the participation rate from month to month are then driving rises or falls in the unemployment around a slightly increasing trend.
That pattern has been evident for the last 18 months or so and leads to the conclusion that the labour market is weak and trending towards increased weakness.
We always have to be careful interpreting month to month movements given the way the Labour Force Survey is constructed and implemented. But the underlying trend is weak as a result of the withdrawal of the fiscal stimulus undermining employment growth.
The most striking aspect of a sad picture remains the appalling performance of the teenage labour market. Employment has collapsed for that cohort and I consider it a matter of policy urgency for the Government to introduce an employment guarantee to ensure we do not continue undermining our potential workforce.
The data certainly doesn’t support the Federal Government’s current macroeconomic settings, which are biased towards contraction. More fiscal stimulus is definitely needed.
That is enough for today.
(c) Copyright 2012 Bill Mitchell. All Rights Reserved.

No, Bill, more stimulus is needed, but a monetary stimulus is likely to be just as effective.
Furthermore, more fiscal stimulus would be futile without a change in monetary policy.
@Aidan, I disagree with you. During periods where money demand is relatively weak (such as during develeraging cycles) monetary stimulus is relatively ineffective. Even in Australia, where conditions are not yet so dire as in the US and (heaven-forbid) Europe, the more densely populated south-eastern seaboard has barely batted an eye-lid. One clear lesson that emerged from the GFC is that it is much better to arm those with a high propensity to consume via directly raising their spending power. I would combine this with targetted tax cuts and key infrastructure projects that increase quality of life and at least provide the prospect of employment for Australia ‘forgotten’ workers. In this way, as private spending and/or external demand finally comes good there is less prospect of what I will term ‘social bottlenecks’ that can prevent the most vulnerable from climbing out of poverty during more prosperous times.
correction:
“the more densely populated south-eastern seaboard has barely batted an eye-lid.”…as interest rates have fallen (and implied savings rates have held up fairly strongly).
@Esp Ghia, demand in Australia’s nowhere near weak enough for monetary stilmulus to be ineffective. The main problem with the Australian economy is that because our interest rates are much higher than those of the rest of the world, banks and businesses are borrowing from overseas instead of domestically. This has pushed our dollar far too high relative to our terms of trade. Because of this our businesses are having trouble competing with their overseas counterparts, and that’s why they’re so reluctant to hire more people.
If Australia makes some decent cuts to its interest rates and that’s still ineffective, there will always be opportunities for fiscal stimulus. But when we have economic problems resulting from interest rates being too high, it is incorrect to claim the stimulus we need must be fiscal.
I don’t agree that interest rates are the main problem with the Australian economy – Dutch disease and a whole lot of resistance to long overdue change by industry stalwarts are more important reasons for the current malaise. I can’t wait to the see the gross state product numbers for 2011/12; these figure should be released later this month. I think it will show that Tassie is in recession and Victoria is being held up by financial services. Same for NSW. It will be a different story for WA (extensive mining) and the NT (big gas projects).
In any case, consumers are feeling the pinch from government-imposed cost of living increases and household balance sheets are still being restored. Lower interest rates will have only a marginal impact at best, imho.
It’s not Dutch disease, which is the result of a trade imbalance (or of labour shortages, but we can safely discard that explanation). The appreciation of the exchange rate is not due to mining exports, it’s due to those overseas parking their money in Australia – and that’s largely (though not entirely) due to our comparatively high interest rates.
If lower interest rates would only have a marginal impact then the RBA wouldn’t be so reluctant to cut them.
“If lower interest rates would only have a marginal impact then the RBA wouldn’t be so reluctant to cut them.”
Or are deluded into thinking like that.
Appeal to authority is a weak argument.
Aidan: “The main problem with the Australian economy is that because our interest rates are much higher than those of the rest of the world, banks and businesses are borrowing from overseas instead of domestically.”
I agree interest rates are higher than overseas. That’s a simple fact. My opinion is also that they are too high and will continue to fall. That opinion hasn’t changed for some years, nor has the idea that it won’t be as effective as fiscal policy. it simply won’t. Check out Credit growth, retail sates growth, building approvals … basically the bellwether indicators of domestic demand.
But back to your statement … your point on borrowing offshore because of higher interest rates is not right. Take banks for example. They actually pay higher interest rates to borrow offshore (when swapped back into a margin over A$ BBSW, as they always are, and which eliminates the naked interest rate differential) because they know they can do so in larger amounts and with greater certainty than they can achieve domestically. This is a constant source of frustration amongst local money managers/investors who would prefer to earn the extra return, as well as see the local banks support their home market more.
“If lower interest rates would only have a marginal impact then the RBA wouldn’t be so reluctant to cut them.” … you give the RBA FAR too much credit. Their forecasts have been abysmal, whether measured in terms of inflation or GDP, or even with regard to China, where the Governor was still trumpeting the Chinese miracle even as it was unravelling. Kind of mirrors his continued tightening a few years back when it was clearly past time. Send him off to the BoE (sorry Neil).
@Aidan, the rise of the AUD has been more a function of the mining boom, which has been a demand-driven phenomenon (the huge capital inflows relate to the boom in this instance, more so than ‘carry trades’ and hot money chasing interest rate differentials). If you look at Australia’s terms of trade, the big contributer to its relatively high level has been export prices rather than import price deflation. While the terms of trade peaked about a year ago, they remain near historically high levels.
In terms of the current situation, I am not saying that interest rates are not influencing the current high AUD. I think the attraction is more the AAA-rated sovereign debt and that overseas perceptions of Australia’s public debt (correctly) does not suffer from the hysteria in the mainswamp media at home.
Australia has had several cuts to the official cash rate over the past twelve months (and the terms of trade are clearly lower) – what do you think the AUD has done over this period? Here’s a hint: it’s higher than it was a year ago 🙂
Cheers!
The interest rate has been, and always will be an economic smokescreen built by the neo-liberal scumbags to avoid addressing the real problems of the macroeconomy.
As Bill has mentioned numerous times before.
“Growth occurs because spending equals income – public or private the cash till operators don’t discriminate. When there is insufficient private spending to support robust growth, then you have to supplement it with public spending. End of story.”
[source: https://billmitchell.org/blog/?p=12975%5D
So simple, and yet beyond the economic comprehension of one contributor in this blog.
Neil Wilson, as an argument it would be very weak. As one bit of supporting evidence, less so.
Alan Dunn, if you think private spending is fixed then you’re the one whose economic comprehension is lacking.
apj, except in the situation where interest rates are so near zero that cutting them is futile, isn’t it meaningless to claim that fiscal stimulus will work better than cutting interest rates without specifying the amount of each?
Your point abut bank funding is a good one that’s worthy of further investigation.
BILL, can I request an article on what is preventing banks sourcing their money from the RBA and what can be done about it?
Aidan : “except in the situation where interest rates are so near zero that cutting them is futile, isn’t it meaningless to claim that fiscal stimulus will work better than cutting interest rates without specifying the amount of each?” …
No, I don’t think it’s meaningless. Leaving aside the idea of how precisely you can measure the “true” effects of policy anyway because of the competing forces at work (the IMF’s, and Troika’s, efforts in being unable to appreciate how imposing austerity in order to reduce a deficit actually ends up increasing it being a case in point … Another is the lost income accruing to savers as interest rates fall, or QE taking interest income from the private sector), is it not a more useful analysis to first diagnose what requires fixing, then figure out how to get there, armed with an appreciation of the transmission mechanisms of each? In current circumstances, demand for new debt in Australia has been low for a few years now (the transmission is very low in other words, and banks have increased their margins significantly as we’ll to really nail the coffin). pull up a 10-15yr history of those domestic indicators I mentioned above (the same ones Glenn Stevens highlighted pre-GFC, then managed to miss tanking, preferring to focus on China and apparently missing it slowing). Demand is low for incremental debt, for retail sales (the amount replaced by Internet sales is too hard to measure accurately, and at its core is a hunt for lower priced items in an environment of high levels of underemployment), and the housing market is overvalued and sliding slowly in general, and rapidly in some areas and price ranges. How do lower interest rates encourage borrowing by those who would prefer to deleverage or save, or who look a little more deeply and uncertainly into the housing market and the related stock of debt, let alone global developments? In hitching our wagon to China, the RBA managed to allow international investors a gimme trade, buying up our perfectly safe sovereign bonds at gimme rates. The RBA has sold non-mining Australia (the vast majority of the country and overwhelming employer) up the creek. They should have used the army of analysts at their disposal to come up with some proactive policy. Alas, they failed at that too, and we have had to labour under an irrelevant mining boom for most of the country with a massively overvalued exchange rate. The point is not that rates should be lower, they should, but that the effects of them are ambiguous, requiring policy that has more ‘control’.
Fiscal policy is not ambiguous, but targeted, and has measurable benefits for aggregate demand. Someone’s gotta spend, right? unless we’re happy to see growth really get torched. Yet even though sovereign debt is extremely low, politicians and other ‘interested’ parties are able to present further deficit expansion as a mortal sin. The current government believes it, as evidenced by their surplus myopia, and dont seem to understand sectoral balances … or economics for that matter (aside: picture a group even more clueless individuals and you get the current Opposition). The attempt to achieve such a surplus necessarily reduces aggregate demand by reducing spending (and can’t we do with better infrastructure, and social expenditure on health and education? my word we can). This means rates will be forced lower as the sloth like RBA is forced to respond to … Surprise, surprise … Deteriorating domestic indicators. But will it do any good? Look at Japan, look at the UK, the US … Rates are going lower for a reason – and when people don’t want to borrow, the interest rate is almost irrelevant. The structure of society needs to change, to reverse the widening income gap, to ensure employment of those who want more work and money, and who, ultimately, decide whether aggregate demand increases or not. Give an investment banker a 10mm bonus and its highly questionable how much his demand increases (for goods and services, as opposed to financial assets). Fiscal policy aimed at the broad rump of the population on the other hand …
On the question of bank funding, that is fact, not even a skerrick of opinion.
Apj, the economic situation of Japan, the UK and even the USA does conform to the exception that I mentioned. Australia’s nowhere near that situation.
You ask How do lower interest rates encourage borrowing by those who would prefer to deleverage or save? The answer is that it provides more opportunities to do things that would be unaffordable with higher interest rates. Mechanization is one such thing. Improving energy efficiency is another. In both cases there are long term gains but a high short term cost. Cutting interest rates reduces the short term bias of decision making.
Unless current monetary policy is changed, any fiscal stimulus is likely to result in the RBA whacking up interest rates, eroding and possibly destroying the economic benefits.
You ask is it not a more useful analysis to first diagnose what requires fixing, then figure out how to get there, armed with an appreciation of the transmission mechanisms of each? That’s a very good question, but the answer is no, for one simple reason: nobody can agree on what needs doing. But if we can figure out the costs and benefits of doing things, allowing them to be prioritized more effectively. Even then it will still be a political decision, but at least it will be an informed one.
By more accurately modelling the wider economic effects of spending money and providing infrastructure, MMT has the potential to revolutionize the cost benefit analysis process. Precisely measuring the true effects is of course difficult, but it seems to be the thing that Bill Mitchell himself seems to be very good at… with one great exception: a remarkable reluctance to accept the tradeoff between fiscal and monetary intervention. Unfortunately such an acceptance is a prerequisite for this extremely useful analysis.
BILL – am I right about this reluctance? If so, what is the reason for it and what would it take for you to overcome it?
“Cutting interest rates reduces the short term bias of decision making.”
I can guarantee you it doesn’t.
“I can guarantee you it doesn’t.”
Really? By what mechanism? Do you really think 21st century businesses make investment decisions based on an assumption of interest rates at 1980s levels? Or by low interest rates causing some other factor to counteract this effect?
“Really? By what mechanism? ”
By actually having worked in one.
So you’ve actually worked in one business. Big deal! That doesn’t make you an expert on what happens in every business. Extraordinary claims (like that decreasing the cost of finance doesn’t encourage businesses to make long term investments) require extraordinary evidence. Mentioning a single business counts for nothing.
“Extraordinary claims (like that decreasing the cost of finance doesn’t encourage businesses to make long term investments) ”
I would consider that an extra-ordinary claim that requires evidence. Preferably in a room full of real businessmen so that I can see your red face when they all fall about laughing.
And with 20 years on the clock doing this sort of thing I’ve been in slightly more than one business.
In business six months is a long time. Three years is an eternity.