I haven't provided detailed commentary on the US labour market for a while now. To…
Australia continues to endure a very weak labour market
Today’s release by the Australian Bureau of Statistics (ABS) of the Labour Force data for September 2012 reveals a labour market that is weak and failing to produce jobs to match the pavce of the underlying population growth. Many commentators are suggesting today’s figures are not that bad – but that just shows how far we have lowered our expectations of what good is. It is unambiguously bad when an economy that is meant to be in the throes of the once-in-a-hundred-years mining boom cannot even generate employment growth to match the population growth. It is true that participation rose this month which added to the rise in unemployment. But the trend performance of the labour market is flat and these monthly shifts are fluctuating around that flat trend. The data is not consistent with any notions that the Australian labour market is booming or close to full employment. The most continuing feature that should warrant immediate policy concern is the appalling state of the youth labour market. My assessment of today’s results – worrying with further weakness to come. The government has no case to make for its pursuit of a budget surplus in the next fiscal year.
The summary ABS Labour Force (seasonally adjusted) estimates for September 2012 are:
- Employment increased 14,500 (0.1 per cent) with full-time employment rising by 32,100 and part-time employment falling by 17,700.
- Unemployment increased 38,800 (6.2 per cent) to 662,700.
- The official unemployment rate rose to 5.4 per cent from the August figure of 5.1 per cent.
- The participation rate increased by 0.2 pts to 65.2 per cent reversing last month’s decline of the same magnitude.
- Aggregate monthly hours worked rose by 7.6 million hours (0.47 per cent).
- The ABS broad labour underutilisation estimates (the sum of unemployment and underemployment) which are published on a quarterly basis (latest data published in August release) showed that the total labour underutilisation rate was 12.4 per cent in the third-quarter 2012. This will have risen in September because of the rise in unemployment, which would have been marginally offset by a possible fall in underemployment given the growth in full-time employment and hours worked.
The ABC National News Report – Unemployment jumps on rising participation – said that:
The unemployment rate jumped to its highest level in almost two-and-a-half-years in September, but the news on jobs was not all bad … However, the rise in unemployment was not caused by job losses in September … Instead, the rise in unemployment was caused by a 0.2 percentage point rise in the participation rate to 65.2.
Which is only partially true. As I show below, the weak employment growth was insufficient to absorb the underlying growth in the labour force due to population growth and that meant unemployment would have risen even if the participation rate had have remained unchanged.
However, the bulk of the rise in unemployment is due to rise in the participation rate – which is just a reversal on the decline in the participation rate of the same magnitude last month.
But it is bad when an economy that is meant to be in the throes of the once-in-a-hundred-years mining boom cannot even generate employment growth to match the population growth.
The Sydney Morning Herald report (by Chris Zappone) – JJobless rate moves higher in September – said:
But while the headline number shows a big jump in joblessness, the news is not all bad. The economy actually added 14,500 jobs for the month … The rise in the jobless rate was, economists said, due to a jump in the participation rate – the percentage of people either in work or looking for work – to 65.2 per cent, from 65.0 per cent.
I repeat – employment growth is weak and the monthly shifts in participation are relatively meaningless. The fact is that participation is down on where it was 12 months ago because trend employment growth is flat.
Employment growth – negative and trend is pointing down
The September data shows that employment growth was very weak again with total employment rising by by 14,500 (0.1 per cent) – full-time employment rose by 32,100 but part-time employment decreased by 17,700. The only good sign was that full-time employment and hours worked rose.
Today’s data reasserts the message that the labour market data is switching back and forth each month with an sluggish (slightly negative) underlying trend being fairly stable for some months now.
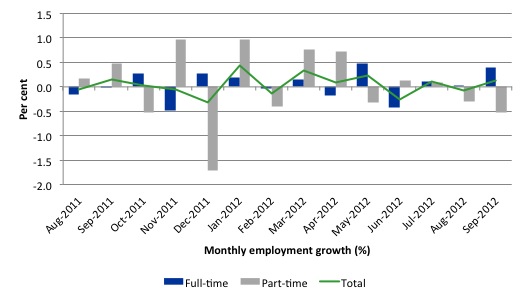
There have been considerable fluctuations in the full-time/part-time growth over the last year with regular crossings of the zero growth line
The following graph shows the month by month growth in full-time (blue columns), part-time (grey columns) and total employment (green line) for the 12 months to September 2012 using seasonally adjusted data.
Today’s results just repeat the topsy-turvy nature of the data over the period shown. The Australian labour market is struggling with the low GDP growth creating a near jobless growth environment.
While full-time and part-time employment growth are fluctuating around the zero line, total employment growth is still well below the growth that was boosted by the fiscal-stimulus in the middle of 2010.
The following table provides an accounting summary of the labour market performance over the last six months. The monthly data is highly variable so this Table provides a longer view (over the last 6 months) which allows for a better assessment of the trends. WAP is working age population (above 15 year olds). The first three columns show the number of jobs gained or lost (net) in the last six months.
The conclusion – overall only 27.3 thousand jobs (net) have been created in Australia over the last six months with 34 thousand full-time jobs being offset by the loss of 6.7 thousand part-time jobs (net). This is a very miserable employment growth performance.
The WAP has risen by 126 thousand in the same period while the labour force rose by 60.3 thousand. The relatively weak employment growth has not been able to keep pace with the underlying population growth and unemployment has risen as a result (by 33 thousand).
The rise in unemployment would have been greater had not the participation rate fallen (by 0.12 percentage points), which reduced the growth in the labour force.
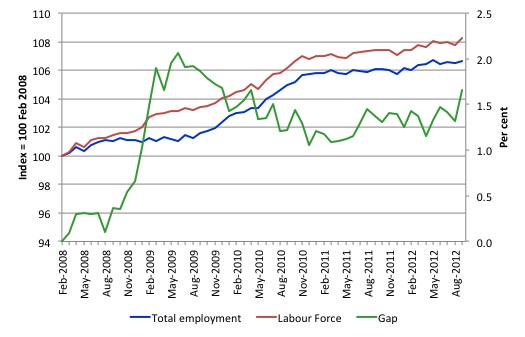
To put the recent data in perspective, the following graph shows the movement in the labour force and total employment since the low-point unemployment rate month in the last cycle (February 2008) to September 2012. The two series are indexed to 100 at that month. The green line (right-axis) is the gap (plotted against the right-axis) between the two aggregates and measures the change in the unemployment rate since the low-point of the last cycle (when it stood at 4 per cent).
You can see that the labour force index has largely levelled off and now falling and the divergence between it and employment growth has been relatively steady over the last several months with this month showing some improvement.
The Gap series gives you a good impression of the asymmetry in unemployment rate responses even when the economy experiences a mild downturn (such as the case in Australia). The unemployment rate jumps quickly but declines slowly.
It also highlights the fact that the recovery is still not strong enough to bring the unemployment rate back down to its pre-crisis low. You can see clearly that the unemployment rate fell in late 2009 and then has hovered at the same level for some months before rising again over the last two months.
The gap shows that the labour market is still a long way from recovering from the financial crisis that hit in early 2008. There hasn’t been much progress since November 2010, when the fiscal stimulus started to run out.
Teenage labour market – remains in a parlous state
The teenage labour market continued to slide backwards last month and is now in crisis.
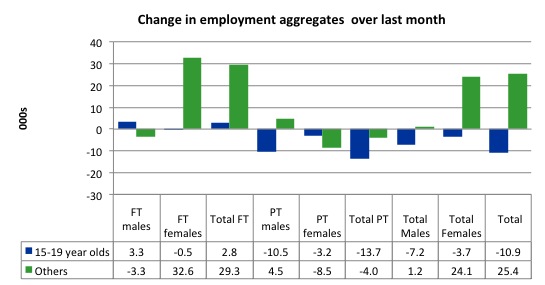
The following graph shows the distribution of net employment creation in the last month by full-time/part-time status and age/gender category (15-19 year olds and the rest)
Over the last month, teenagers lost 10.0 thousand jobs (net) (13.7 thousand part-time jobs lost) while the rest of the workforce lost 25.4 thousand jobs.
The conclusion is that the weak employment growth is providing no opportunities to teenagers to enter the employed workforce.
If you take a longer view you see how poor the situation is.
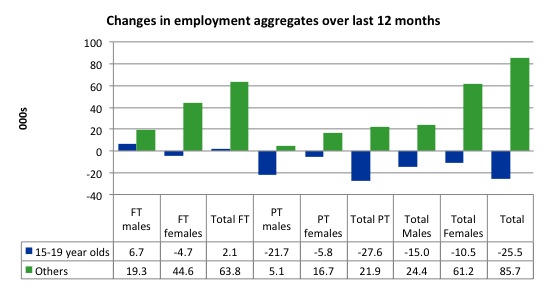
Over the last 12 months, teenagers have lost 25.5 thousand net jobs overall which the rest of the labour force have gained 85.7 thousand net jobs. Teenagers have gained 2.1 thousand full-time opportunities but lost 27.6 thousand part-time opportunities in net terms. So the Australian economy has delivered this cohort
So the Australian labour market has further undermined the opportunities for this cohort over the last year.
The teenage segment of the labour market is being particularly dragged down by the sluggish employment growth, which is hardly surprising given that the least experienced and/or most disadvantaged (those with disabilities etc) are rationed to the back of the queue by the employers.
The following graph shows the change in aggregates over the last 12 months. Australian teenagers are going backwards which is a trend common around the world at present.
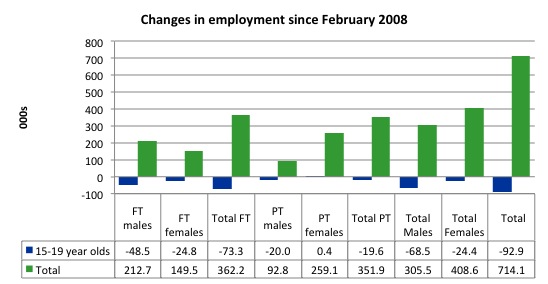
To further emphasise the plight of our teenagers I compiled the following graph that extends the time period from the February 2008, which was the month when the unemployment rate was at its low point in the last cycle, to the present month (September 2012). So it includes the period of downturn and then the “recovery” period. Note the change in vertical scale compared to the previous two graphs. That tells you something!
The results are stunning and represent a major policy failure.
Since February 2008, there have been 714.1 thousand (net) jobs added to the Australian economy but teenagers have lost a staggering 92.9 thousand over the same period. It is even more stark when you consider that 73.3 thousand full-time teenager jobs have been lost in net terms. Even in the traditionally, concentrated teenage segment – part-time employment – there have been 19.6 thousand jobs (net) lost.
Further, around 49 per cent of the total (net) jobs added since February 2008 have been part-time.
Overall, the performance over the last 12 months is poor and should receive a much higher priority in the policy debate than it does.
The longer-run consequences of this teenage “lock out” will be very damaging.
The Australian government has no coherent strategy to resolve this appalling state. Ensuring teenagers are included in paid work, if they do not desire to remain in school, should be a number one policy priority.
The Government’s response is to push this cohort into endless training initiatives (supply-side approach) without significant benefits. The research shows overwhelmingly that job-specific skills development should be done within a paid-work environment.
I would recommend that the Australian government announce a major public sector job creation program aimed at employing, in the first instance, all the unemployed 15-19 year olds.
It is clear that the Australian labour market continues to fail our 15-19 year olds. At a time when we keep emphasising the future challenges facing the nation in terms of an ageing population and rising dependency ratios the economy still fails to provide enough work (and on-the-job experience) for our teenagers who are our future workforce.
Unemployment
The unemployment rate rose by 0.3 percentage points in September 2012 to 5.4 per cent. The rise in unemployment was due, in part, to the employment growth being slower than the underlying population growth. But the overall reason for the rise in unemployment was the rise in the participation rate (a correction on last month’s fall).
Overall, the labour market still has significant excess capacity available in most areas and what growth there is is not making any major inroads into the idle pools of labour.
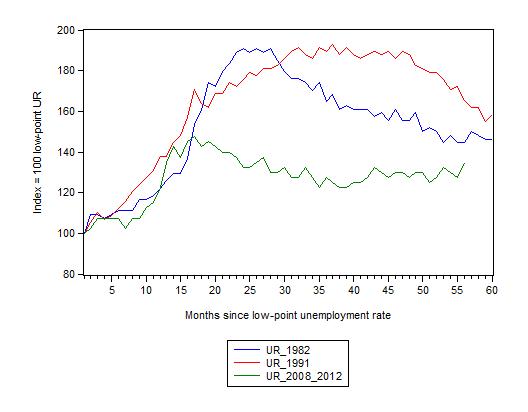
The following graph updates my 3-recessions graph which depicts how quickly the unemployment rose in Australia during each of the three major recessions in recent history: 1982, 1991 and 2009 (the latter to capture the 2008-2010 episode). The unemployment rate was indexed at 100 at its lowest rate before the recession in each case (September 1981; December 1989; April 2008, respectively) and then indexed to that base for each of the months as the recession unfolded.
I have plotted the 3 episodes for 55 months after the low-point unemployment rate was reached. For 1991, the end-point shown is the peak unemployment which was achieved some 38 months after the downturn began although the recovery was painfully slow. While the 1982 recession was severe the economy and the labour market was recovering by the 26th month. The pace of recovery for the 1982 once it began was faster than the recovery in the current period.
It is significant that the current situation while significantly less severe than the previous recessions is dragging on which is a reflection of the lack of private spending growth and declining public spending growth.
The graph provides a graphical depiction of the speed at which the recession unfolded (which tells you something about each episode) and the length of time that the labour market deteriorated (expressed in terms of the unemployment rate).
From the start of the downturn to the 56-month point (to September 2012), the official unemployment rate has risen from a base index value of 100 to a value 135 – peaking at 145 after 21 months. It has been hovering at the current level for some months now. Unlike the other episode, the current trend, at this stage of the cycle, is unclear.
At 56 months, 1982 index stood at 144 and falling steadily, while the 1991 index was around 165, also falling steadily. It is clear that at an equivalent point in the “recovery cycle” the current period is more sluggish than our recent two major downturns.
Note that these are index numbers and only tell us about the speed of decay rather than levels of unemployment. Clearly the 5.1 per cent at this stage of the downturn is lower that the unemployment rate was in the previous recessions at a comparable point in the cycle although we have to consider the broader measures of labour underutilisation (which include underemployment) before we draw any clear conclusions.
The notable aspect of the current situation is that the recovery is very slow.
Aggregate participation rate rises in September
The participation rate rose by 0.2 percentage points in September 2012 to 65.2 per cent. This reversed the decline of the same magnitude in August 2012. It remains 0.3 percentage points lower than it was 12 months ago.
It is still substantially down on the most recent peak of 66 per cent (November 2010) when the labour market was gathering pace courtesy of the fiscal stimulus.
This drop in participation in the last year or more has meant the labour force growth has been relatively subdued with the additional result being that the unemployment rate is considerably lower than would otherwise been the case.
In the current month, unemployment rose by 38.8 thousand to 5.4 per cent of the labour force. How much of that is due to the rise in participation and how much is due to the weak employment growth failing to keep pace with the underlying population growth?
The labour force is a subset of the working-age population (those above 15 years old). The proportion of the working-age population that constitutes the labour force is called the labour force participation rate. So changes in the labour force can impact on the official unemployment rate and so movements in the latter need to be interpreted carefully. A rising unemployment rate may not indicate a recessing economy.
The labour force can expand as a result of general population growth and/or increases in the labour force participation rates.
The following Table shows the breakdown in the changes to the main aggregates (Labour Force, Employment and Unemployment) and the impact of the rise in the participation rate.
In September 2012, employment rose by 14,500 while the labour force rose by 53,300, which meant that unemployment rose by 38,800.
The labour force rose in September for two reasons: (a) The underlying population growth added 29.1 thousand to the labour force. The population growth impact on the labour force aggregate is relatively steady from month to month; and (b) the participation rate rise led to an increase in the labour force of 24.2 thousand (relative to what would have occurred had the participation rate remained unchanged).
Clearly, employment growth was not sufficient to match the underlying population growth (a deficiency of 9.7 thousand).
But if the participation rate had not have increased, at the current employment level, unemployment would have been 623.8 thousand instead of 662.7 thousand as recorded by the ABS.
So if the participation rate had have remained unchanged, the unemployment rate would have been 5.1 per cent rather than 5.4 per cent as officially published.
The conclusion is that the rise in unemployment would have been much just 9.7 thousand had not the rise in labour force participation occurred.
Hours worked barely rose in September 2012
Aggregate monthly hours worked fell by 7.6 million hours (0.47) per cent) in seasonally adjusted terms and the trend is now firmly down and signalling a labour market that is deteriorating.
The small swings up and down in monthly hours worked each month since the beginning of 2011 is being driven by similar fluctuations in full-time employment.
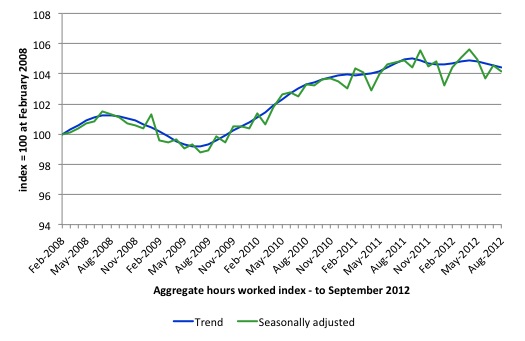
The following graph shows the trend and seasonally adjusted aggregate hours worked indexed to 100 at the peak in February 2008 (which was the low-point unemployment rate in the previous cycle). The rising trend which marked the early recovery courtesy of the fiscal stimulus is now clearly gone.
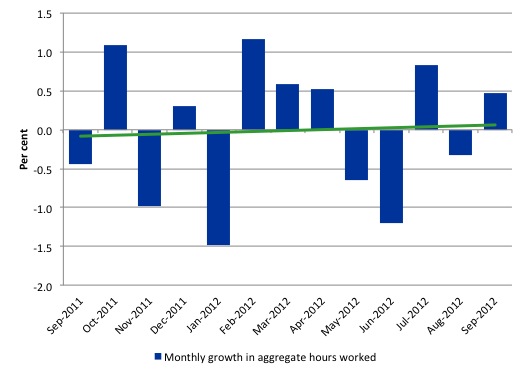
The next graph shows the monthly growth (in per cent) over the last 12 months. The green linear line is a simple regression trend – firmly down.
Once again the data doesn’t support the notion of a fully employed labour market that is bursting against the inflation barrier.
Conclusion
Overall, today’s data confirms that the labour market is weak and fluctuating around a zero employment growth trend. Employment growth is clearly not strong enough to even match the pace of growth of the underlying population let alone eat into the huge pool of unemployment and underemployment.
Variations in the participation rate from month to month are then driving rises or falls in the unemployment around a slightly increasing trend.
That pattern has been evident for the last 18 months or so and leads to the conclusion that the labour market is weak and trending towards increased weakness.
We always have to be careful interpreting month to month movements given the way the Labour Force Survey is constructed and implemented. But the underlying trend is weak as a result of the withdrawal of the fiscal stimulus undermining employment growth.
The most striking aspect of a sad picture remains the appalling performance of the teenage labour market. Employment has collapsed for that cohort and I consider it a matter of policy urgency for the Government to introduce an employment guarantee to ensure we do not continue undermining our potential workforce.
The data certainly doesn’t support the Federal Government’s current macroeconomic settings, which are biased towards contraction. More fiscal stimulus is definitely needed.
The blog is earlier than usual because I am now 1.5 hours behind Canberra (Darwin is normally 30 minutes behind but also doesn’t have daylight saving in Summer). So I get to see the data earlier in the working day than usual!
That is enough for today.
(c) Copyright 2012 Bill Mitchell. All Rights Reserved.


Bill –
True.
False. More stimulus is definitely needed, but (unlike in Europe and America) monetary stimulus would be as effective as fiscal stimulus. Indeed there are very good reasons why monetary stimulus is preferable. Having interest rates significantly higher than the rest of the world has resulted in the carry trade pushing the Aussie dollar higher than can be justified by our trade balance. Cutting interest rates would alleviate that problem, whereas increasing government spending would not.
Of course the job creation rate is lagging behind population increase.This is because the population increase is being force fed by an insane immigration policy.
Any rational person who looks with unblinkered vision at the state of Australia,environmentally and socially,would see that we have too high a population already.
Of course the youth unemployment rate is a disaster but it is just part of the social disaster which exists in cities,towns and even remote rural areas.And here we are,importing more of the same from some of the most noxious societies on the face of the Earth.
So what is the rationale behind this mismangement? I don’t think there is any. The perpetrators are not rational.
one of the pics is broken
@Aidan, fwiw here is John Maynard Keynes take on loose monetary policy:
“By a continuing process of inflation, governments can confiscate, secretly and unobserved, an important part of the wealth of their citizens. By this method they not only confiscate, but they confiscate arbitrarily; and, while the process impoverishes many, it actually enriches some.
The sight of this arbitrary rearrangement of riches strikes not only at security but at confidence in the equity of the existing distribution of wealth. Those to whom the system brings windfalls, beyond their deserts and even beyond their expectations or desires, become “profiteers,” who are the object of the hatred of the bourgeoisie, whom the inflationism has impoverished, not less than of the proletariat.
As the inflation proceeds and the real value of the currency fluctuates wildly from month to month, all permanent relations between debtors and creditors, which form the ultimate foundation of capitalism, become so utterly disordered as to be almost meaningless; and the process of wealth-getting degenerates into a gamble and a lottery.
Lenin was certainly right. There is no subtler, no surer means of overturning the existing basis of society than to debauch the currency. The process engages all the hidden forces of economic law on the side of destruction, and does it in a manner which not one man in a million is able to diagnose.”
Esp Ghia, I think you’ve misattributed it – that doesn’t look to me like something JMK would have said.
But regardless of who said it, that’s not a criticism of loose monetary policy, nor of loose fiscal policy, but rather an extremely loose combination of the two – although with gross economic mismanagement it may be achievable by fiscal policy alone.
It’s totally irrelevant to Australia’s situation where the combination of fiscal and monetary policy is too tight.
Correction to the above: I’ve checked and it was JMK.
Also, Greece’s unemployment rate increased to 25.1% in July up from 24.8 percent in June. Youth unemployment is at 54.2%.
You’ll find that quote in “The Economic Consequences of the Peace” written in 1920 on page 92. Keynes attended versailles on behalf of the British Treasury and argued for a more generous peace. This was an early Keynes who was still developing who had yet to see the Great Depression and World War 2 or write The General theory later in 1936. http://en.wikipedia.org/wiki/The_Economic_Consequences_of_the_Peace
@Aidan, JMK was specifically discussing monetary policy – not fiscal policy, nor a combination of the two.
Separately, I disagree with your view that monetary policy is too tight in Australia. Our fiscal settings, however, do seem inappropriate – I would be slashing taxes across the board AND giving handouts to those with very high propensities to consume (as during the GFC). Cheers.
Esp Ghia, Keynes could not have been discussing monetary policy, as that is insufficient to debauch a currency – the only way a nation’s currency can collapse when their government’s running a balanced budget is if there’s widespread counterfeiting!
On what grounds do you disagree that monetary policy’s too tight in Australia? Do you dispute that our dollar is higher than our trade balance would justify? Or that that’s because of the carry trade? Or that it’s largely a result of our interest rates being higher than those of other countries?
“Do you dispute that our dollar is higher than our trade balance would justify?”
There’s no guarantee that is what sets the exchange rate. The UK’s exchange rate is higher than the trade balance would strictly justify, and we have interest rates bumping along the bottom.
There is no accepted theory of exchange rates.
Neil Wilson, I never claimed there was a theoretical guarantee, but there seems to be both strong evidence and widespread acceptance that this is what had that particular result in Australia.
As for Britain, expect the pound to fall further!
“As for Britain, expect the pound to fall further!”
I’ll believe you when you’re telling me that from your private island bought with your fx trading proceeds.
@Neil
Maybe Sterlings value is dependent on non sov euro states….if they become sov again and internalise domestic demand and rational investment what happens to Sterling ?
Its a interesting dynamic is it not ?
Nothing must happens in the UK yet London is a gigantic european consumer goods vaccum cleaner.
http://www.rail.dbschenker.co.uk/
DB Schenker Rail launches second weekly rail freight service between UK and Poland
Tuesday 09 October 2012
“DB Schenker Rail has strengthened trading links between the UK and Poland with the introduction of a second weekly rail freight service between the two countries.
“By a continuing process of inflation, governments can confiscate, secretly and unobserved, an important part of the wealth of their citizens. By this method they not only confiscate, but they confiscate arbitrarily; and, while the process impoverishes many, it actually enriches some. JMK via Esp Ghia
Actually, small continual inflation of the money supply would be far better than our current elastic money supply which expands too much in the boom and not enough or not at all in the bust.
He was indeed – I find it a little bizarre that you would question that. You should also note that JMK never went on to retract those remarks. I really wish that JMK had lived into the 1950s…
In terms of monetary policy, I like the idea of Australia having a non-zero rate of interest. The emergency cuts to the cash rate during the GFC worked unusually quickly (along with the handouts, which I was very much in favour of) to prevent a deep recession. On the flip side, the cuts re-inflated the property bubble – you can’t win ’em all!
@Aiden. Clearly the last round of rate cuts and the 100bp of further rate cuts priced in have barely budged the Aussie dollar. It is also becoming clearer that like the rest of the world, cuts in interest rates are having / will have little impact to any on the Aussie economy. Time will only tell but when you dont have confidence that asset prices will rise, you can take rates to zero and asset prices will continue to fall.
He was indeed – I find it a little bizarre that you would question that. Esp Ghia
Even though Keynes believed in budget deficits during the bust he believed in budget surpluses during the boom. But budget surpluses by the monetary sovereign destroys reserves which is an odd thing to do. It strongly implies that too many reserves were created else why destroy any? And is it really helpful in moderating the boom since banks are not reserve constrained anyway?
TokyoJez, the last round of cuts was far too late, and an expectation of a 100bp rate cut some time in the future probably is rather less effective than an expectation they’ll have cut it that much before the end of summer, with an abandonment of the bias against future cuts. But I don’t think they should go down to zero, as it would be inefficient to loan the money out when the government can instead spend it on something that gets a better rate of return, and anything with ongoing net benefits would be better than zero.
Esp Ghia, thoughh a non zero rate of interest is desirable, room to cut rates further is unnecessary because a fiscal stimulus alone would be sufficient. I’m not convinced the current property situation in Australia is a bubble – but regardless of whether it is, the best way to slow the long term price increase would be to phase out the GST and replace it with broad based land value taxation.
And even if what JMK was talking about was classified as monetary policy at the time, today it would be classified as a combination of monetary and fiscal policy.
F. Beard, reserves are largely irrelevant. Budget surpluses by the sovereign reduce the total amount of money in circulation. This allows interest rates to be cut, increasing the total amount of money in circulation, or even just held steady (when a rise would otherwise be necessary) without any additional inflationary impact. So Keynes was right: surpluses in the boom (and arguably in normal times) are a good thing.
“This allows interest rates to be cut, increasing the total amount of money in circulation,”
Cutting interest rates doesn’t necessarily increase the amount of money in circulation. The mechanisms by which that happen are subject to other forces and the net can be worse.
Plus it pushes more and more private debt – which is clearly destablising and has a finite limit.
Neil Wilson, in normal circumstances at least, cutting interest rates does necessarily increase the amount of money in circulation, because the amount in circulation depends on how much banks can lend profitably, and it’s more profitable for businesses to borrow when intereest rates are low because they don’t have to make so much money from the equipment they invest in.
That private debt has a finite limit is irrelevant, because if that limit does indeed exist, we’re nowhere near it at the moment.
“in normal circumstances at least, ”
Normal circumstances being ever increasing private debt levels which are unsustainable.
That’s not normal – it is a 40 year aberration.
“and it’s more profitable for businesses to borrow when intereest rates are low”
That rather depends upon what they are charging. It is profitable for businesses to borrow when they can sell off that investment at the margin they require *regardless* of the price of money.
Businesses are turn based. They take inputs and transform them into outputs for a margin. It’s the relative value of the inputs and outputs that matter.
Which is precisely the situation we have at the moment. Interest rates may be low, but demand is lower so the turn is insufficient to make it worth the candle.
You say they’re unsustainable, but there’s no reason why that should be so if productivity keeps improving. And whether they’re sustainable in the long term or not, they’re certainly sustainable in the short term. If and when they can’t be sustained, fiscal policy can fill the gap.
It’s normal when there’s a fiat currency.
No, typically the equipment that businesses borrow to acquire can not be sold at a profit (unless the business itself is broken up, and often not even then). But because having it reduces the cost of their inputs, it’s worth having as long as the cost of having it isn’t too high. And the lower the interest rates are, the lower the cost of having the equipment is.
And I know Britain’s in the situation where insufficient demand is the limiting factor, but I made it very clear that I was referring to Australia, where that’s not the case. The circumstances of Britain (and indeed Europe and America) are not normal – rather they are the result of inadequate fiscal stimulus in the GFC. Australia had adequate fiscal stimulus and recovered quickly, only for that recovery to be threatened by monetary policy being too tight.
“You say they’re unsustainable, but there’s no reason why that should be so if productivity keeps improving.”
Not sure why you’re here then if you don’t accept Minsky. MMT is very much based on the outcomes predicted by the instability hypothesis.
“No, typically the equipment that businesses borrow to acquire can not be sold at a profit”
Bad turn of phrase, sorry. ‘Sell off’ as in ‘generate turnover’. Apologies for using an inappropriate colloquialism.
“And I know Britain’s in the situation where insufficient demand is the limiting factor, but I made it very clear that I was referring to Australia, where that’s not the case”
The level of unemployment suggests otherwise. There is clearly insufficient demand.
Neil Wilson, I’m here because Bill has correctly identified errors in the assumptions that economists make that effect the way countries are run, and I am keen to discover more about the implications. Therefore I’m rather annoyed when Bill keeps making the same error over and over again!
I don’t know much about Minsky, but I know he made a distinction between different types of debt and didn’t see all debt as a problem. And as government policy can compensate for, and even exploit, instability, I don’t see it as a big problem.
It’s not just your turn of phrase that’s wrong it’s the point you were making. If the cost of borrowing money exceeds the amount of money the business can make from it, it will not be profitable for the business to borrow.
Australia recovered from the GFC. now (as I said) there’s a separate problemstemming from monetary policy being too tight. Demand is low, but not so low that cutting interest rates won’t fix the problem. We can let the string much further out without reaching the situation where we’re pushing on it.
” If the cost of borrowing money exceeds the amount of money the business can make from it, it will not be profitable for the business to borrow.”
And my point was that has nothing to do with the rate of borrowing and everything to do with the ‘turn’ the business can make on the investment.
It doesn’t matter if interest rates are high or low. It matters whether the business has demand for its output at the price it wants to charge. Thus you have high demand during bubble mania regardless of high interest rates, and no demand now regardless of low interest rates.
I would suggest a couple of years working in a real business selling real products to understand how pricing and borrowing work in the real world. The standard economic pronouncements are frankly a load of rubbish.
So they refuse to cut thier prices to sell more, and they don’t take the cost of financing into account? That reminds me of a video I once saw where John Cleese played the managing director of a failed startup. Now you’re trying to tell me that’s typical business behaviour? Struth, no wonder British manufacuting’s in such a dire state!
“So they refuse to cut thier prices to sell more, and they don’t take the cost of financing into account?”
They take the cost of financing into account but not in the way you believe – it really isn’t that important for the majority of business decisions. Other costs, mostly staff, are a much bigger concern. And yes the vast majority of business is not done on price. Price is merely a ‘hygiene factor’ with a surprisingly large acceptable range. Other factors are much more important when securing a deal. That is something you don’t realise until you’ve worked at the sharp end of creating and running a business – most markets are not commodities.
The standard line in accountancy and consultancy, for example, is that to increase your turnover it is best to double your charging rate. Why? Because it makes you look like you *really* know what you are talking about. As a strategy it sounds completely barking, but the strange thing is that it does actually work – as long as your swagger matches the number.
The Post Keynesian markup theories are much more in keeping with how price is set in the real world.
As for British manufacturing, it is actually in pretty rude health. There is a reason that the world’s aircraft have ‘Rolls Royce’ engines and its not just that their salesmen actually know how to sell abroad…