I grew up in a society where collective will was at the forefront and it…
The US labour market has improved but more stimulus is required
On Tuesday I provided some analysis in this blog – US labour market is in a deplorable state – of the latest US Bureau of Labor Statistics Employment Situation release for September 2012. Today, I add some more calculations and analysis that I didn’t get time to write up for that blog. The UK Guardian article (October 17, 2012) – US jobs data reveals economy is bouncing back strongly from recession – would appear, on first appearances (comparing titles), to be at odds with the message I imparted in the Tuesday blog. But on closer inspection you will see that the message is consistent across both pieces of analysis. And what I provide today will bring that concordance into relief.
The UK Guardian article says:
The latest US employment data has confirmed that the American economy is on the path to recovery after the recession of 2008-2009, despite the slowdown engulfing other G20 nations.
Indeed, the pace of private sector job growth has been much stronger in this recovery than after the 2001 recession and is comparable to the resurgence after the 1990-1991 slump.
Despite the skepticism about the most recent months’ data – see Tuesday’s blog – US labour market is in a deplorable state – the data has been signalling this for some time now.
The Guardian argues that although there is now employment growth the composition of the pool of unemployed has changed relative to past recessions in the sense that:
… the number of long-term unemployed (27 weeks or longer) is about 40% of the total – the lowest share since 2009 but still far higher than at any time since the 1930s Great Depression and about double what it would be in a normal labour market. So the US labour market, while healing, is still far from where it should be.
Which was my conclusion on Tuesday.
The Guardian says that in “terms of US economic history, what is abnormal is not the pace of private sector job growth since the 2008-2009 recession ended, but rather the length and depth of the recession itself.”
The reason? The collapse in non-government spending was severe and as households have struggled with “sizeable declines in household wealth” and “painful deleveraging”, after a decade or more of falling prey to the financial engineers (credit binge):
… demand has grown slowly, despite unprecedented fiscal and monetary stimulus, and that explains why the unemployment rate remains high. Indeed, businesses cite uncertainty about the strength of demand, not uncertainty about regulation or taxation, as the main factor holding back job creation.
With private demand so muted there has been a need for strong public sector spending support for the economy. What support was given helped it turn the corner and has largely supported growth in the early months of the recovery but:
Public sector demand has also contracted, owing to state and local governments’ deteriorating budgets. As a result, public employment, which usually rises during recoveries, has been a major contributor to high unemployment during the last three years. Despite a modest uptick in the last three months, government employment is 569,000 below its June 2009 level – a 30-year low as a share of the adult civilian population.
So at a time when the public sector should have been leading the recovery and providing the certainty for the private sector as it felt its way back to growth, the governments at all levels have turned towards undermining the recovery.
Why? Blind ideology based on a myriad of myths and lies promoted by the neo-liberals. The political debate has become so mired in nonsensical debates about when the US Federal government is going to run out of money (despite the obvious fact it can never run out of US dollars) that necessary support for the recovery process has not been delivered.
That explains why the unemployed have been stuck and unemployment durations have increased even though employment growth has been positive.
The Guardian article also debunks the latest neo-liberal scam – the so-called “mismatch” theory for the persistently high unemployment. Various right-wing think tanks are putting out all sorts of narratives about all the jobs that are available which cannot be filled.
The Guardian says:
… there is scant evidence to support this view. The relationship between the unemployment rate and the job vacancy rate is consistent with patterns in previous recoveries. Nor is there anything unusual about the size of mismatches between job openings and worker availability by industry.
Such industrial mismatches become larger during recessions, reflecting greater churn in the labour market as workers move between shrinking and expanding sectors; but they decline as the economy recovers. This pattern also characterises the current recovery, and recent data suggest that mismatches between the demand and supply of labour by industry are back to pre-recession levels.
I will write a separate blog about the mismatch arguments and the evidence base that refutes them next week sometime.
The rejection of the mismatch argument doesn’t reduce the case for more investment in education and training, however.
The Guardian article notes that “as the US economy recovers, technological change is accelerating, fuelling demand for more skills at a time when the workforce’s educational attainment levels have plateaued”.
Advanced nations are increasingly facing a skills gap (over and above what happens during a cycle) because of the failure of governments to invest in education. The “we-have-run-out-of-money” narrative typically manifests in a policy sense in cuts to educational spending at a time when dependency ratios are rising and there is a need for highly productive workers to be nurtured.
The Guardian article notes that the “US was the world leader in high school and college graduation rates for much of the twentieth century. Today it ranks in the middle of the OECD countries” and this is due to the “US school system’s failure to ensure high-quality education for disadvantaged Americans, particularly children from poor, minority, and immigrant households”.
That is a government responsibility and needs budget backing. Advanced nations will be left behind if they don’t address the damage that neo-liberal ideology is creating for the future.
Anyway, today I want to extend the evidence base to see what is happening in the US labour market and complete the work I was published in Tuesday’s blog.
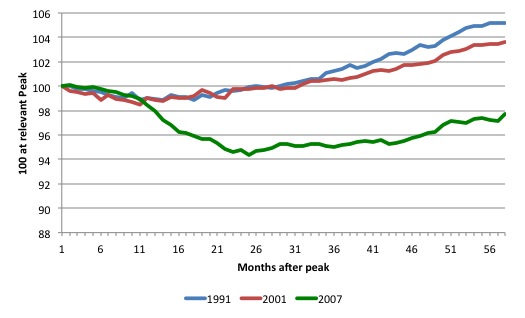
Commentators are quick to produce graphs such as the following which indexes total US employment at the peak of respective economic cycles (in this case July 1990, March 2001 and December 2007) and then tracing the trajectory of the period to the trough and then the recovery.
They make the obvious points:
1. The current recession was much deeper than the previous two (1991 and 2001). The period from peak to trough was March 2001 to November 2001; July 1990 to March 1991, and in the current case, December 2007 to June 2009.
2. They then conclude the recovery is much slower in this case when you consider that the lost jobs gap is huge.
There is obvious truth in those insights and I have made them myself in past blogs
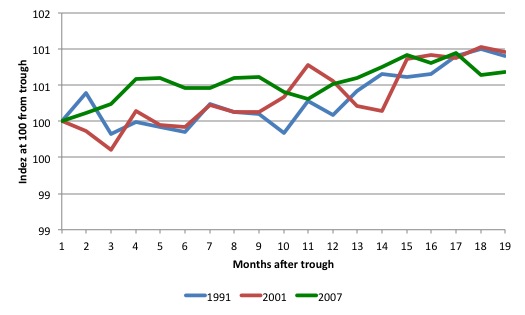
But if you produce the index time series from the respective troughs and then track the months following the turning point – when the labour market started adding jobs again you get a different view. The next graph shows what happens in this case.
From this perspective, the current recovery was initially stronger, faltered a little as the fiscal stimulus was tapering and then kept pace with the previous two episodes.
I conclude from that in the current period:
1. The collapse in non-government spending was more severe than in the previous two recessions.
2. The fiscal stimulus provided by the US Government was far too small at the onset of the downturn.
There is no doubt that when compared to the pre-crisis labour force aggregates – employment, participation, hours worked, unemployment, marginal attachment – the US labour market is in a deplorable state.
But equally, the latest signals are positive. On the face of it, the current recession is much worse for workers than the last two US recessions. How much worse? How much easier it is for an unemployed worker to gain employment now compared to a similar stage in the last 2 recessions? Are new entrants into the labour market more likely to gain employment this recession? What is the chance of a worker losing their job relative to previous recessions?
Are there any signs of significant improvement in the last months?
These sorts of questions can be answered by examining the Gross labour flows that are available from the US Bureau of Labor Statistics. I updated my databases last Tuesday and now have data up to September 2012.
To fully understand the way gross flows are assembled and the transition probabilities calculated you might like to read these blogs – What can the gross flows tell us? and More calls for job creation – but then. For earlier US analysis see this blog – Jobs are needed in the US but that would require leadership
By way of summary, gross flows analysis allows us to trace flows of workers between different labour market states (employment; unemployment; and non-participation) between months. So we can see the size of the flows in and out of the labour force more easily and into the respective labour force states (employment and unemployment).
The various inflows and outflows between the labour force categories are expressed in terms of numbers of persons. But a useful alternative presentation is to compute transition probabilities, which are the probabilities that transitions (changes of state) occur. For example, what is the probability that a person who is unemployed now will enter employment next period.
So if a transition probability for the shift between employment to unemployment is 0.05, we say that a worker who is currently employed has a 5 per cent chance of becoming unemployed in the next month. If this probability fell to 0.01 then we would say that the labour market is improving (only a 1 per cent chance of making this transition).
The following table shows the schematic way in which gross flows data is arranged each month – sometimes called a Gross Flows Matrix. For example, the element EE tells you how many people who were in employment in the previous month remain in employment in the current month. Similarly the element EU tells you how many people who were in employment in the previous month are now unemployed in the current month. And so on. This allows you to trace all inflows and outflows from a given state during the month in question.
The transition probabilities are computed by dividing the flow element in the matrix by the initial state. For example, if you want the probability of a worker remaining unemployed between the two months you would divide the flow (U to U) by the initial stock of unemployment. If you wanted to compute the probability that a worker would make the transition from employment to unemployment you would divide the flow (EU) by the initial stock of employment. And so on.
For the 3 Labour Force states we can compute 9 transition probabilities reflecting the inflows and outflows from each of the combinations.
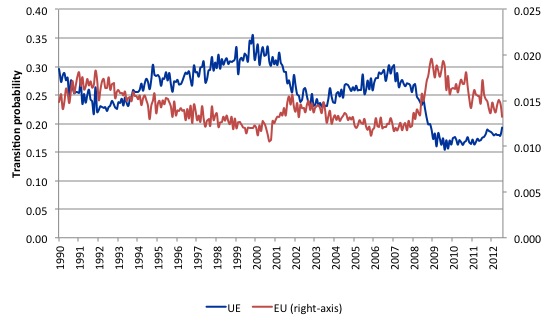
The following graph compares the UE and EU transition probabilities since 1990 to put the recent period into some historical context. The sharp rise in EU and sharp fall in UE in 2007-08 is notable and is moving back towards its historical levels.
What is also evident is that the employment is becoming more secure (EU falling steadily) but the overall real GDP growth rate is not sufficient to clear out the unemployment pool – so the UE likelihood is improving only slowly and remains well below its recent historical levels.
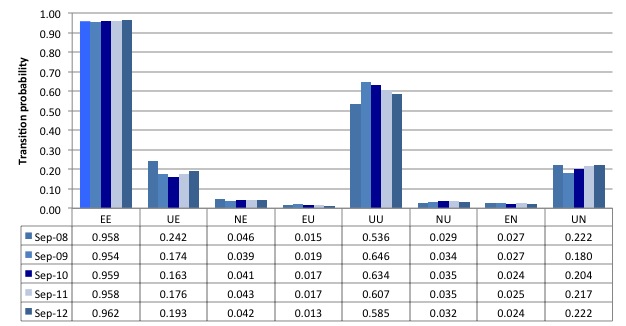
The following graph compares the US transition probabilities across the 8 categories (excluding NN) for the last 5 years as at September (see the accompanying Table for values).
In the last year, the probability of retaining a job (EE) has risen sharply (from 0.958 to 0.962) while the chances of gaining a job if unemployed (UE) has risen sharply (0.176 to 0.193). The UE transition has been improving for the last two years.
The chances of losing one’s job (EU) has now fallen to its lowest value in five years (now at 0.013), while the chances of entering the labour force and gaining a job (NE) is higher than the chances of entering unemployment (NU).
It remains the fact that new entrants (or would-be returning entrants) have not enjoyed a significant change in their chances of gaining employment. We know that hidden unemployment is high in the US at present – given the plunge in the participation rate (see Tuesday’s blog).
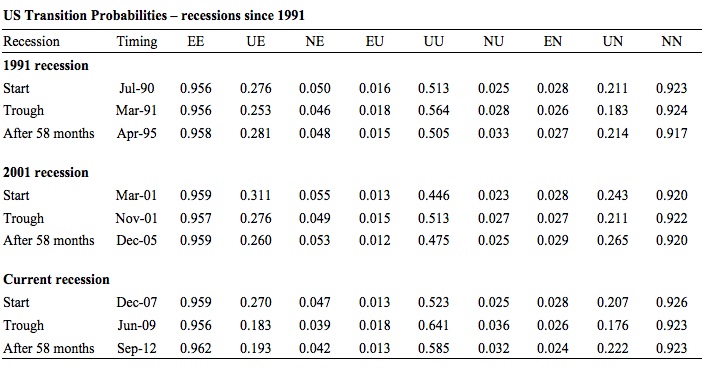
The following Table compares the three recessions in terms of the gross flow transition probabilities as at the start, the trough (when the NBER declared the recession over) and 58 months after the crisis began (September 2012 is 58 months into the current crisis).
The 9 transition probabilities tell an interesting story.
First, for those in employment, the situation is broadly similar in the last two recessions – an initial decline in the likelihood of an employed worker keeping their job (EE) of the same order of magnitude and a similar probability after 58 months. The current recession indicates that the transition probabilities at the peak were higher than in 1991 but the same as 2001. At the trough it was harder to keep a job in the current recession than in 2001 but the same as in 1991.
The important difference is that after 58 months there is a higher likelihood of employed workers remaining employed now than in the past two recessions. The difference is notable. This probability (EE) has increased sharply in the last few months.
Second, the probability of an unemployed worker entering employment (UE) is very different this time around. The drop in this probability in 1991 and 2001 was nowhere near the order of magnitude that has been experienced this time around. The common feature is that even after the recovery officially began, UE continued to decline in the 2001 and 2007 recessions indicating that other adjustments were going on (other than unemployed taking jobs).
But the improvement in UE in the previous recessions was more marked than the current recession (in the last 20 months or so). However, in the last 12 months the chances of an unemployed person gaining employment have jumped significantly (from 0.176 to 0.193).
Third, an unemployed worker has a much higher likelihood of remaining in that state (UU) after 58 months this time compared to previous recessions. The decline in that transition likelihood has been quite slow in the last year.
Fourth, new entrants to the labour market are more likely to enter unemployment (NU) than employment (NE) at present which reduces the capacity of individuals to gain essential job experience (especially out of school).
Fifth, unemployed workers are more likely to exit the labour force (UN) than gain employment (UE) now.
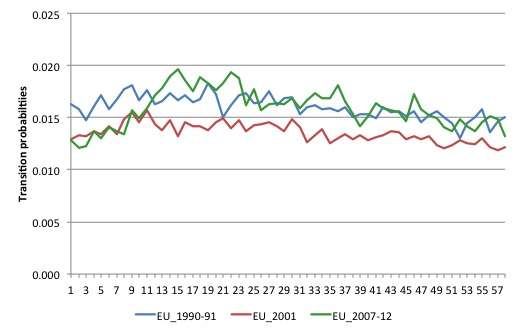
To gain a dynamic view of how each recession unfolded I plotted selected transition probabilities from the start of each of the recessions to the 58 month-point (so in effect – filling in the gaps in the previous Table).
The first graph shows the EU transition – the probability that an employed person will become unemployed. The major observation is how quickly the current recession deteriorated as it became clear that fiscal stimulus was not going to be sufficient.
But the behaviour in the transition probability (that is, the improvement) after the initial surge has been similar to the 1991 recession and not dissimiliar in trajectory to the 2001 recession (after taking into account slightly higher levels).
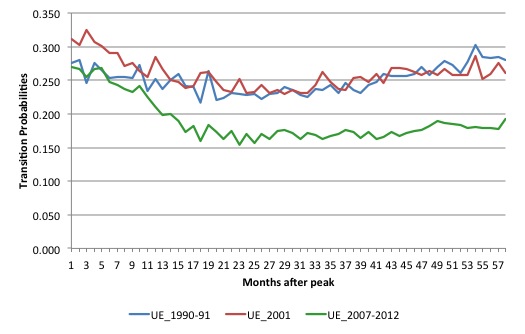
The next graph shows the UE transition probabilities – – the probability that an unemployed person will become employed. This is when you really see what happened in the current recession.
The previous recessions behaved fairly similarly. For around 18 months the likelihood that an unemployed worker would gain employment in the next month fell and then as growth intensified the UE probability slowly rose again.
The experience this time around is very different. The decline has been more severe and the improvement is very slow. This tells me, along with the other evidence presented here and on Tuesday, that the labour market is stabilising and for those with jobs already the crisis is abating.
But for those who are unemployed, the chances of gaining work are only slowly improving as the economy struggles to maintain momentum in the face of tapering fiscal inputs at both the State and local and Federal levels.
As noted above, there is a need for a significant jobs-rich fiscal stimulus to really push the labour market to a higher plane.
Conclusion
After the crisis began the US economy was saved from a major depression by the initial fiscal stimulus. There is no doubt about that. However, because the stimulus was not of a sufficient magnitude nor swift enough (in its targetting of employment growth), the economy only slowly ground its way towards growth and the labour market was stuck in a very persistent recessed state with only slight improvements occurring.
Unlike Europe and the UK, however, the austerity ambitions of the Congress have yet to be inflicted on the US economy and the continuing fiscal support allowed growth to resume.
The fiscal support is now waning and while consumers are showing some signs of confidence, overall employment growth is following the output growth slowdown.
It remains to be seen whether the confidence in the private sector stalls or can arrest the decline.
Only a short blog today as I have a long flight to make this afternoon.
That is enough for today!
(c) Copyright 2012 Bill Mitchell. All Rights Reserved.

Dear Bill,
I think you made a mistake in one of your statements. Here it is:
“Fourth, new entrants to the labour market are more likely to enter unemployment (NU) than employment (NE) at present which reduces the capacity of individuals to gain essential job experience (especially out of school). ”
But, the numbers for NU after 58 months are: 0.032
and the numbers for NE after 58 months are: 0.042
It seems that new entrants are more likely to enter employment (NE) than unemployment (NU), which seems the converse of your quoted statement above.
Sincerely,
Justin Holt
Dear Bill,
In a future blog, could you explain the apparent contradiction: if as you say private demand is muted, and the government sector is undermining any recovery, why is private employment recovering at a pace similar to that of the previous two recessions?
In New Zealand the unemployment rate is expected to hit the 7% and stay there for some considerable time. Very depressing.We have a rabid neo-liberal media, a government who has enshrined in law back in 1990s a fiscal responsibility act to limit what any future government might be able to do.Neo-liberal doctrine is the only game in town.But more depressing is the ignorance that all politicians share regarding the workings of the monetary system. The opposition finance spokeperson admitted he didn’t have a clue on basic monetary matters! Bill do you know anyone, economist or otherwise promoting M.M.T. in N.Z.
Paul Krugman’s take on unemployment statistics: http://krugman.blogs.nytimes.com/2012/10/06/constant-demography-employment-wonkish-but-relevant/
And also Brad Delong has this graph http://delong.typepad.com/.a/6a00e551f080038834017744a31ed5970d-pi
Then there is this http://moslereconomics.com/2012/05/04/disabled-americans-shrink-size-of-u-s-labor-force/
“The number of people collecting disability surged as the economy contracted, with the share of the U.S. population between the ages of 25 and 64 on SSDI climbing to a record-high 5.3 percent in March from 4.5 percent in 2007.”