I am late today because I am writing this in London after travelling the last…
Australian labour force data – weak and weakening
Last month my Labour Force commentary was entitled – Australian labour market – good signs but wait for the reversal. It didn’t take very long for the reversal to come, although I caution anyone drawing trends from month-to-month variations in this sort of data. Today’s release by the Australian Bureau of Statistics (ABS) of the Labour Force data for June 2012 reveals a weakening labour market with all the negative signs concurring – falling full-time employment, falling participation, falling hours worked and rising unemployment. If the labour force had not have contracted due to the falling participation rate, the unemployment rate would have been closer to 5.5 per cent rather than 5.2 as officially recorded. Certainly this data is not consistent with any notions that the Australian labour market is booming or close to full employment. The most continuing feature that should warrant immediate policy concern is the appalling state of the youth labour market. My assessment of today’s results – weak and weakening.
The summary ABS Labour Force (seasonally adjusted) estimates for June 2012 are:
- Employment decreased 27,000 (0.2 per cent) with full-time employment fallling by 22,500 (wiping out 2/3 of the gains made last month) and part-time employment increased by 6,600.
- Unemployment rose by 7,200 (1.1 per cent) to 631,300 even with a sharp fall in the participation rate.
- The official unemployment rate rose to 5.2 per cent from 5.1 per cent.
- The participation rate decreased by 0.2 pts to 65.2 per cent.
- Aggregate monthly hours worked decreased sharply by 19.6 million hours (1.2 per cent).
- The ABS broad labour underutilisation estimates (the sum of unemployment and underemployment) which are published on a quarterly basis (next update will be August) showed that the total labour underutilisation rate was 12.6 per cent in the second-quarter 2012. This will have edged up slightly in June given the decline in full-time employment and working hours.
The ABC National News reported – Unemployment rises to 5.2 per cent – that the:
… figures for June were unambiguously weak … The participation rate … fell … indicating that some people may have given up looking for work and left the labour force. Aggregate monthly hours worked … fell … [due] … to the decline in full-time jobs compared with the modest rise in part-time work, as well as the net loss of jobs overall.
The Sydney Morning Herald article – Economy sheds 27,000 jobs – quoted one bank economist as saying:
The rather impressive job number we had has come to a screeching halt …. It brings the labour market a bit more in line with other indicators.
The fact the economy is slowing is clear. In the last financial year (July-June) the “economy added about 47,400 jobs for the financial year, or about one quarter of the 222,700 jobs added for the previous year.”
The SMH then quoted another bank economist who claimed that Australia was:
… still pretty close to full employment …
The reality is that the official data shows that the broad underutilisation rate is over 12.5 per cent. That is nowhere near to being at or close to full employment. I wonder why these characters continue to perpetuate that myth. What is in it for them to mislead the public like that?
The OECD published its Employment Outlook 2012 on July 10, 2012 and said the “recent deterioriation in the economic outlook is very bad news for the labour market.” The country-specific commentary on Australian – summarised in the document – How does Australia compare? – noted that our unemployment was well below “the major developed countries”.
But they warn that:
Nevertheless, underemployment continues to be a significant problem … More than 12% of the labour force are now either unemployed or working part-time and would like to work longer hours, an increase of two percentage points since 2007. At 7.2% in the fourth quarter of 2011, Australia’s rate of underemployment is much higher than the OECD average of 5.0%, so that total labour underutilisation in Australia is close to the OECD average, despite much lower unemployment. While underemployment is not as potentially damaging to workers as unemployment, it can have long-term consequences for career progression, earnings potential and retirement income.
That doesn’t sound like a fully employed or close to it economy to me.
The other interesting observation in the OECD Employment Outlook is that:
Like many OECD countries … the share of wages, salaries and benefits in national income – declined in Australia between 1990 and 2007 … Many factors have contributed to the decline, including increased domestic and international competition, higher productivity and capital- deepening. However, a reduction in the bargaining power of workers has also played a role. Australia experienced one of the strongest declines in trade union membership in the OECD over that period, as well as a significant drop in the share of workers whose wages were set by collective agreements or awards. Such trends are likely to have reduced the bargaining power of workers, especially the low-skilled. The decline in the labour share in Australia has also been associated with an increase in wage and income inequality over recent decades.
The wage share has fallen from nearly 60 per cent in the 1980s to the low 50s now. The loss of bargaining power has been the direct result of harsh anti-union legislation which has tipped the industrial relations field firmly towards the employers.
As I have noted previously, one of the basic causes of the global financial crisis has been the explosion of private sector debt which was accumulated over the last 20 years or so. The fact is that economic growth over these decades has been largely driven by the credit-fuelled consumption and real estate binge that occurred.
Previously growth in consumption spending was largely driven by real wages growth broadly in line with productivity growth – which meant that the wage share also was fairly stable. The declining wage share has occurred because real wages have not kept pace with productivity growth as the bosses gained more bargaining power courtesy of the industrial relations changes and the persistently high unemployment.
The only way the consumption growth could continue under these circumstances was via credit.
To avoid this there has to be a major redistribution of national income back towards wages, which means that real wages have to grow at least as fast as productivity growth over the next decade.
The fact that this trend continues despite the crisis and its causes tells me that very little has been learned by governments and the the same susceptibilities will remain into the future.
Employment growth – positive but trend remains weak
The June data shows that employment decreased by 27,000 (0.2 per cent) (net) with full-time employment falling sharply by 22,500 (-0.4 per cent) and part-time employment partially offsetting that fall by adding 6,600 jobs (0.2 per cent rise).
Today’s data reasserts the message that the labour market data is switching back and forth each month with an sluggish underlying trend being fairly stable for some months now.
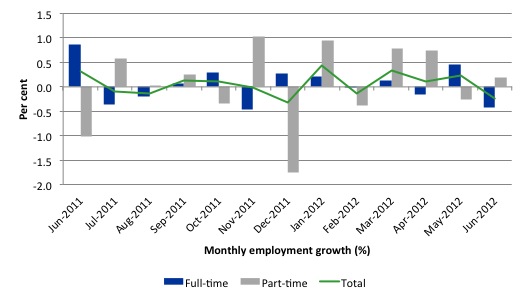
There have been considerable fluctuations in the full-time/part-time growth over the last year with regular crossings of the zero growth line.
Over the last 12 months, full-time employment has fallen by 13.7 thousand while part-time employment has risen by 61.2 thousand.
Over the last 12 months, the labour force has grown marginally stronger than employment, which means that unemployment has risen (by 35 thousand) over the same period.
Labour force growth is also subdued by the state of the economy (with participation rates still well down on previous peaks and flat over the last 12 months), which means that the sluggish supply growth is keeping unemployment much lower than it otherwise would be given how poor the employment growth has been.
The following graph shows the month by month growth in full-time (blue columns), part-time (grey columns) and total employment (green line) for the 12 months to June 2012 using seasonally adjusted data.
Today’s results just repeat the topsy-turvy nature of the data over the period shown. The Australian labour market is struggling with the low GDP growth creating a near jobless growth environment.
While full-time and part-time employment growth are fluctuating around the zero line, total employment growth is still well below the growth that was boosted by the fiscal-stimulus in the middle of 2010.
The following table provides an accounting summary of the labour market performance over the last six months. The monthly data is highly variable so this Table provides a longer view (over the last 6 months) which allows for a better assessment of the trends. WAP is working age population (above 15 year olds). The first three columns show the number of jobs gained or lost (net) in the last six months.
The conclusion – overall only 86.3 thousand jobs (net) have been created in Australia over the last six months with only 17.3 thousand full-time jobs. Job creation in Australia over the first half of this year has been dominated by part-time employment – which suggests underemployment will also be rising.
The WAP has risen by 114 thousand in the same period while the labour force has risen by 89.6 thousand.
The upshot is that relatively weak employment growth has failed to keep pace with the underlying population growth (participation has been constant over this period) and so unemployment has risen (by 3 thousand).
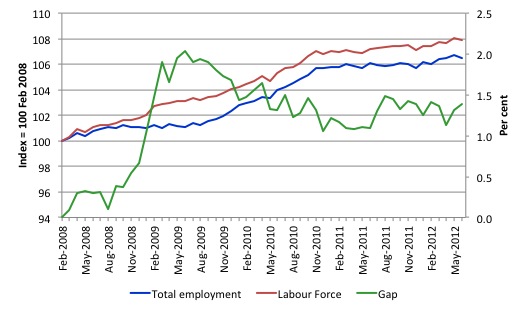
To put the recent data in perspective, the following graph shows the movement in the labour force and total employment since the low-point unemployment rate month in the last cycle (February 2008) to June 2012. The two series are indexed to 100 at that month. The green line (right-axis) is the gap (plotted against the right-axis) between the two aggregates and measures the change in the unemployment rate since the low-point of the last cycle (when it stood at 4 per cent).
You can see that the labour force index has largely levelled off and now falling and the divergence between it and employment growth has been relatively steady over the last several months with this month showing some improvement.
The Gap series gives you a good impression of the asymmetry in unemployment rate responses even when the economy experiences a mild downturn (such as the case in Australia). The unemployment rate jumps quickly but declines slowly.
It also highlights the fact that the recovery is still not strong enough to bring the unemployment rate back down to its pre-crisis low. You can see clearly that the unemployment rate fell in late 2009 and then has hovered at the same level for some months before rising again over the last two months.
The gap shows that the labour market is still a long way from recovering from the financial crisis that hit in early 2008. There hasn’t been much progress since November 2010, when the fiscal stimulus started to run out.
Teenage labour market – remains in a parlous state
Regular readers will know that I always try to highlight the plight of our teenagers in the labour market.
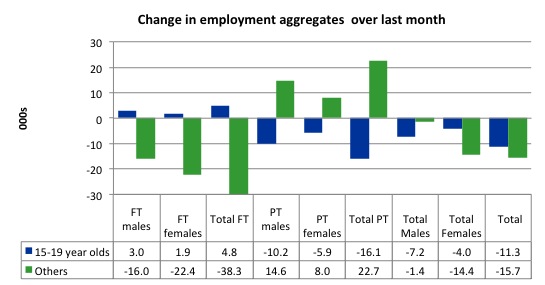
The teenage labour market went backwards this month losing 11.3 thousand (net) jobs although there were some very modest gains in full-time employment.
The following graph shows the distribution of net employment creation in the last month by full-time/part-time status and age/gender category (15-19 year olds and the rest)
If you take a longer view you see how poor the situation is.
Over the last twelve months teenagers have lost 19.8 thousand (net) jobs while the rest of the labour force has gained 67.3 thousand jobs (net).
The teenage segment of the labour market is being particularly dragged down by the sluggish employment growth, which is hardly surprising given that the least experienced and/or most disadvantaged (those with disabilities etc) are rationed to the back of the queue by the employers.
The following graph shows the change in aggregates over the last 12 months. Australian teenagers are going backwards which is a trend common around the world at present.
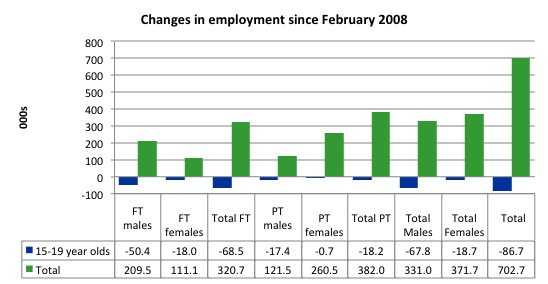
To further emphasise the plight of our teenagers I compiled the following graph that extends the time period from the February 2008, which was the month when the unemployment rate was at its low point in the last cycle, to the present month (June 2012). So it includes the period of downturn and then the “recovery” period. Note the change in vertical scale compared to the previous two graphs. That tells you something!
The results are stunning and represent a major policy failure.
Since February 2008, there have been 702 thousand (net) jobs added to the Australian economy but teenagers have lost 87.7 thousand over the same period. It is even more stark when you consider that 68.5 thousand full-time teenager jobs have been lost in net terms. Even in the traditionally, concentrated teenage segment – part-time employment – there has been virtually no new opportunities generated.
Overall, the performance over the last 12 months is poor and should receive a much higher priority in the policy debate than it does.
The longer-run consequences of this teenage “lock out” will be very damaging.
The Australian government has no coherent strategy to resolve this appalling state. Ensuring teenagers are included in paid work, if they do not desire to remain in school, should be a number one policy priority.
The Government’s response is to push this cohort into endless training initiatives (supply-side approach) without significant benefits. The research shows overwhelmingly that job-specific skills development should be done within a paid-work environment.
I would recommend that the Australian government announce a major public sector job creation program aimed at employing, in the first instance, all the unemployed 15-19 year olds.
It is clear that the Australian labour market continues to fail our 15-19 year olds. At a time when we keep emphasising the future challenges facing the nation in terms of an ageing population and rising dependency ratios the economy still fails to provide enough work (and on-the-job experience) for our teenagers who are our future workforce.
Unemployment
The unemployment rate rose by 0.1 percentage points in June 2012 to 5.2 per cent as employment growth contracted. The rise would have been larger had not the participation rate also fell – I analyse that effect later.
Overall, the labour market still has significant excess capacity available in most areas and what growth there is is not making any major inroads into the idle pools of labour.
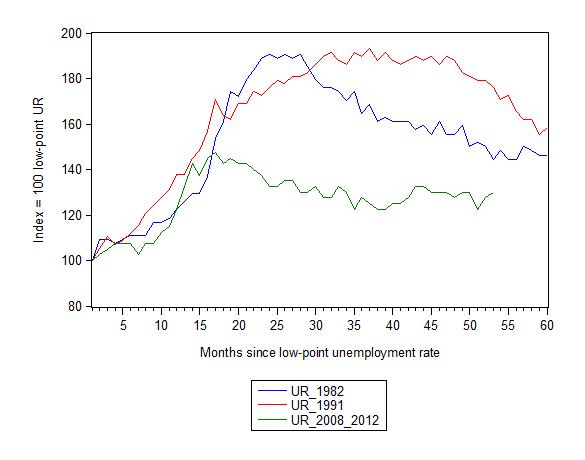
The following graph updates my 3-recessions graph which depicts how quickly the unemployment rose in Australia during each of the three major recessions in recent history: 1982, 1991 and 2009 (the latter to capture the 2008-2010 episode). The unemployment rate was indexed at 100 at its lowest rate before the recession in each case (August 1981; December 1989; April 2008, respectively) and then indexed to that base for each of the months as the recession unfolded.
I have plotted the 3 episodes for 53 months after the low-point unemployment rate was reached. For 1991, the end-point shown is the peak unemployment which was achieved some 38 months after the downturn began although the recovery was painfully slow. While the 1982 recession was severe the economy and the labour market was recovering by the 26th month. The pace of recovery for the 1982 once it began was faster than the recovery in the current period.
It is significant that the current situation while significantly less severe than the previous recessions is dragging on which is a reflection of the lack of private spending growth and declining public spending growth.
The graph provides a graphical depiction of the speed at which the recession unfolded (which tells you something about each episode) and the length of time that the labour market deteriorated (expressed in terms of the unemployment rate).
From the start of the downturn to the 53-month point (to June 2012), the official unemployment rate has risen from a base index value of 100 to a value 127.5 – peaking at 145 after 21 months. It reached this local low point 8 months ago (122.5) and has been hovering at the higher level since then. Unlike the other episode, the current trend, at this stage of the cycle, is unclear.
At 53 months, 1982 index stood at 144 and falling steadily, while the 1991 index was around 175, also falling steadily. The recent recovery is now weakening.
It is clear that at an equivalent point in the “recovery cycle” the current period is more sluggish than our recent two major downturns.
Note that these are index numbers and only tell us about the speed of decay rather than levels of unemployment. Clearly the 5.1 per cent at this stage of the downturn is lower that the unemployment rate was in the previous recessions at a comparable point in the cycle although we have to consider the broader measures of labour underutilisation (which include underemployment) before we draw any clear conclusions.
The notable aspect of the current situation is that the recovery is very slow.
Aggregate participation rate falls sharply in June
The participation rate fell by 0.2 percentage points in June 2012 to 65.2 per cent. It is also 0.4 percentage points lower than 12 months ago.
It is still substantially down on the most recent peak of 66 per cent (November 2010) when the labour market was gathering pace courtesy of the fiscal stimulus.
This drop in participation in the last year or more has meant the labour force growth has been relatively subdued with the additional result being that the unemployment rate is considerably lower than would otherwise been the case.
What would have the unemployment rate been if the participation rate was constant (that is, had have remained at its previous month’s level)?
The labour force is a subset of the working-age population (those above 15 years old). The proportion of the working-age population that constitutes the labour force is called the labour force participation rate. So changes in the labour force can impact on the official unemployment rate and so movements in the latter need to be interpreted carefully. A rising unemployment rate may not indicate a recessing economy.
The labour force can expand as a result of general population growth and/or increases in the labour force participation rates.
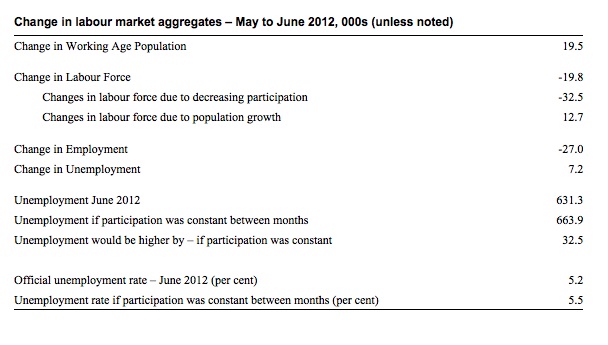
The following Table shows the breakdown in the changes to the main aggregates (Labour Force, Employment and Unemployment) and the impact of the fall in the participation rate.
In June 2012, employment fell by 27,000 while the labour force fell by 19,800 (as a consequence of the falling participation rate) which meant that unemployment rose by 7,200.
The labour force fell in May for two (opposing) reasons: (a) The underlying population growth added 12.7 thousand to the labour force. The population growth impact on the labour force aggregate is steady from month to month; and (b) the participation rate fall led to a decline in the labour force of 32.5 thousand (relative to what would have occurred had the participation rate remained unchanged).
Given the current employment level, unemployment would have been 663.9 thousand instead of 631.3 thousand as recorded by the ABS.
So if the participation rate had have remained unchanged, the unemployment rate would have risen to 5.5 per cent rather than 5.2 per cent as officially published. The difference, of-course, is that the “hidden unemployment rate” rose.
The conclusion is that the rise in unemployment would have been much higher had not the fall in labour force participation (equivalent to 32.5 thousand persons) led to a rise in hidden unemployment.
Hours worked fell again in June 2012
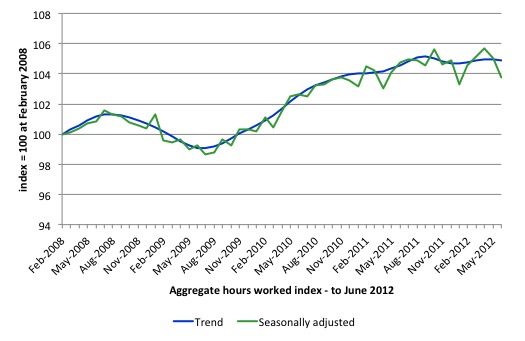
Aggregate monthly hours worked decreased sharply by 19.6 million hours (1.2 per cent) in seasonally adjusted terms and the trend is down.
The following graph shows the trend and seasonally adjusted aggregate hours worked indexed to 100 at the peak in February 2008 (which was the low-point unemployment rate in the previous cycle). The rising trend which marked the early recovery courtesy of the fiscal stimulus is now clearly gone.
This should also moderate the views of those that think today’s data shows “strength”. It doesn’t do anything other than show that the situation is not deteriorating from a very subdued current state..
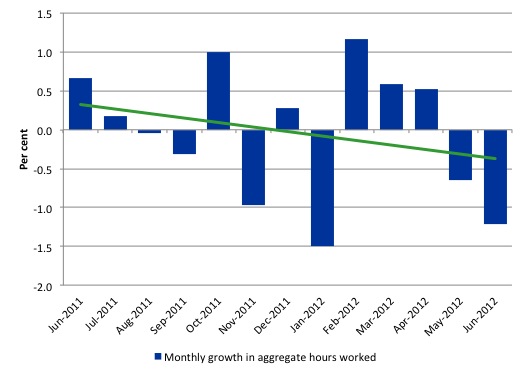
The next graph shows the monthly growth (in per cent) over the last 12 months. The green linear line is a simple regression trend and it is suggesting monthly growth rates are trending down – which is certainly the result depicted for the last four months.
Once again the data doesn’t support the notion of a fully employed labour market that is bursting against the inflation barrier.
The trend in hours growth is now downward with several large losses over the last 6 months.
Conclusion
The first-quarter National Accounts data suggested Australia was booming earlier in the year. The data produced a picture that exceeded the expectations of everyone who follows these things closely.
Last month’s labour force data was hopeful but experience told me that monthly changes provide notoriously unreliable guides to what is happening in underlying terms.
I predicted a reversal and it came within a month. The overall trend in the Australian labour market remains weak.
All the elements of weakness are there – falling full-time employment, overall employment contraction, rising unemployment, a contracting labour force due to a falling participation rate (which means rising hidden unemployment), and finally, a reduction in overall working hours.
Had not the participation rate fell sharply, the rise in unemployment that was recorded would have much much worse. The unemployment rate would have been around 5.5 per cent rather than 5.2 as officially recorded.
In the first months of this year, the situation remains uncertain with positive and negative swings in employment growth already evident and repeating the behaviour over the last 18 or so months.
The best assessment is that the labour market is weak – especially when you consider that full-time employment has barely moved over the last six months.
We always have to be careful interpreting month to month movements given the way the Labour Force Survey is constructed and implemented. But the underlying trend is weak as a result of the withdrawal of the fiscal stimulus undermining employment growth.
The most striking aspect of a sad picture remains the appalling performance of the teenage labour market. Employment has collapsed for that cohort and I consider it a matter of policy urgency for the Government to introduce an employment guarantee to ensure we do not continue undermining our potential workforce.
Conclusion – weak and weakening.
That is enough for today!
(c) Copyright 2012 Bill Mitchell. All Rights Reserved.

Hi Bill just wondering why you and others don’t use the employment to population ratio in your explanations. The figures you quote i.e. level estimates require another level of anaylsis that isn’t provided. That is what was population growth? If you quote the e to p you remove this level of cloudiness and the true state of employment becomes clear.
Bill, have you ever heard about the Hartz IV, the german labour market reform guideline?
A Portuguese reader, Congrats! 🙂
Brisbane is hosting the G20 summit in 2014 and I’m getting excited just thinking about it. The unemployed could be bussed in to line the route and cheer the wise leaders of the world.Give them a flag to wave and a few dollars and the unemployment rate plummets for that month . It’s all good.
More realistically,I’m hoping the G20 circus will have folded its tent well before 2014.
I Have two teenagers down here in Melb. With sky high housing costs, high rentals and scarcity of decent casual jobs they are planning to stay at home for the foreseeable future. We are anticipating cut throat competition for university places and graduate jobs, just the way the elites like it. What choice do we have. The opportunities for a fulfilling career, decent work life balance and comfortable retirement are rapidly diminishing. The great middle class squeeze continues unabated.
Too often I see a sub-culture of over optimistic under achievers. These people are willing and eager. They have a “winning attitude” but they are blind to their limitations, unaware of the lack of opportunity and odds stacked against them. These are people who have taken extreme liberal views to heart and are confidently expecting to enjoy fruits of success which will never arrive. They are not at all interested in socialist ideals, a long and harsh lesson awaits.
I live in Brisbane. It was with dismay that I heard the news that Brisbane will host the G20 summit in 2014. IMO, we don’t need the conflict, disruption and notoriety that comes with hosting it. It is just a pro-neoliberal, plutocrat-serving convention anyway. No good will come of it for most working class and middle class citizens. The parochial, jingoistic, self-interested and greed reactions of the political and monied classes to securing this “prize” are, as always, unedifying and even disgusting to see. If you need to “boost” your regional economy with subsidised conventions, car races and tourism then it is a clear sign your economy is run in the wrong way anyway.
Andrew has hit the nail on the head too. Don’t be too harsh on the young, though. They don’t have the benefit of experience yet and optimism springs eternal in the youthful breast. It would perhaps be too cruel to let them know how bad the real future is almost certain to be (limits to growth, collapse, die-off etc). Best to let them progressively learn, becoming tougher and more realistic over time… or dieing as the case may be and going to the “nirvana” of non-existence (escape from the pain and desire of conscious existence).
It’s best to keep this human life business in perspective. It’s a temporary gig both individually and even as a species. For sure, in an existential sense what happens now counts; pain hurts, good things are sufficient unto the day and moral philosophy (ethics) has a place in the now and the (relatively near) past and future. But overall, a little humility is required. Humanity is not important in any cosmic sense and will not be persistent in any cosmic timescale.