Japan – Tracing the decline in construction employment since 1980
In this blog post, I am continuing my work on examining the constraints in the Japanese infrastructure sector that would reduce the effectiveness of the fiscal expansion that the current government is proposing as a strategy to kickstart the economy and lift productivity. One approach is to decompose employment changes in the sector into the demand-side and supply-side components, which helps us assess whether there is a shortage of spending or a shortage of workers. The data shows two unambiguous patterns. First, construction employment is driven strongly by government spending on infrastructure. When that wanes, activity plummets. Second, in recent years, the overwhelming reason employment in the sector is declining is due to a contraction of labour supply. Taken together, while it is a relatively straightforward path to stimulate the industry – increase public investment spending, the supply constraints make that approach difficult to implement. This will bear on the effectiveness and outcomes of the current fiscal expansion proposed by the Takaichi government in Japan.
The data trends
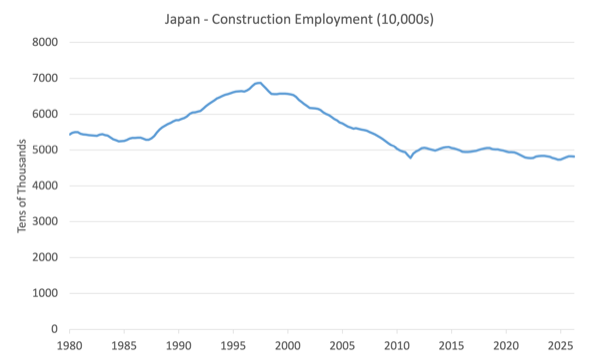
The first graph shows the evolution of quarterly employment in the Construction sector in Japan since 1980.
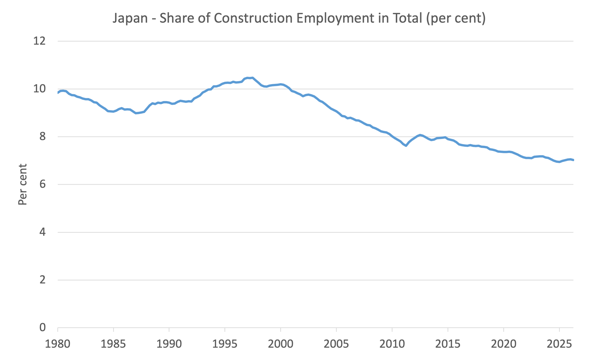
The next graph shows the share of Construction employment in total employment for Japan since 1980.
I can also tell you that the wage index for construction has outpaced the general movement in wages in Japan by a considerable margin over the last decade or so.
What explains these movements?
A mainstream (New Keynesian) economist would teach their students that the combination of declining employment and rising real wages in construction supports their theory that workers were pricing themselves out of a job.
However, they would be wrong.
The next graph compares the total expenditure by the National government on infrastructure and other investment projects to total employment in the construction sector from 1960 to 2026.
The data makes it clear that the procurement contracts issued by the government for capital projects is the driver of total employment in the construction sector.
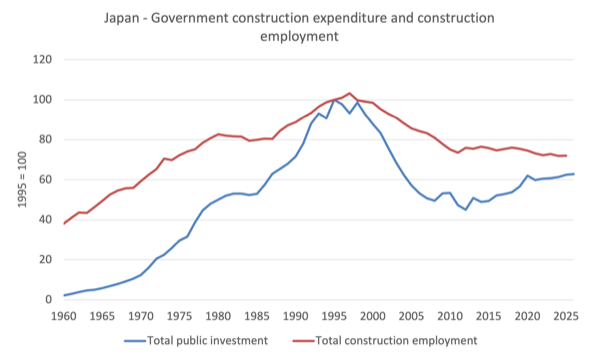
Focusing on the period after 1990, that is, the period after the major asset bubble crash occurred in 1991, we can identify two distinct macroeconomic periods for construction employment.
1. A demand-driven contraction from 1990 to 2010
Immediately following the 1990 crash, private real estate demand collapsed.
However, the Japanese government did introduce large-scale countercyclical public works investments.
For a time, the construction sector, propped up by the massive public expenditure, acted as a buffer against rising unemployment – particularly absorbing workers from the manufacturing sector.
But pressure exerted by mainstream economists, particularly ‘big noters’ from the US, on the government to rein in the fiscal deficits led to a shift in behaviour, first in April 1997, when the government pushed up the sales tax from 3 to 5 per cent.
The economy immediately contracted as household consumption fell significantly and the fiscal austerity was soon reversed but the fiscal attacks by economists continued and the government capex spending fell significantly in the years leading up to the GFC.
The fiscal cuts in the late 1990s also coincided with a structural (long-term) decline in domestic residential construction in the private sector.
This decline was one of the largest factors driving the contraction in final demand for construction activity in this period and many firms left the sector as a result.
2. A supply-constrained labor shortage from 2010 through 2026
However, as a response to the GFC, the government expanded capital expenditure and private capital expenditure also increased somewhat.
These spending increases certainly moderated the declining employment levels in the construction sector.
What drove employment in this period?
The decline is almost exclusively a supply-side phenomenon.
First, the overall population decline has reduced the working age labour force.
The so-called ‘3K’ phenomenon also is playing a major role.
Construction is known as the 3K industry in Japan – Kitanai (Dirty), Kitsui (Tough), and Kiken (Dangerous) – which makes it unattractive to the younger workers.
The current construction workforce is disproportionately elderly and the natural replacement rate is low as a result of the 3K stigma.
The weather is another negative factor related to the 3K issue – freezing winters and increasingly hot summers
Second, workers in Japan are increasingly seeking to better balance work and life, as the tradition for males to overwork wanes somewhat.
Construction, in particular, is known for requiring workers to work longer hours than most sectors and offers less holidays
To counter the longer hours – particularly the unpaid overtime – the government introduced in April 2024 a limit of 360 overtime hours per year for construction workers.
Immediately the available working hours in construction declined.
Third, the construction sector has historically not provided very generous non-wage benefits and job security.
Only around 60 per cent of construction workers have access to employee pension and employment insurance schemes.
The figure for manufacturing workers, for example, is close to 90 per cent.
And while pay offers have increased in recent years in an attempt to attract more workers into the sector, the pay is considered too low relative to the harsh working conditions.
Fourth, cultural factors have also reduced the supply of labour.
Unlike the previous generations, the modern youth in Japan prefer more regular hours, ability to work remotely and regular holiday breaks.
And as the service sector has diversified, there are more attractive jobs seeking workers elsewhere in the economy.
In recent years, expenditure on infrastructure projects (for example, the 2026 Osaka Expo) has boosted demand but has not boosted employment much given the increasingly binding labour supply constraints discussed above.
The last graph above shows that the demand-driven contraction arose from government spending constraint.
Private capex was also subdued as corporations hoarded profits as retained earnings and tried to adjust to the collapsed asset prices.
This article in the Japan Today news (May 26, 2026) is interesting – Some jobs have too few workers, some too many: What’s Japan to do? – in this respect.
We can also reinforce the supply-constrained narrative by looking at the ‘Job-to-Applicant Ratio’ which is an indicator of the strength of labour demand relative to supply.
At present (August 2026), the ratio was:
1. Whole economy: 1.18 which means that there are 1.18 jobs per person searching for work.
2. Construction industry: 6.68 – a chronic state of excess demand.
A sector does not have chronic excess demand if there was a wage problem.
The other side of the coin is that some sectors (administrative and clerical) are in labour supply surplus (ratio = 0.45).
One of the consequences of the labour supply shortages is that construction companies are not refraining from bidding on new projects.
A report from January 17, 2026 (Source) noted that:
Nearly 70% of large and midsize construction companies in Japan say they will not be able to take on new large-scale construction projects in fiscal 2026, with a severe labor shortage constraining private and public investment and hindering economic growth.
The data shows that:
The 12-month moving average for the value of construction projects under contract but not yet completed reached 16.4 trillion yen ($104 billion) in October, up 41% from October 2020 and more than double the October 2015 level.
Conclusion
Taken together, the significant labour supply constraint in the Japanese construction sector will be an important factor in determining the effectiveness of any fiscal expansion that is introduced by the Japanese government.
In later work, I will document a policy approach to addressing this problem.
That is enough for today!
(c) Copyright 2026 William Mitchell. All Rights Reserved.

This Post Has 0 Comments