The recent extreme weather in the northern hemisphere, the twin monster tropical storms in Japan,…
Australian labour market – the outlook turned up in June
Today (July 18, 2024), the Australian Bureau of Statistics released the latest – Labour Force, Australia – for June 2024, which shows that the labour outlook has improved somewhat from the last several months of plodding along not sure which way to turn. While it has been difficult to make any definitive conclusions about where the labour market is going based on the data from the last few months, the June data suggests that the direction is up rather than down. With both employment growth and participation rising, unemployment rose slightly but that is a sign of an improving labour market outlook rather than the opposite when unemployment rises on the back of a falling participation rate. The official unemployment was 4.1 per cent, a modest rise over the month, but would have actually fallen to 3.9 per cent had the participation rate not risen. Employment growth was stronger and concentrated on full-time work with monthly hours worked rising. As a result, underemployment and broad labour underutilisation fell – another good outcome. But we should not disregard the fact that there is now 10.5 per cent of the working age population (1.6 million people) who are available and willing but cannot find enough work – either unemployed or underemployed and that proportion is increasing. Australia is not near full employment despite the claims by the mainstream commentators and it is hard to characterise this as a ‘tight’ labour market.
The summary ABS Labour Force (seasonally adjusted) estimates for June 2024 are:
- Employment rose 50,200 (0.3 per cent) – full-time employment increased by 43.3 thousand and part-time employment increased by 6.8 thousand. Part-time share of total was 30.6 per cent.
- Unemployment rose 9,700 to 608,200 persons.
- The official unemployment rate rose 0.1 point to 4.1 per cent.
- The participation rate rose 0.1 point to 66.9 per cent.
- The employment-population ratio rose 0.1 point to 64.2 per cent.
- Aggregate monthly hours rose 15 million (0.8 per cent).
- Underemployment rate fell 0.3 points to 6.5 per cent – underemployment fell by 38.7 thousand. Overall there are 969.4 thousand underemployed workers. The total labour underutilisation rate (unemployment plus underemployment) fell 0.2 points to 10.5 per cent. There were a total of 1,577.6 thousand workers either unemployed or underemployed.
In the ABS Media Release – Unemployment and participation rates rise in June – the ABS noted that:
The seasonally adjusted unemployment rate rose by less than 0.1 percentage point to 4.1 per cent in June …
The participation rate in June was only 0.1 percentage point lower than the historical high of 67.0 per cent in November 2023. The employment-to-population ratio rose by 0.1 percentage point to 64.2 per cent, which was also close to its historical high of 64.4 per cent in November 2023 …
Consistent with the increase in hours worked, the seasonally adjusted underemployment rate fell 0.3 percentage points to 6.5 per cent. The underemployment rate was 0.1 percentage point lower than June last year, and 2.3 percentage points lower than March 2020.
The underutilisation rate, which combines the unemployment and underemployment rates, also fell 0.2 percentage points to 10.5 per cent. While this was 0.4 percentage points higher than June 2023, it was 3.4 percentage points lower than March 2020.
General conclusion:
1. Continuing good signs with employment growth robust and drawing more people back into activity (participation rate rising).
2. The dominance in full-time employment growth this month is a solid sign.
3. The rising employment-population ratio is a good indicator that the labour market is not tanking.
4. Unemployment slightly higher – due to the rise in participation.
5. Strong full-time employment and hours worked growth drove underemployment down.
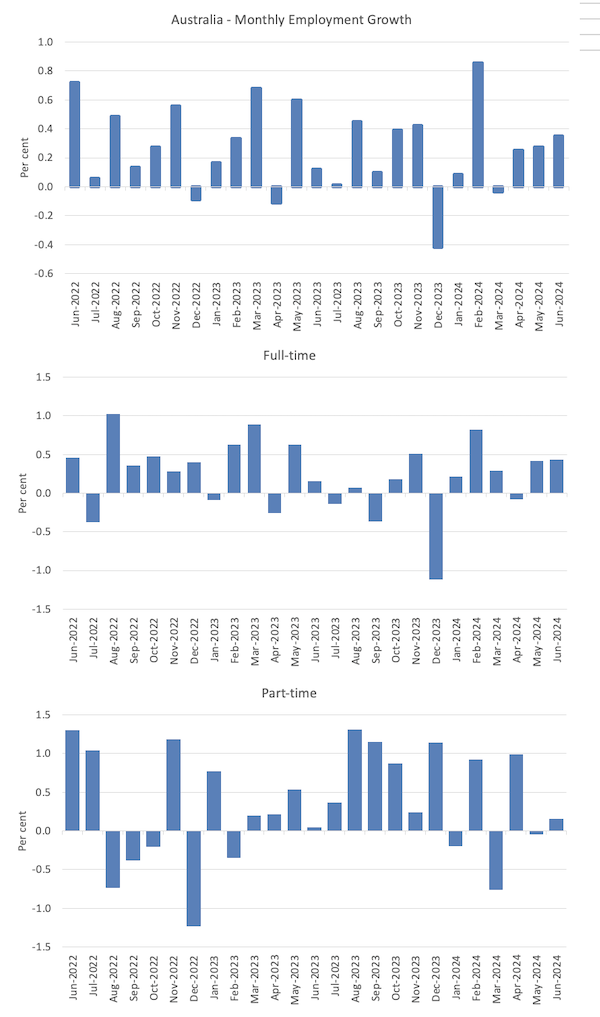
Employment rose 50,200 (0.3 per cent) in June 2024
1. Full-time employment increased by 43.3 thousand and part-time employment increased by 6.8 thousand.
2. The employment-population ratio rose 0.1 point to 64.2 per cent.
The following graph show the month by month growth in total, full-time, and part-time employment for the 24 months to June 2024 using seasonally adjusted data.
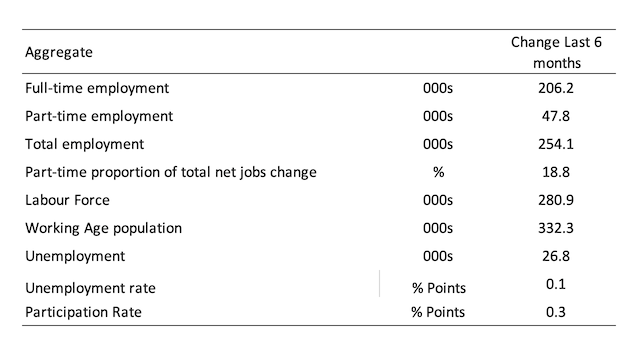
The following table provides an accounting summary of the labour market performance over the last six months to provide a longer perspective that cuts through the monthly variability and provides a better assessment of the trends.
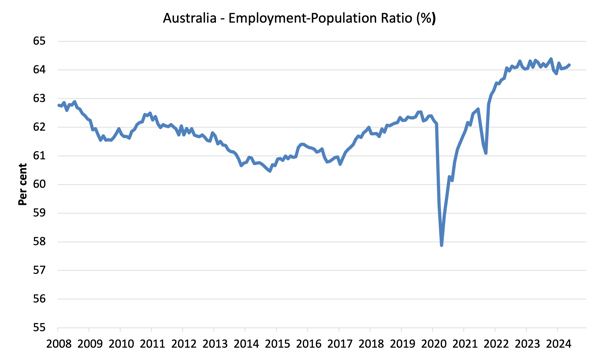
Given the variation in the labour force estimates, it is sometimes useful to examine the Employment-to-Population ratio (%) because the underlying population estimates (denominator) are less cyclical and subject to variation than the labour force estimates. This is an alternative measure of the robustness of activity to the unemployment rate, which is sensitive to those labour force swings.
The following graph shows the Employment-to-Population ratio, since April 2008 (that is, since the GFC).
The employment-to-population ratio is still demonstrating stability with minor fluctuations around the current level.
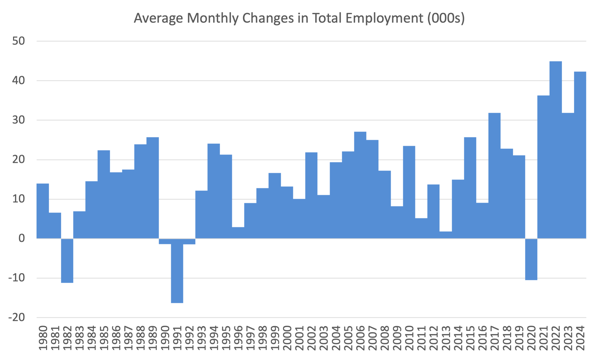
For perspective, the following graph shows the average monthly employment change for the calendar years from 1980 to 2024.
1. The average employment change over 2020 was -10.5 thousand which rose to 36.3 thousand in 2021 as the lockdowns eased.
2. For 2022, the average monthly change was 44.9 thousand, and for 2023, the average change was 31.9 thousand.
3. So far in 2024, the average monthly change is 42.3 thousand.
The following graph shows the average monthly changes in Full-time and Part-time employment in thousands since 1980.
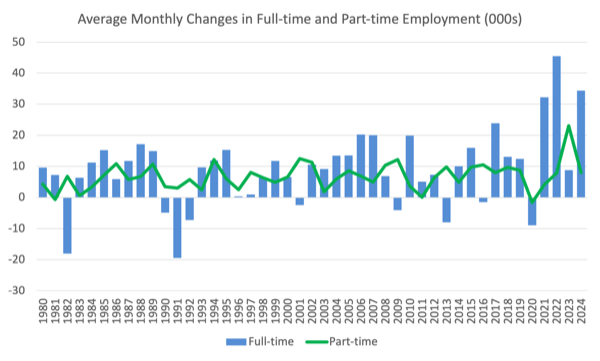
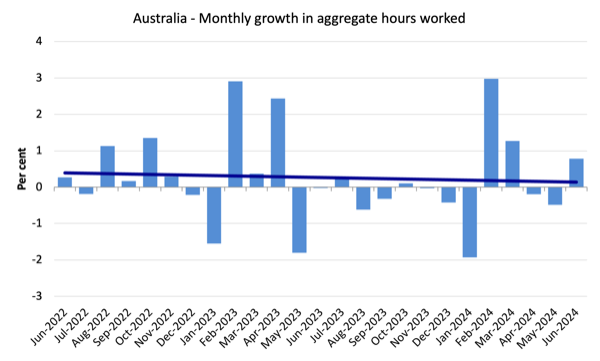
Aggregate monthly hours rose by 15 million hours (0.8 per cent)
The following graph shows the monthly growth (in per cent) over the last 48 months (with the pandemic restriction period omitted).
The dark linear line is a simple regression trend of the monthly change.
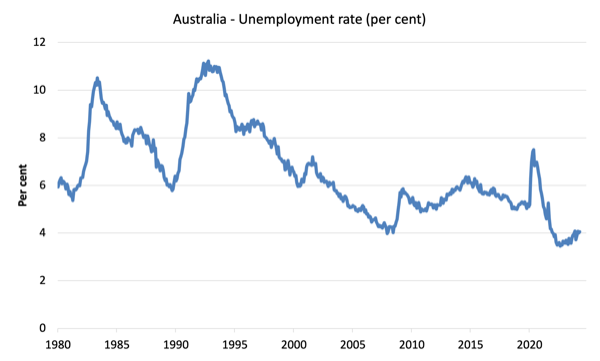
Unemployment rose 9,700 to 608,200 persons in June 2024
The very modest rise in unemployment and the unemployment rate was due to the rising participation rate (see below) as more people were attracted into the labour force on the back of the stronger employment growth.
The following graph shows the national unemployment rate from April 1980 to June 2024. The longer time-series helps frame some perspective to what is happening at present.
What was the impact of the rising participation rate on unemployment in June 2024
The question is what would the unemployment rate have been, given the significant employment growth in June, if the participation rate had not risen and dragged more workers in to the labour force?
Here are the calculations.
The labour force is a subset of the working-age population (those above 15 years old). The proportion of the working-age population that constitutes the labour force is called the labour force participation rate. Thus changes in the labour force can impact on the official unemployment rate, and, as a result, movements in the latter need to be interpreted carefully. A rising unemployment rate may not indicate a recessing economy.
The labour force can expand as a result of general population growth and/or increases in the labour force participation rates (and vice versa).
The following Table shows the breakdown in the changes to the main aggregates (Labour Force, Employment and Unemployment) and the impact of the fall in the participation rate.
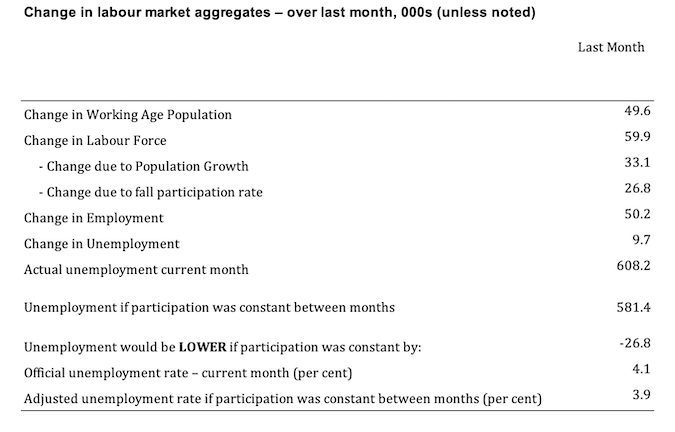
The change in the labour force in June 2024 was the outcome of two separate factors:
- The underlying population growth added 33.1 thousand persons to the labour force. The population growth impact on the labour force aggregate is relatively steady from month to month; and
- The rise in the participation rate meant that there were 26.8 thousand MORE workers entering the labour force (relative to what would have occurred had the participation rate remained unchanged).
- The net result was that the labour force fell by 59.9 thousand.
Assessment:
1. If the participation rate had not have risen in June 2024, total unemployment, given the current employment level, would have been 581.4 thousand rather than the official count of 608.2 thousand as recorded by the ABS – a difference of 26.8 thousand workers (the ‘participation effect’).
2. Without the rise in the participation rate, the official unemployment rate would have been 3.9 per cent (rounded) rather than its current official value of 4.1 per cent).
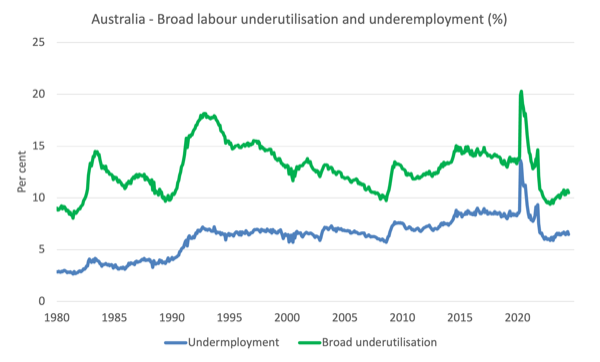
Broad labour underutilisation fell 0.2 points in June 2024
1. Underemployment rate fell 0.3 points to 6.5 per cent – underemployment fell by 38.7 thousand.
2. Overall there are 969.4 thousand underemployed workers.
3. The total labour underutilisation rate (unemployment plus underemployment) fell 0.2 points to 10.5 per cent.
4. There were a total of 1,577.6 thousand workers either unemployed or underemployed.
The fact that there is 10.5 per cent of workers who are both available and willing to work that are without work in one way or another (unemployed or underemployed) makes a mockery of claims by economic commentators and policy officials that Australia is near full employment or that this is an extremely tight labour market.
The following graph plots the seasonally-adjusted underemployment rate in Australia from April 1980 to the June 2024 (blue line) and the broad underutilisation rate over the same period (green line).
The difference between the two lines is the unemployment rate.
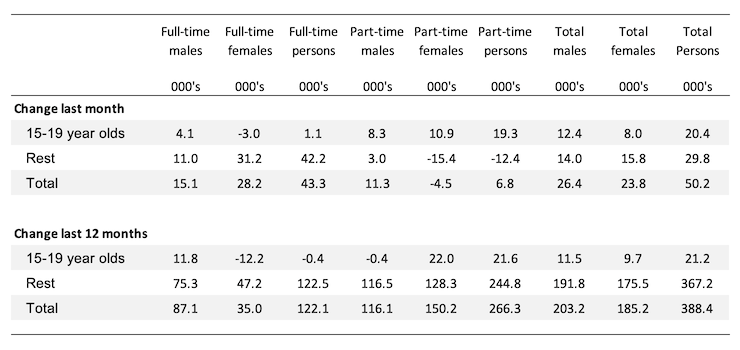
Teenage labour market improves in June 2024
Overall teenage employment fell by 20.4 thousand – full-time employment rose by 1.1 thousand while part-time employment rose by 19.3 thousand.
The following Table shows the distribution of net employment creation in the last month and the last 12 months by full-time/part-time status and age/gender category (15-19 year olds and the rest).
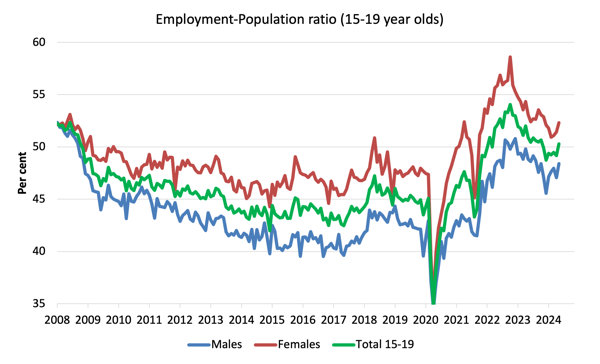
To put the teenage employment situation in a scale context (relative to their size in the population) the following graph shows the Employment-Population ratios for males, females and total 15-19 year olds since July 2008.
You can interpret this graph as depicting the change in employment relative to the underlying population of each cohort.
In terms of the recent dynamics:
1. The male ratio rose by 1.3 points over the month.
2. The female ratio rose 0.9 points over the month.
3. The overall teenage employment-population ratio rose 1.1 points over the month.
Conclusion
My standard monthly warning: we always have to be careful interpreting month to month movements given the way the Labour Force Survey is constructed and implemented.
My overall assessment is:
1. While it has been difficult to make any definitive conclusions about where the labour market is going based on the data from the last few months, the June data suggests that the direction is up rather than down.
2. With both employment growth and participation rising, unemployment rose slightly but that is a sign of an improving labour market outlook rather than the opposite when uemployment rises on the back of a falling participation rate.
3. Employment growth was stronger and concentrated on full-time work with monthly hours worked rising.
4. As a result, underemployment and broad labour underutilisation fell – another good outcome.
4. But we should not disregard the fact that there is now 10.5 per cent of the working age population (1.6 million people) who are available and willing but cannot find enough work – either unemployed or underemployed and that proportion is increasing.
7. Australia is not near full employment despite the claims by the mainstream commentators and it is hard to characterise this as a ‘tight’ labour market.
Hi Bill,
What is your view on raising child benefit to living wage or having looking after s child a JpG Job. Thank you.
My concern here is that the RBA will see these figures as an excuse to bump up interest rates again to inflict more pain and suffering on low to middle income families.