In the 1990s, a new industry was created in Australia. It produced nothing. But it…
US labour force data provides no basis (yet) for recession panic
The financial markets around the world have over the last week demonstrated, once again, that they are subject to wild swings in irrationality despite mainstream economists holding out the idea that these sorts of transactions exhibit pure rationality. Some of the capital movements are explained by a shift in the interest rate spread between Japan and the US as the former nation decided to increase interest rates modestly. That altered the profitability of financial assets in each currency and so there were margins to exploit. But the big swings came when the US Bureau of Labor Statistics (BLS) released their latest labour market data last Friday (August 2, 2024) – Employment Situation Summary – July 2024 – which showed payroll employment increasing by only 114,000 (well down on expectation) and the unemployment rate rising by 0.2 points to 4.3 per cent. Suddenly, the headlines were calling an imminent recession in the US and that triggered a flight into safer assets (government bonds) away from shares etc, which drove down bond yields (as bond prices rose) and left some short-run carnage in the share markets. A few days later the panic subsided and one has to ask what was it all about. In this blog post, I examine the labour force data and add some new extra ‘recession predictors’ to see whether the panic was justified. The conclusion is that it was not.
Overview for July 2023 (seasonally adjusted):
- Payroll employment increased by 114,000 (down from 150,000 last month).
- Total labour force survey employment rose by 67 thousand net (0.04 per cent).
- The labour force rose by 420 thousand net (0.25 per cent).
- The participation rate rose 0.1 point at 62.7 per cent.
- Total measured unemployment rose by 352 thousand to 7,163 thousand.
- The official unemployment rate rose 0.2 points to 4.3 per cent but without the participation increase it would have remained at 4.1 per cent..
- The broad labour underutilisation measure (U6) rose 0.4 points to 7.8 per cent – partly because underemployment rose.
- The employment-population ratio fell 0.1 points to 60 per cent.
For those who are confused about the difference between the payroll (establishment) data and the household survey data you should read this blog post – US labour market is in a deplorable state – where I explain the differences in detail.
Some months the difference is small, while other months, the difference is larger.
Payroll employment trends
The BLS noted that:
Total nonfarm payroll employment edged up by 114,000 in July, below the average monthly gain of 215,000 over the prior 12 months …
Health care added 55,000 jobs in July, similar to the average monthly gain of 63,000 over the prior 12 months …
Employment continued to trend up in construction in July (+25,000), in line with the average monthly gain over the prior 12 months (+19,000) …
In July, employment continued to trend up in transportation and warehousing … Transportation and warehousing has added 119,000 jobs since a recent low in January
of this year.Employment in social assistance continued its upward trend in July (+9,000), but at a slower pace than the average monthly gain over the prior 12 months (+23,000).
Information employment declined by 20,000 in July but has changed little over the year.
Government employment was little changed in July (+17,000). Employment growth in government has slowed in recent months, following larger job gains in 2023 and the first quarter of 2024.
Employment showed little change over the month in other major industries …
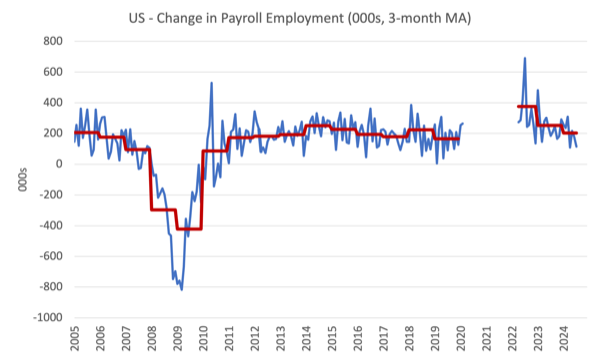
In summary, monthly payroll employment growth, while slowing in recent years, is still above pre-pandemic levels as the US labour market adjusts to the new normal.
The first graph shows the monthly change in payroll employment (in thousands, expressed as a 3-month moving average to take out the monthly noise). The red lines are the annual averages. Observations between March 2020 and March 2022 were excluded as outliers.
The next graph shows the same data in a different way – in this case the graph shows the average net monthly change in payroll employment (actual) for the calendar years from 2005 to 2023.
The red marker on the column is the current month’s result.
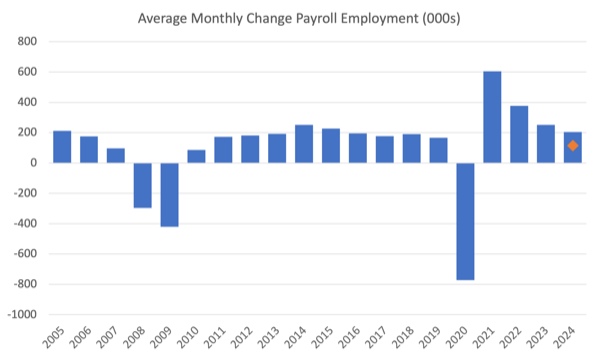
Average monthly change – 2019-2023 (000s)
| Year | Average Monthly Employment Change (000s) |
| 2019 | 163 |
| 2020 | -774 |
| 2021 | 606 |
| 2022 | 399 |
| 2023 | 251 |
| 2024 (so far) | 203 |
Temporary worker indicator
In the past (up until the 2008 recession), the shifts in temporary help employment has been a relatively reliable indicator that a major downturn was coming.
The logic was that firms used these workers as the first adjustment to deal with downturns in demand for their products because they were cheaper to lay off than the permanent staff.
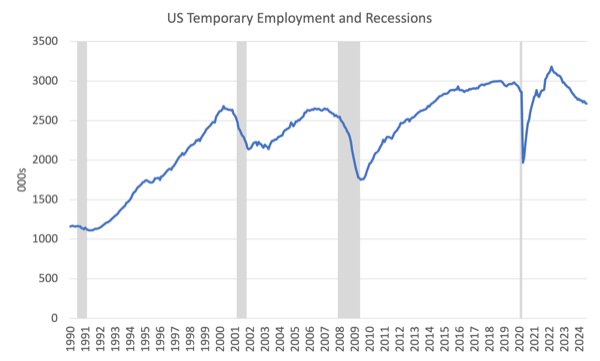
The following graph shows the movement in temporary employment since January 1990 to July 2024.
The grey bars depict the NBER Recession periods.
It is clear that prior to the pandemic the relationship between temporary employment and subsequent recessions was fairly pronounced.
But in the period since the pandemic something quite dramatic has happened.
Temporary employment has been in decline since late 2021 and if the past relationship was repeated there would have been a recession in early 2022.
Quite clearly that relationship is now changed and it is possible that the pandemic has altered employers’ attitudes towards dealing with cyclical fluctuations.
It is plausible that the difficulties that firms had attracting staff during the pandemic has meant they need to provide more security to staff and are looking for alternative ways of adjusting to the flux and uncertainty of demand.
I am examining this issue in more detail and will report back if I find out anything that is interesting.
The point is that we can no longer use this employment cohort as a leading indicator of recession in the US.
Prime-age Employment-Population ratio indicator
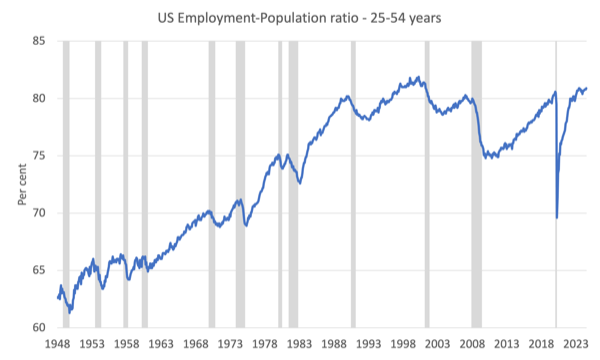
Another fairly reliable indicator of an impending recession is the Employment-Population ratio for prime-age workers (25-54 years old).
The following graph shows that data from January 1948 alongside the NBER recession dates.
This series is a lagging indicator given that firms are reluctant to lay-off their core workforce before they have made other adjustments.
However, at present, the series is continuing to increase, which is a good sign that there is no employment collapse imminent.
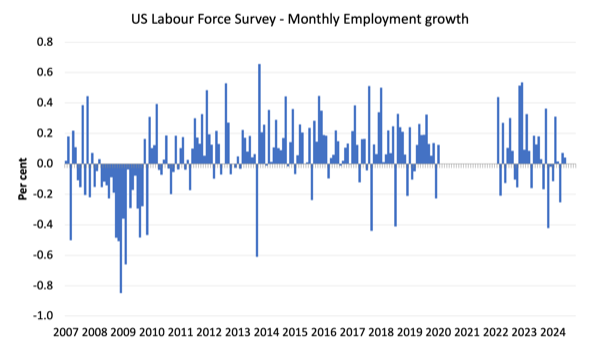
Labour Force Survey data – employment growth weaker
The seasonally-adjusted data for July 2023 reveals:
1. Total labour force survey employment rose by 67 thousand net (0.04 per cent) – substantial slowing.
2. The labour force rose by 420 thousand net (0.25 per cent).
3.The participation rate rose by 0.1 point 62.7 per cent.
4. As a result (in accounting terms), total measured unemployment rose by 352 thousand to 7,163 thousand.
5. The official unemployment rate rose 0.2 points to 4.3 per cent.
The following graph shows the monthly employment growth since January 2008 and excludes the extreme observations (outliers) between March 2020 and March 2022, which distort the current period relative to the pre-pandemic period.
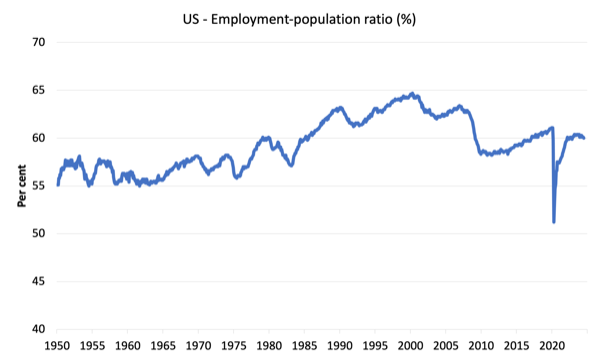
The Employment-Population ratio is a good measure of the strength of the labour market because the movements are relatively unambiguous because the denominator population is not particularly sensitive to the cycle (unlike the labour force).
The following graph shows the US Employment-Population from January 1950 to July 2024.
In July 2024, the ratio fell 0.1 point to 60 per cent.
The peak level in September 2020 before the pandemic was 61.1 per cent.
The ratio has been stable around 60 per cent and a bit above for the last two years.
There is no sign of a major collapse which would indicate that the demand-side is falling well behind the supply-side of the labour market.
Unemployment and underutilisation trends
The BLS note that:
The unemployment rate rose by 0.2 percentage point to 4.3 percent in July, and the number of unemployed people increased by 352,000 to 7.2 million. These measures are higher than a year earlier, when the jobless rate was 3.5 percent, and the number of unemployed people was 5.9 million. …
The number of people employed part time for economic reasons rose by 346,000 to 4.6 million in July. These individuals, who would have preferred full-time employment, were working part time because their hours had been reduced or they were unable to find full-time jobs.
The first graph shows the official unemployment rate since January 1994.
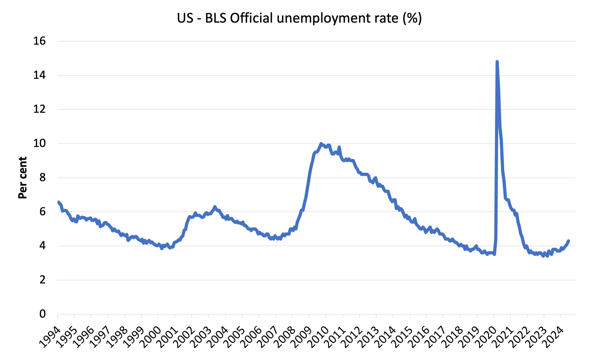
The official unemployment rate is a narrow measure of labour wastage, which means that a strict comparison with the 1960s, for example, in terms of how tight the labour market, has to take into account broader measures of labour underutilisation.
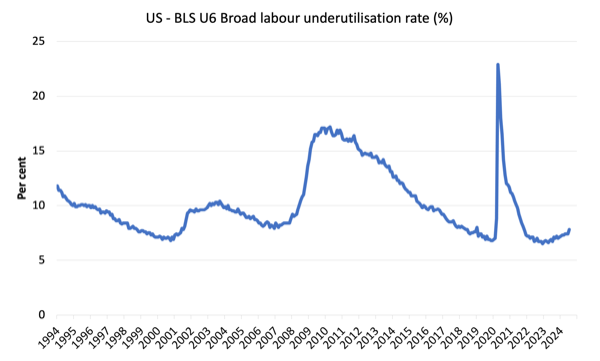
The next graph shows the BLS measure U6, which is defined as:
Total unemployed, plus all marginally attached workers plus total employed part time for economic reasons, as a percent of all civilian labor force plus all marginally attached workers.
It is thus the broadest quantitative measure of labour underutilisation that the BLS publish.
Pre-COVID, U6 was at 6.8 per cent (January 2019).
In July 2024, the U6 measure was 7.8 per cent (up 0.4 points) – partly because unemployment increased and also because underemployment fell.
The rise in people employed part time for economic reasons is a good indicator of the rising underemployment.
Taken together, it is clear that the labour market has deteriorated somewhat.
Firms are adjusting hours of work first and have laid off some staff.
But it is too early to call this a recession given that GDP growth continues, albeit at a slower pace.
Participation impact
The participation rate rose from 62.6 per cent to 62.7 per cent in July 2024.
The question is what would the unemployment rate have been, if the participation rate had not risen and dragged more workers in to the labour force?
Concepts:
- The labour force is a subset of the working-age population (those above 15 years old). The proportion of the working-age population that constitutes the labour force is called the labour force participation rate. Thus changes in the labour force can impact on the official unemployment rate, and, as a result, movements in the latter need to be interpreted carefully. A rising unemployment rate may not indicate a recessing economy.
- The labour force can expand as a result of general population growth and/or increases in the labour force participation rates (and vice versa).
Calculations:
The change in the labour force in July 2024 was the outcome of two separate factors:
- The underlying population growth added 151.6 thousand persons to the labour force. The population growth impact on the labour force aggregate is relatively steady from month to month; and
- The rise in the participation rate meant that there were 268.6 thousand MORE workers entering the labour force (relative to what would have occurred had the participation rate remained unchanged).
- The net result was that the labour force rose by 420 thousand.
Assessment:
1. If the participation rate had not have risen in July 2024, total unemployment, given the current employment level, would have been 6,894 thousand rather than the official count of 7,163 thousand – a difference of 268.6 thousand workers (the ‘participation effect’).
2. Without the rise in the participation rate, the official unemployment rate would have been 4.1 per cent (rounded) rather than its current official value of 4.3 per cent).
3. In other words, the angst over the unemployment rate rise as a sign that the labour market was entering recession is somewhat premature.
Conclusion
The latest monthly US employment data shows payroll employment slowing quite significantly.
The unemployment rate also rose on the back of a fairly brisk pace of labour force growth (with a slight uptick in participation).
The participation rate rose by 0.1 point and without that the unemployment rate would have remained at 4.1 per cent rather than the official rate of 4.3 per cent.
Other indicators of recession are either no longer reliable (temporary workers) or are still not suggesting a major downturn (employment-population rate of prime-age workers).
Overall, with GDP growth still positive, I think it was premature to rush into a recession mindset.
That is enough for today!
(c) Copyright 2023 William Mitchell. All Rights Reserved.
Capital movements in currency-issuing countries matter only for private business investment.
(we all should know by now that capital movements into government bonds are corporate wellfare).
So, what is there to invest on?
Real estate.
The military-industrial complex.
Oil and energy related industries.
The rest is more or less junk, like the crypto ilusions.
As household debt rises and an ever increasing geopolitical mess made by the US liberal democracy group think trouble makers, the worst is yet to come.
Slowly but surely as the deluded neocons are at the helm, nothing will improve, in the real world.
All I see is mayhem while lying politicians continue using debt/surplus/deficit fantasies to secure a vote.
I’m not saying western central banks will collapse and the zombies arrive, I am saying nothing will improve while the fantasy that the private sector finances spending, so we must tighten the purse.
To me, that is a slow economic implosion. With no contingencies in policy to alleviate household pressure, deluded wars, pushing China and Russia closer together with a mass global south pivot away from the US created rules based order. Its only mayhem to me with increased problems.
The west imho are no longer sophisticated in economics, geopolitical strategy and in humanity itself. The so called enemies, in their own way are proving it.
Is the current neoliberal system working or sustainable for prosperity to everyone? No, imho.
I just see more of the same money market instability for many years to come. I suggest investing in a cash only retirement portfolio and one’s home as the only stable solution.
Thank you.