Over the last several years, I have been indicating that I think we are in…
Australian labour market – unemployment rises as participation rises despite strong employment growth
Today (December 14, 2023), the Australian Bureau of Statistics released the latest – Labour Force, Australia – for November 2023. Employment growth remains strong with a surprise uptick in full-time employment. With participation rising by 0.2 points, the increase in the labour force outstripped the strong employment change, which meant that the unemployment rose by 0.1 points. If the participation rate had not have changed, then the official unemployment rate would be 3.5 per cent rather than the official rate published of 3.9 per cent. Underemployment also rose – there are now 10.4 per cent of the available and willing working age population who are being wasted in one way or another – either unemployed or underemployed. Australia is not near full employment despite the claims by the mainstream commentators and it is hard to characterise this as a ‘tight’ labour market.
The summary ABS Labour Force (seasonally adjusted) estimates for November 2023 are:
- Employment rose 61,500 (0.4 per cent) – full-time employment increased by 57,000 and part-time employment increased by 4.5 thousand. Part-time share of total was 30.5 per cent.
- Unemployment rose 18,800 to 572 thousand persons.
- The official unemployment rate rose 0.1 points to 3.9 per cent.
- The participation rate rose 0.2 points to 67.2 per cent.
- The employment-population ratio rose 0.1 point to 64.6 per cent.
- Aggregate monthly hours rose 8.9 million hours (0.46 per cent) after two months of decline.
- Underemployment rate rose by 0.2 points to 6.5 per cent (+30.2 thousand). Overall there are 966.7 thousand underemployed workers. The total labour underutilisation rate (unemployment plus underemployment) rose 0.3 points to 10.4 per cent. There were a total of 1,538.7 thousand workers either unemployed or underemployed.
In the ABS Media Release – Unemployment rate rises to 3.9% in November – the ABS noted that:
The unemployment rate rose by 0.1 percentage point to 3.9 per cent in November …
The combination of strong growth in both employment and unemployment in November saw the employment-to-population ratio return to a record high of 64.6 per cent and the participation rate reach a new high of 67.2 per cent …
The slowdown in hours worked also coincided with a further increase in the underemployment rate, which rose 0.2 percentage points to 6.5 per cent in November …
The underutilisation rate, which combines the unemployment and underemployment rates, rose 0.3 percentage points to 10.4 per cent. This was 1.1 percentage points higher than last November …
Conclusion: Strong employment growth and rising participation rates are a good combination.
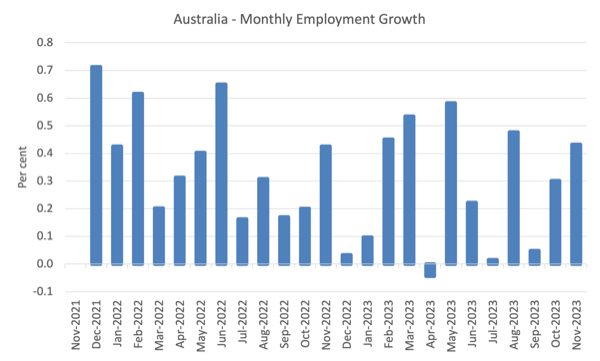
Employment rose 61,500 (0.4 per cent) in November 2023
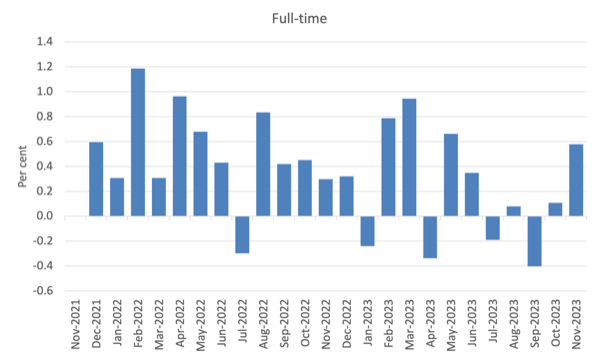
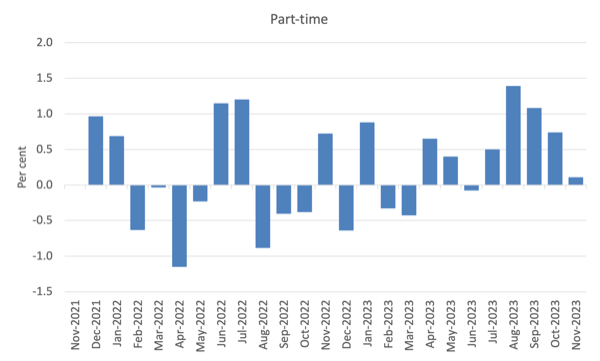
1. Full-time employment increased by 57,000 (0.6 per cent) and part-time employment increased by 4.5 thousand (0.1 per cent).
2. The employment-population ratio rose 0.1 point to 64.6 per cent.
The following graphs show the month by month growth in total, full-time, and part-time employment or the 24 months to November 2023 using seasonally adjusted data.
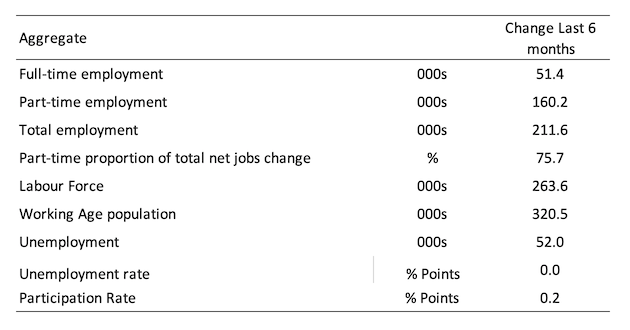
The following table provides an accounting summary of the labour market performance over the last six months to provide a longer perspective that cuts through the monthly variability and provides a better assessment of the trends.
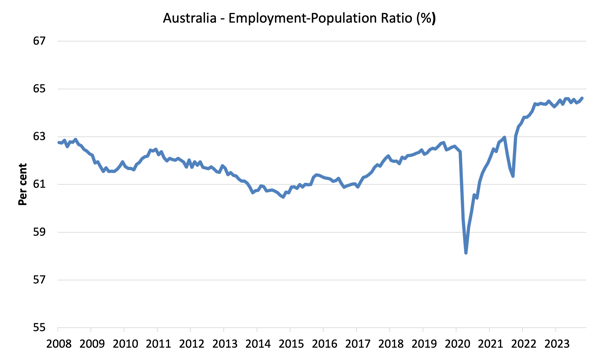
Given the variation in the labour force estimates, it is sometimes useful to examine the Employment-to-Population ratio (%) because the underlying population estimates (denominator) are less cyclical and subject to variation than the labour force estimates. This is an alternative measure of the robustness of activity to the unemployment rate, which is sensitive to those labour force swings.
The following graph shows the Employment-to-Population ratio, since January 2008 (that is, since the GFC).
The ratio rose 0.1 point to 64.6 per cent in November 2023.
Despite the attempts by the RBA to kill off employment growth, the graph shows that the relationship between employment and the working age population has been very stable over the rate hike period and this has been a time where population growth has accelerated.
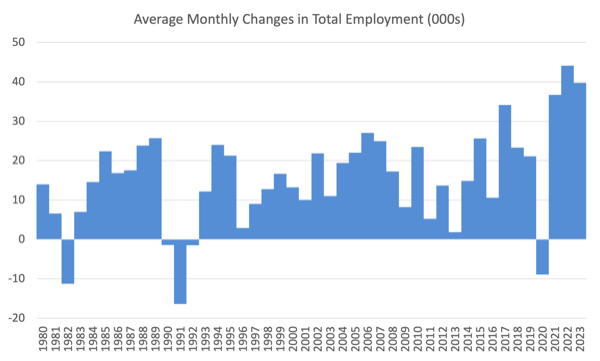
For perspective, the following graph shows the average monthly employment change for the calendar years from 1980 to 2023 (to date).
1. The average employment change over 2020 was -8.9 thousand which rose to 36.7 thousand in 2021 as the lockdowns eased.
2. For 2022, the average monthly change was 44.1 thousand.
3. So far, in 2023, the average change is 39.7 thousand.
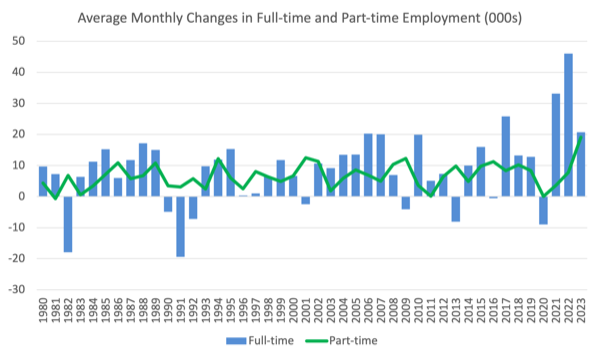
The following graph shows the average monthly changes in Full-time and Part-time employment in thousands since 1980.
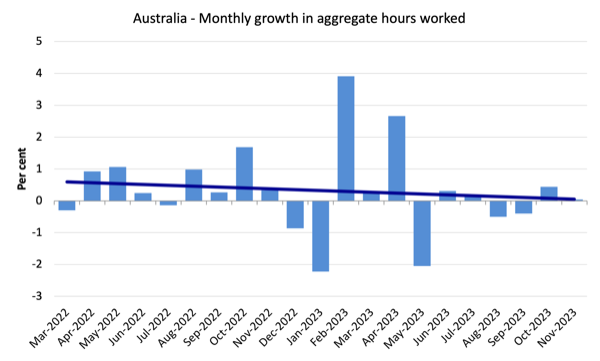
Aggregate monthly hours rose 0.8 million hours (0.04 per cent) in November 2023
In other words, barely at all, despite the strong full-time employment growth.
The following graph shows the monthly growth (in per cent) over the last 24 months (with the pandemic restriction period omitted).
The dark linear line is a simple regression trend of the monthly change.
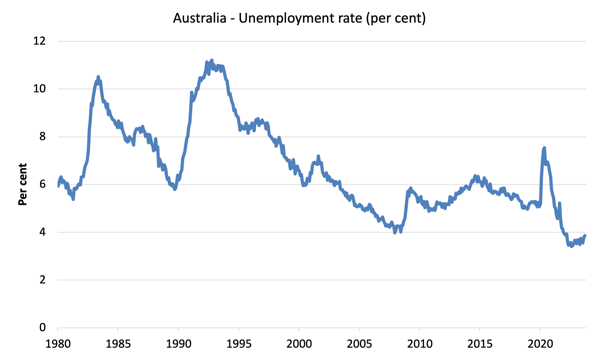
Unemployment rose 18,800 to 572 thousand persons in November 2023
Unemployment rose this month despite the strong employment growth because participation rose – which means the labour force rose by more than the employment (see below for analysis).
This is the second consecutive month we have observed that combination.
The following graph shows the national unemployment rate from January 1980 to November 2023. The longer time-series helps frame some perspective to what is happening at present.
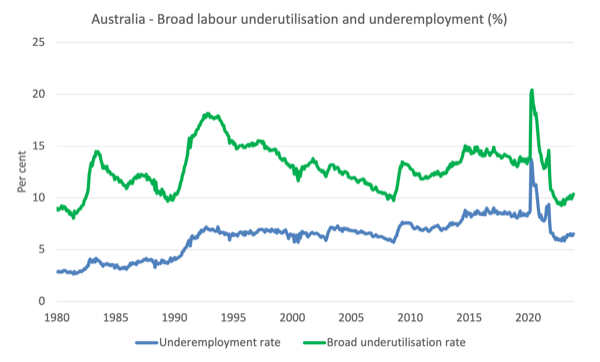
Broad labour underutilisation rose 0.3 points to 10.4 per cent in November 2023
1. Underemployment rate rose by 0.2 points to 6.5 per cent (+30.2 thousand).
2. Overall there are 966.7 thousand underemployed workers.
3. The total labour underutilisation rate (unemployment plus underemployment) rose 0.3 points to 10.4 per cent.
4. There were a total of 1,538.7 thousand workers either unemployed or underemployed.
It means that 10.4 per cent of available and willing workers are without work in one way or another (unemployed or underemployed), which makes a mockery of claims by economic commentators and policy officials that Australia is near full employment or that this is a tight labour market.
The following graph plots the seasonally-adjusted underemployment rate in Australia from April 1980 to the November 2023 (blue line) and the broad underutilisation rate over the same period (green line).
The difference between the two lines is the unemployment rate.
Aggregate participation rate rose 0.2 points to 67.2 per cent in November 2023
The rise in unemployment was the result of the rise in the labour force (80.2 thousand) outstripping the rise in employment (61.5 thousand) as the participation rate rose to 67.2 per cent.
The labour force is a subset of the working-age population (those above 15 years old). The proportion of the working-age population that constitutes the labour force is called the labour force participation rate. Thus changes in the labour force can impact on the official unemployment rate, and, as a result, movements in the latter need to be interpreted carefully. A rising unemployment rate may not indicate a recessing economy.
The labour force can expand as a result of general population growth and/or increases in the labour force participation rates (and vice versa).
The following Table shows the breakdown in the changes to the main aggregates (Labour Force, Employment and Unemployment) and the impact of the fall in the participation rate.
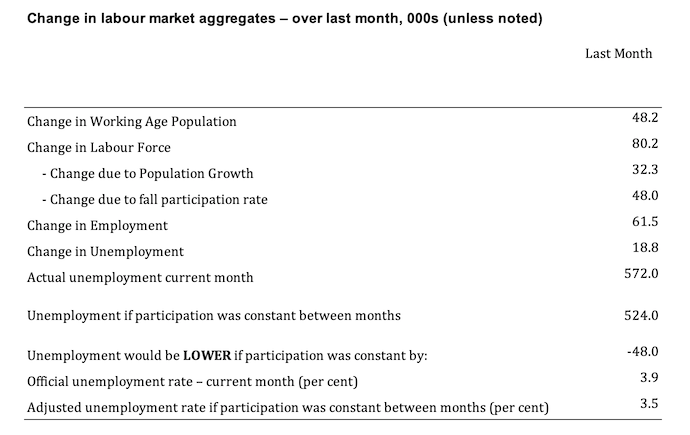
The change in the labour force in November 2023 was the outcome of two separate factors:
- The underlying population growth added 32.3 thousand persons to the labour force. The population growth impact on the labour force aggregate is relatively steady from month to month; and
- The rise in the participation rate meant that there were 48 thousand workers entering the labour force (relative to what would have occurred had the participation rate remained unchanged).
- The net result was that the labour force rose by 80.2 thousand.
Assessment:
1. If the participation rate had not have risen in November 2023, total unemployment, given the current employment level, would have been 524 thousand rather than the official count of 572 thousand as recorded by the ABS – a difference of 48 thousand workers (the ‘participation effect’).
2. Without the rise in the participation rate, the official unemployment rate would have been 3.5 per cent (rounded) rather than its current official value of 3.9 per cent).
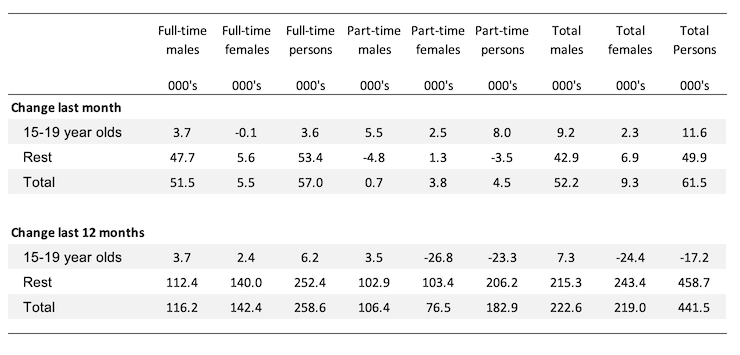
Teenage labour market improved in November 2023
Overall teenage employment rose by 11.6 thousand with full-time employment rising by 3.6 thousand and part-time employment rising by 8 thousand.
The following Table shows the distribution of net employment creation in the last month and the last 12 months by full-time/part-time status and age/gender category (15-19 year olds and the rest).
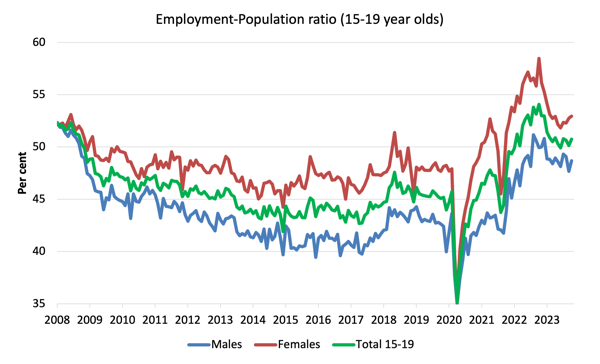
To put the teenage employment situation in a scale context (relative to their size in the population) the following graph shows the Employment-Population ratios for males, females and total 15-19 year olds since July 2008.
You can interpret this graph as depicting the change in employment relative to the underlying population of each cohort.
In terms of the recent dynamics:
1. The male ratio rose 1 point over the month.
2. The female ratio rose 0.2 points over the month.
3. The overall teenage employment-population ratio rose 0.6 points over the month.
Conclusion
My standard monthly warning: we always have to be careful interpreting month to month movements given the way the Labour Force Survey is constructed and implemented.
My overall assessment is:
1. Employment growth remains strong with a surprise uptick in full-time employment.
2. With participation rising by 0.2 points, the increase in the labour force outstripped the strong employment change, which meant that the unemployment rose by 0.1 points.
4. If the participation rate had not have changed, then the official unemployment rate would be 3.5 per cent rather than the official rate published of 3.9 per cent.
5. Underemployment also rose – there are now 10.4 per cent of the available and willing working age population who are being wasted in one way or another – either unemployed or underemployed.
6. Australia is not near full employment despite the claims by the mainstream commentators and it is hard to characterise this as a ‘tight’ labour market.
That is enough for today!
(c) Copyright 2023 William Mitchell. All Rights Reserved.
This Post Has 0 Comments