Economics and business correspondents regularly serve as apologists for poor policy. Their motivation is to…
US labour market – no sign of a major slowdown underway
Last Friday (December 8 , 2023), the US Bureau of Labor Statistics (BLS) released their latest labour market data – Employment Situation Summary – November 2023 – which showed payroll employment rising by 199,000 which is a good sign. The unemployment rate also fell as employment growth outstripped the growth in the labour force – down to 3.7 per cent (from 3.9 per cent). The participation rate rose by 0.1 point, indicating optimism among workers. I see no sign of a major slowdown emerging. Real wages have also started rising – modestly.
Overview for November 2023 (seasonally adjusted):
- Payroll employment increased by 199,000 (up from 150,000 last month).
- Total labour force survey employment rose by 747 thousand net (0.46 per cent).
- The labour force rose by 532 thousand net (0.32 per cent).
- The participation rate rose 0.1 point at 62.8 per cent.
- Total measured unemployment fell by 215 thousand to 6,291 thousand.
- The official unemployment rate fell 0.2 points to 3.7 per cent.
- The broad labour underutilisation measure (U6) fell 0.2 points to 7 per cent.
- The employment-population ratio rose 0.3 points to 60.5 per cent (still well below the June 2020 peak of 61.2).
For those who are confused about the difference between the payroll (establishment) data and the household survey data you should read this blog post – US labour market is in a deplorable state – where I explain the differences in detail.
Some months the difference is small, while other months, the difference is larger.
Payroll employment trends
The BLS noted that:
Total nonfarm payroll employment increased by 199,000 in November. Employment growth is below the average monthly gain of 240,000 over the prior 12 months but is in line with job growth in recent months …
In November, health care added 77,000 jobs, above the average monthly gain of 54,000 over the prior 12 months …
Government employment increased by 49,000 in November, in line with the average monthly gain of 55,000 over the prior 12 months …
Employment in manufacturing rose by 28,000 in November … Employment in manufacturing has shown little net change over the year.
In November, employment in leisure and hospitality continued to trend up (+40,000) … Leisure and hospitality had added an average of 51,000 jobs per month over the prior 12 months.
Employment in social assistance continued to trend up in November (+16,000) … Over the month, employment continued to trend up in individual and family services (+9,000).
Retail trade employment declined by 38,000 in November and has shown little net change over the year.
In November, employment in information changed little (+10,000) … Overall, employment in the information industry has declined by 104,000 since reaching a peak in November 2022.
Employment in transportation and warehousing changed little in November (-5,000) … Employment in transportation and warehousing has declined by 61,000 since a peak in October 2022.
Employment showed little change over the month in other major industries …
In summary, monthly payroll employment growth is now around pre-pandemic levels as the US labour market adjusts to the new normal.
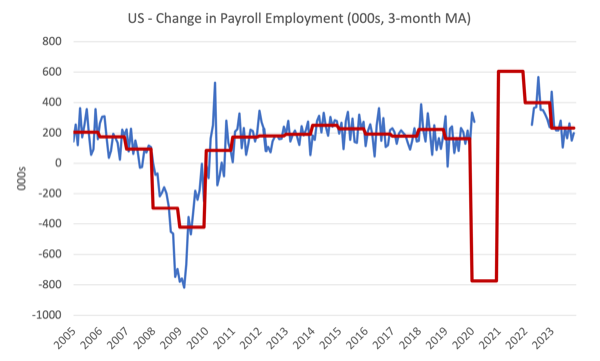
The first graph shows the monthly change in payroll employment (in thousands, expressed as a 3-month moving average to take out the monthly noise). The red lines are the annual averages. Observations between March 2020 and March 2022 were excluded as outliers.
The average line (which does not exclude the outliers) allows you to see the extent of the slowdown over the first two years of the Covid outbreak.
The next graph shows the same data in a different way – in this case the graph shows the average net monthly change in payroll employment (actual) for the calendar years from 2005 to 2023.
The red marker on the column is the current month’s result.
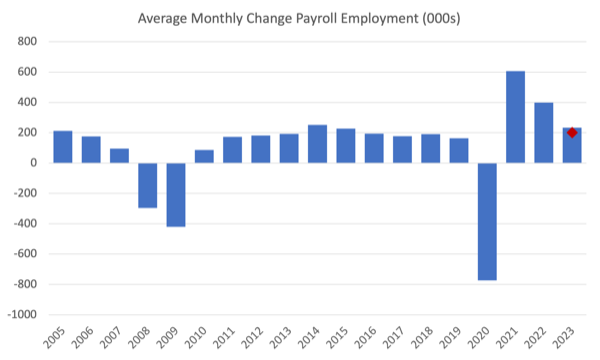
Average monthly change – 2019-2023 (000s)
| Year | Average Monthly Employment Change (000s) |
| 2019 | 163 |
| 2020 | -774 |
| 2021 | 606 |
| 2022 | 399 |
| 2023 (so far) | 232 |
Labour Force Survey data – employment growth strong
The seasonally-adjusted data for November 2023 reveals:
1. Total labour force survey employment rose by 747 thousand net (0.46 per cent) – a fairly significant reversal on last month.
2. The labour force rose by 532 thousand net (0.32 per cent) – reversing the large fall last month.
3.The participation rate rose by 0.1 point 62.8 per cent.
4. As a result (in accounting terms), total measured unemployment fell by 215 thousand to 6,291 thousand – which is a good sign, particularly with the increase in participation.
5. The official unemployment rate fell 0.2 points to 3.7 per cent.
I noted last month that I suspected some of the results published last month (which suggested a slowdown was in train) were sampling induced.
This month’s results show that there is no sign of a major recession imminent.
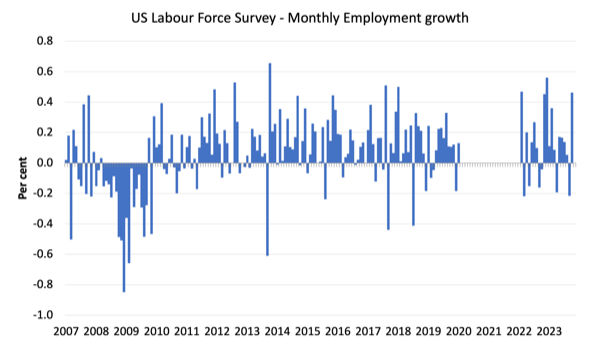
The following graph shows the monthly employment growth since January 2008 and excludes the extreme observations (outliers) between March 2020 and March 2022, which distort the current period relative to the pre-pandemic period.
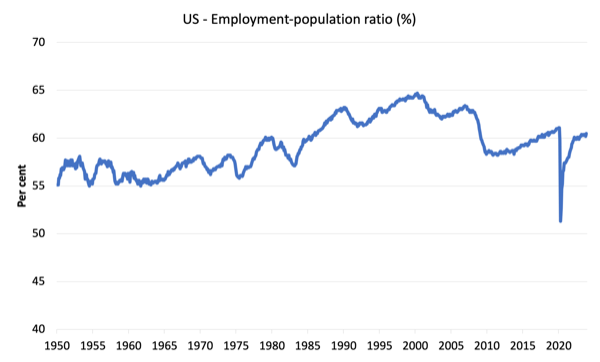
The Employment-Population ratio is a good measure of the strength of the labour market because the movements are relatively unambiguous because the denominator population is not particularly sensitive to the cycle (unlike the labour force).
The following graph shows the US Employment-Population from January 1950 to November 2023.
In September 2023, the ratio rose 0.3 points to 60.5 per cent.
The peak level in September 2020 before the pandemic was 61.1 per cent.
Unemployment and underutilisation trends
The BLS note that:
The unemployment rate edged down to 3.7 percent in November, and the number of unemployed persons showed little change at 6.3 million. …
In November, the number of long-term unemployed (those jobless for 27 weeks or more) edged down to 1.2 million. These individuals accounted for 18.3 percent of all unemployed persons …
The number of persons employed part time for economic reasons decreased by 295,000 to 4.0 million in November. These individuals, who would have preferred full-time employment, were working part time because their hours had been reduced or they were unable to find full-time jobs.
The first graph shows the official unemployment rate since January 1994.
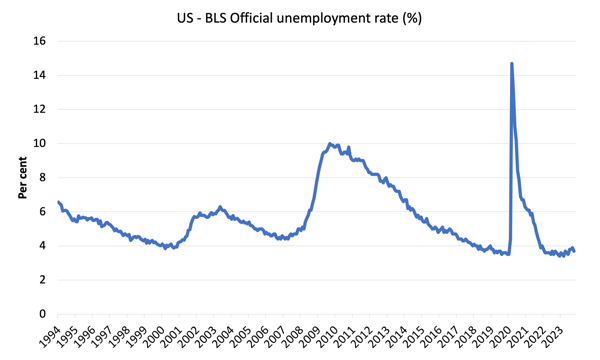
The official unemployment rate is a narrow measure of labour wastage, which means that a strict comparison with the 1960s, for example, in terms of how tight the labour market, has to take into account broader measures of labour underutilisation.
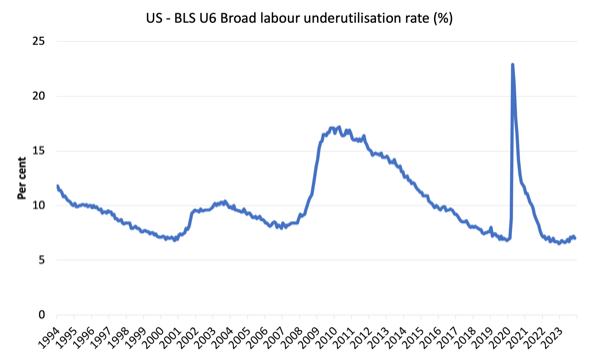
The next graph shows the BLS measure U6, which is defined as:
Total unemployed, plus all marginally attached workers plus total employed part time for economic reasons, as a percent of all civilian labor force plus all marginally attached workers.
It is thus the broadest quantitative measure of labour underutilisation that the BLS publish.
Pre-COVID, U6 was at 6.8 per cent (January 2019).
In September 2023 the U6 measure was 7 per cent down 0.2 points – partly because unemployment fell and also because underemployment fell.
What about wages growth in the US?
The BLS reported that:
In November, average hourly earnings for all employees on private nonfarm payrolls rose by 12 cents, or 0.4 percent, to $34.10. Over the past 12 months, average hourly earnings have increased by 4.0 percent. In November, average hourly earnings of private-sector production and nonsupervisory employees rose by 12 cents, or 0.4 percent, to $29.30.
Still no hint of a wages breakout emerging!
However, it was a good sign to see real wages rising.
The latest – BLS Real Earnings Summary – September 2023 (published November 14, 2023) – tells us that:
Real average hourly earnings for all employees increased 0.2 percent from September to October, seasonally adjusted … This result stems from an increase of 0.2 percent in average hourly earnings combined with no change in the Consumer Price Index for All Urban Consumers (CPI-U).
Real average weekly earnings decreased 0.1 percent over the month due to the change in real average hourly earnings combined with a 0.3-percent decrease in the average workweek.
Real average hourly earnings increased 0.8 percent, seasonally adjusted, from October 2022 to October 2023 …
So as inflation falls rather quickly, nominal wages growth is now allowing for modest real wage gains.
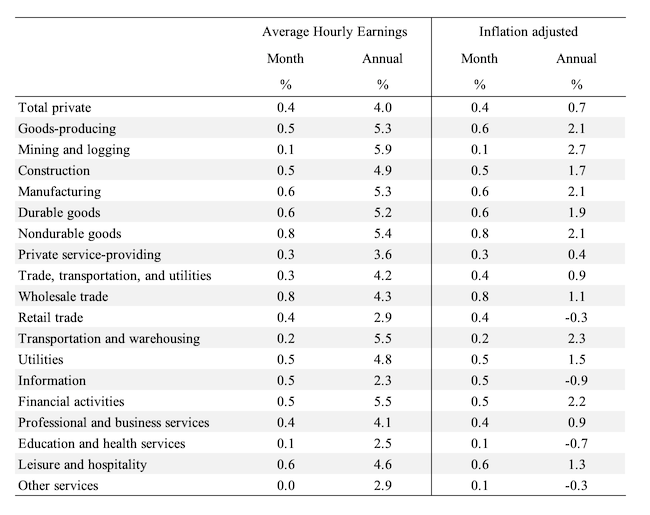
The following table shows the movements in nominal Average Hourly Earnings (AHE) by sector and the inflation-adjusted AHE by sector for September 2023 (note we are adjusting using the October CPI – the latest available).
All sectors recorded real wages growth over the month and only 4 sectors saw real wages fall on an annual basis.
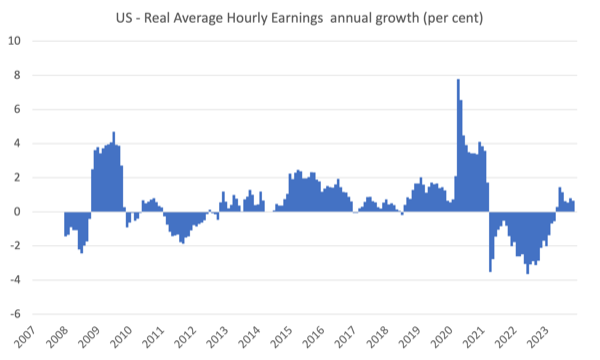
The following graph shows annual growth in real average hourly earnings from 2008 to November 2023.
The other indicator that tells us whether the labour market is turning in favour of workers is the quit rate.
The most recent BLS data – Job Openings and Labor Turnover Summary (released December 5, 2023) – shows that:
The number of job openings decreased to 8.7 million on the last business day of October … Over the month, the number of hires and total separations
changed little at 5.9 million and 5.6 million, respectively. Within separations, quits (3.6 million) and layoffs and discharges (1.6 million) changed little …In October, the number of quits changed little at 3.6 million, and the rate was 2.3 percent for the fourth consecutive month.
So in October 2023, the dynamics of the US labour market were pretty stable.
Conclusion
The latest monthly data shows payroll employment rising by 199,000 which is a good sign
The unemployment rate also fell as employment growth outstripped the growth in the labour force – down to 3.7 per cent (from 3.9 per cent).
The participation rate rose by 0.1 point, indicating optimism among workers.
I see no sign of a major slowdown emerging.
Real wages have also started rising – modestly.
That is enough for today!
(c) Copyright 2023 William Mitchell. All Rights Reserved.
This post might seem off-topic and I will understand if Bill deletes it. However, I want to raise the following issue as the elephant in the room. The issue of course is catastrophic climate change. To use an analogy, your car might be running beautifully and the view could be wonderful. But if you are about to drive your car over a cliff, then that is really the only salient existential issue at that point. You need to change course, hit the brakes or both. Even then, you need to take these emergency actions with some care so that you don’t lose control at the critical moment.
See “Yes, the Climate Crisis May Wipe out Six Billion People” – The Tyee.
The only thing I would cavil with is the “may”. On our current course, this magnitude of human die-off is almost to certain. We (humanity) wasted about 40 years after the first climate warnings and not just wasted that time but doubled down on endless growth and the selfish pursuit of ever-greater personal wealth in contradiction to the need for shared goods and environmental sustainability. Full MMT, social equality and sustainability policies could, maybe, still turn things around around if we act now.
With the wealthy elitists’ of the COP28 summit copping out as usual, being run by oil barons and swamped by fossil fuel lobbyists, the key questions are these:
(1) Is there any salutary climate disaster imminent at a national or regional level which could finally frighten the global population into action?
(2) If this happened would there still be time to change course and avert further and worse disasters?
I put it like that because I can see that scientific, logical and humanitarian arguments are still carrying no weight. The rich elites are ignoring every call for real action and the peoples of the world are still too divided and distracted.
Economic theory fails to situate itself within the larger ecosystem. So economic theory is unable to guide useful research activity. Economics, contrary to its purpose, harms us.
Elephant indeed, Ikonoclast!
1) No need exists to “frighten” anyone. Instead, economic theory that incorporates both “natural capital” and the negative effect of all energy consumption (increased entropy/pollution), *regardless of the energy’s source*, is needed to guide policy. (The vast, vast majority of people want to help the environment, but policy is lacking because underlying (economic) theory does not exist.)
2) Wilderness, water, woods, and wildlife that I loved are permanently destroyed. So, for me at least, it is already too late.