Over the last several years, I have been indicating that I think we are in…
Australian labour market deteriorates – employment growth negative, participation down, unemployment rising
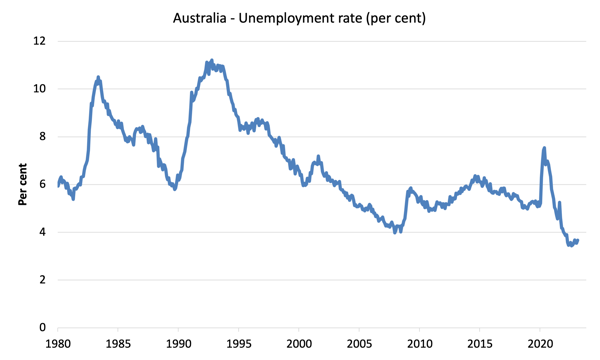
Yesterday we had the wages data. Today the Australian Bureau of Statistics (ABS) released of the latest labour force data (May 18, 2023) – Labour Force, Australia – for April 2023. The April result is the second consecutive month that the data is weaker. Employment fell by 4.3 thousand, participation fell by 0.1 point, and unemployment rose by 18.4 thousand even though the fall in the number of workers seeking work took some pressure of the situation. The unemployment rate rose from 3.5 per cent to 3.7 per cent. All the main aggregates are now in retreat – employment falling (also relative to the population), participation falling and unemployment rising. With yesterday’s wage data still revealing only modest wage increases and on-going and substantial real wage cuts, today’s data suggests the deterioration in the economy is underway. The underlying (‘What-if’) unemployment rate is closer to 4.9 per cent, which indicates the labour market still has slack. The broad underutilisation rate rose 0.1 point to 9.9 per cent and that means there are still 1,409.9 thousand Australian workers without work in one way or another (officially unemployed or underemployed).
The summary ABS Labour Force (seasonally adjusted) estimates for April 2023 are:
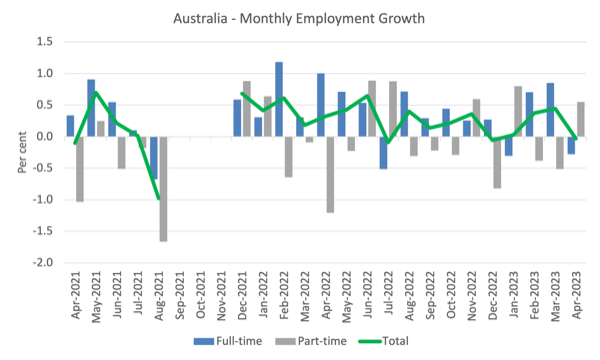
- Employment fell by 4,300 (-0.0) – full-time employment fell by 27,100 and part-time employment increased by 22,800.
- Unemployment rose 18,400 to 528,000 persons.
- The official unemployment rate rose by 0.2 points to 3.7 per cent.
- The participation rate fell 0.1 point to 66.7 per cent.
- The employment-population ratio fell by 0.2 points to 64.2 per cent.
- Aggregate monthly hours rose by 49 million hours (2.6 per cent).
- Underemployment fell by 0.1 point to 6.1 per cent (a fall of 12 thousand). Overall there are 881.9 thousand underemployed workers. The total labour underutilisation rate (unemployment plus underemployment) rose by 0.1 point to 9.8 per cent. There were a total of 1,409.9 thousand workers either unemployed or underemployed.
In its – Media Release – the ABS noted that:
… with employment dropping by around 4,000 people and the number of unemployed increasing by 18,000 people, the unemployment rate rose to 3.7 per cent … Similarly, the employment-to-population ratio fell 0.2 percentage points to 64.2 per cent and the participation rate decreased 0.1 percentage point to 66.7 per cent.
Conclusion: All the main aggregates are now in retreat – employment falling (also relative to the population), participation falling and unemployment rising.
With yesterday’s wage data still revealing only modest wage increases and on-going and substantial real wage cuts, today’s data suggests the deterioration in the economy is underway.
The RBA should be pleased to have forced people into unemployment for not valid reason.
Employment fell by 4,300 in April 2023
1. Full-time employment fell by 27,100 and part-time employment increased by 22,800.
2. The employment-population ratio fell by 0.2 points to 64.2 per cent.
A deterioration overall.
The following graph shows the month by month growth in full-time (blue columns), part-time (grey columns) and total employment (green line) for the 24 months to April 2023 using seasonally adjusted data.
I took out the observations from September to January 2021 – they were outliers due to the Covid wave at that time.
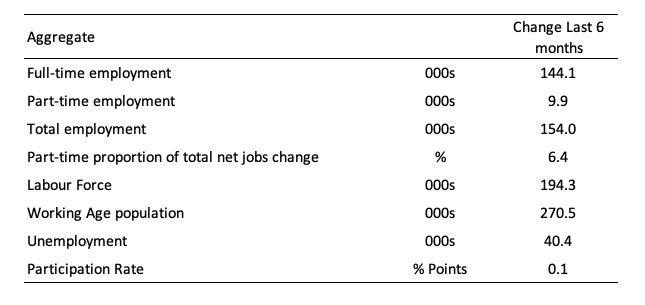
The following table provides an accounting summary of the labour market performance over the last six months to provide a longer perspective that cuts through the monthly variability and provides a better assessment of the trends.
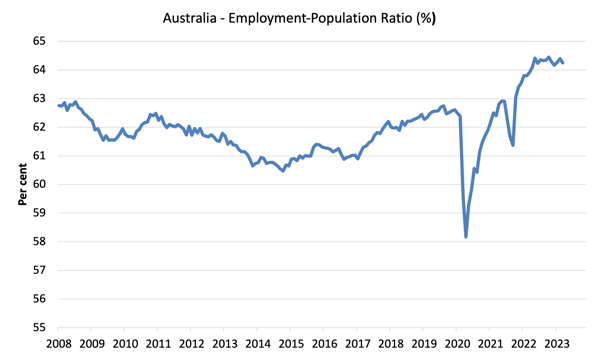
Given the variation in the labour force estimates, it is sometimes useful to examine the Employment-to-Population ratio (%) because the underlying population estimates (denominator) are less cyclical and subject to variation than the labour force estimates. This is an alternative measure of the robustness of activity to the unemployment rate, which is sensitive to those labour force swings.
The following graph shows the Employment-to-Population ratio, since January 2008 (that is, since the GFC).
The ratio ratio fell 0.2 points to 64.2 per cent in April 2023.
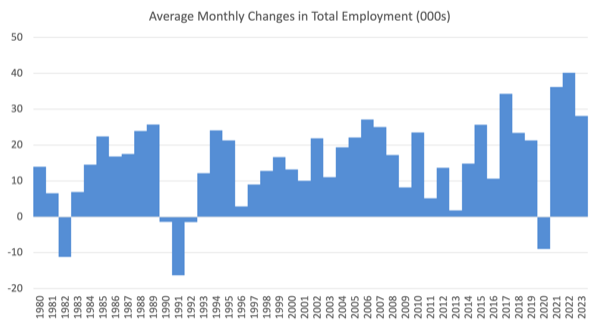
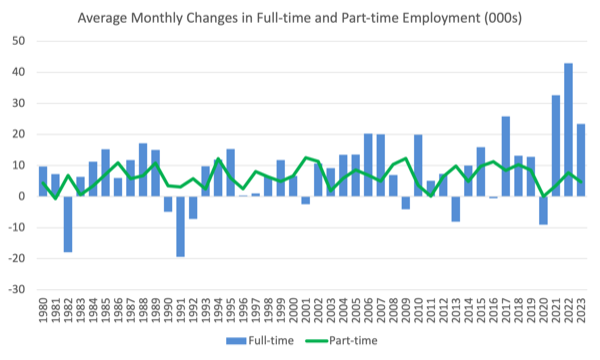
For perspective, the following graph shows the average monthly employment change for the calendar years from 1980 to 2022 (to date).
1. The average employment change over 2020 was -8.9 thousand which rose to 36.3 thousand in 2021 as the lockdowns eased.
2. For 2022, the average monthly change was 40.3 thousand.
3. So far, in 2023, the average change is 28.1 thousand and falling fast.
The following graph shows the average monthly changes in Full-time and Part-time employment (lower panel) in thousands since 1980.
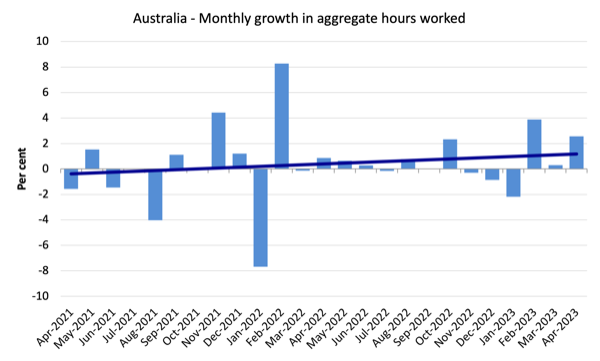
Hours worked rose by 49 million hours (2.6 per cent) in April 2023
The following graph shows the monthly growth (in per cent) over the last 24 months.
The dark linear line is a simple regression trend of the monthly change (skewed upwards by the couple of outlier results).
How come hours of work rose while overall employment fell?
The ABS note that:
This was because fewer people than usual worked reduced hours over the Easter period
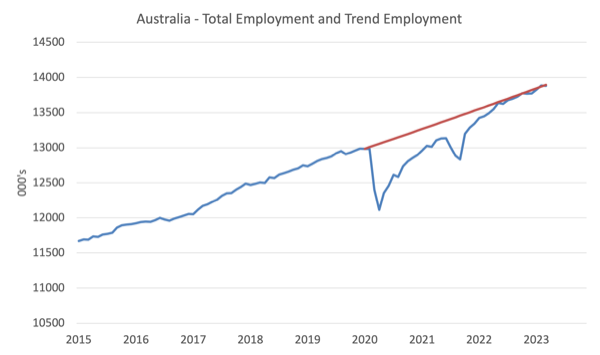
Actual and Trend Employment
The Australian labour market is now larger than it was in March 2020 and employment has just about returned to the pre-pandemic trend.
The following graph shows total employment (blue line) and what employment would have been if it had continued to grow according to the average growth rate between 2015 and April 2020.
In April 2023, the gap fell to just 13.2 thousand jobs.
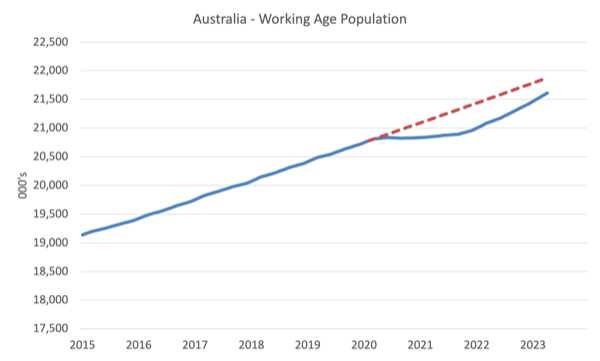
The Population Slowdown – the ‘What-if’ unemployment analysis
The following graph shows Australia’s working age population (Over 15 year olds) from January 2015 to April 2023. The dotted line is the projected growth had the pre-pandemic trend continued.
The difference between the lines is the decline in the working age population that followed the Covid restrictions on immigration.
The civilian population is 266.3 thousand less in April 2023 than it would have been had pre-Covid trends continued.
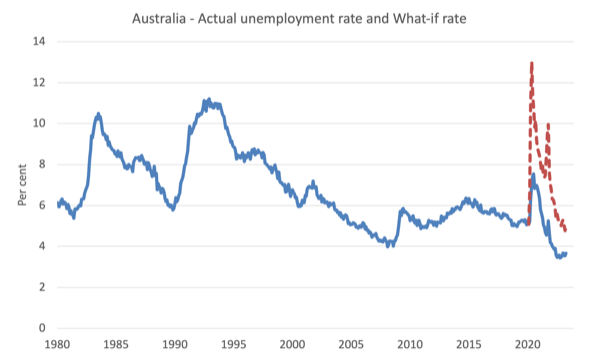
The following graph shows the evolution of the actual unemployment rate since January 1980 to April 2023 and the dotted line is the ‘What-if’ rate, which is calculated by assuming the most recent peak participation rate (recorded at November 2022 = 66.8 per cent), the extrapolated working age population (based on growth rate between 2015 and March 2020) and the actual employment since March 2020.
It shows what the unemployment rate would have been given the actual employment growth had the working age population trajectory followed the past trends.
In this blog post – External border closures in Australia reduced the unemployment rate by around 2.7 points (April 28, 2022), I provided detailed analysis of how I calculated the ‘What-if’ unemployment rate.
So instead of the current unemployment rate of 3.7 per cent, the rate would have been 4.9 per cent in April 2023, given the employment performance since the pandemic.
So while the RBA claims the labour market is ‘tight’, the reality is somewhat different.
Unemployment rose 18,400 to 528,000 persons in April 2023
Even with the decline in participation (less people looking for work), unemployment rose because the labour force increased by 14.1 thousand on the back of the underlying population growth and employment fell by 4.3 thousand.
The following graph shows the national unemployment rate from January 1980 to April 2023. The longer time-series helps frame some perspective to what is happening at present.
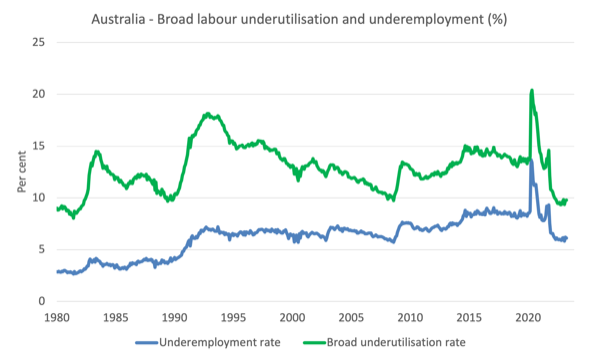
Broad labour underutilisation rises 0.1 points to 9.8 per cent in April 2023
1. Underemployment fell by 0.1 point to 6.1 per cent (a fall of 12 thousand).
2. Overall there are 881.9 thousand underemployed workers.
3. he total labour underutilisation rate (unemployment plus underemployment) rose by 0.1 point to 9.8 per cent.
4. There were a total of 1,409.9 thousand workers either unemployed or underemployed.
The following graph plots the seasonally-adjusted underemployment rate in Australia from April 1980 to the April 2023 (blue line) and the broad underutilisation rate over the same period (green line).
The difference between the two lines is the unemployment rate.
Teenage labour market follows overall path down in April 2023
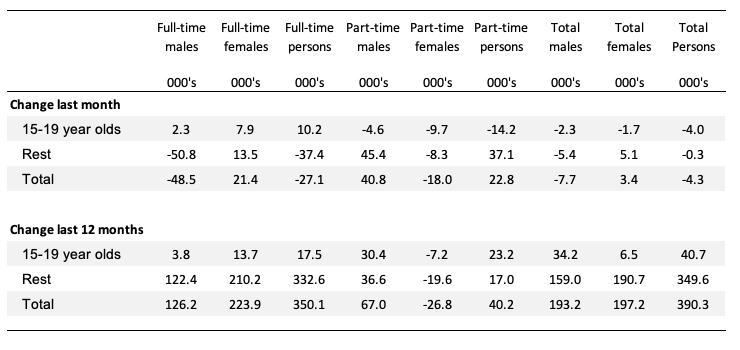
Teenagers lost 4 thousand net jobs in April with full-time jobs rising 10.2 thousand and part-time falling 14.2 thousand.
The following Table shows the distribution of net employment creation in the last month and the last 12 months by full-time/part-time status and age/gender category (15-19 year olds and the rest).
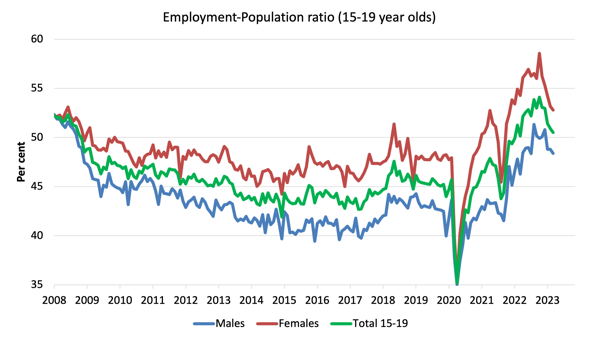
To put the teenage employment situation in a scale context (relative to their size in the population) the following graph shows the Employment-Population ratios for males, females and total 15-19 year olds since June 2008.
You can interpret this graph as depicting the change in employment relative to the underlying population of each cohort.
In terms of the recent dynamics:
1. The male ratio fell 0.4 points over the month.
2. The female ratio fell by 0.4 points.
3. The overall teenage employment-population ratio fell by 0.4 points over the month.
Conclusion
My standard monthly warning: we always have to be careful interpreting month to month movements given the way the Labour Force Survey is constructed and implemented.
My overall assessment is:
1. The April result is the second consecutive month that the data is weaker. Employment fell by 4.3 thousand, participation fell by 0.1 point, and unemployment rose by 18.4 thousand even though the fall in the number of workers seeking work took some pressure of the situation. The unemployment rate rose from 3.5 per cent to 3.7 per cent.
2. All the main aggregates are now in retreat – employment falling (also relative to the population), participation falling and unemployment rising.
3. With yesterday’s wage data still revealing only modest wage increases and on-going and substantial real wage cuts, today’s data suggests the deterioration in the economy is underway. The underlying (‘What-if’) unemployment rate is closer to 4.9 per cent, which indicates the labour market still has slack.
4. The broad underutilisation rate rose 0.1 point to 9.9 per cent and that means there are still 1,409.9 thousand Australian workers without work in one way or another (officially unemployed or underemployed).
5. That extent of idle labour means Australia is not really close to full employment despite the claims by the mainstream commentators.
That is enough for today!
(c) Copyright 2023 William Mitchell. All Rights Reserved.
Counterfactuals cannot be used to draw inferences about current conditions. Thus, we cannot infer that “the labour market still has slack” from a counterfactual regarding immigration.
One could argue that there “would be” slack had immigration not stopped due to the pandemic (though such counterfactuals are easy to dispute).
But immigration *was* halted, so the slack does not exist. (Of course, this is the reason that massive immigration increases have been announced. The attempt is being made to generate slack that does *not* exist currently.)