Over the last several years, I have been indicating that I think we are in…
First signs of a slowdown in the US labour market
Last Friday (July 8, 2022), the US Bureau of Labor Statistics (BLS) released their latest labour market data – Employment Situation Summary – June 2022 – which reported a total payroll employment rise of only 372,000 jobs and an official unemployment rate of 3.6 per cent. While it might seem that the June and May results were steady as she goes, the reality is that the June figures reveal the first signs of a slowdown in the US labour market. The labour survey employment measure fell as did the participation rate. There was a fall in the employment-population ratio, a fairly reliable measure that the demand-side is lagging behind the supply-side. The US labour market is still 524 thousand payroll jobs short from where it was at the end of May 2020, which helps to explain why there are no wage pressures emerging. Real wages continued to decline as the supply disruptions and the greed of increased corporate profit margin push sustain the inflationary pressures. Any analyst who is claiming the US economy is close to full employment hasn’t looked at the data. The justification by the US Federal Reserve for pushing up interest rates to quell wages pressure does not stack up with the evidence.
Overview for June 2022:
- Payroll employment increased by 372,000.
- Total labour force survey employment fell by 315 thousand net (0.2 per cent).
- The seasonally adjusted labour force fell by 353 thousand net (0.21 per cent).
- The employment-population ratio fell by 0.2 points to 59.9 per cent (still lower than the May 2020 peak of 61.2).
- Official unemployment fell by 38 thousand to 5,912 thousand.
- The official unemployment rate was unchanged at 3.6 per cent.
- The participation rate fell by 0.1 points to 62.2 per cent.
- The broad labour underutilisation measure (U6) fell 0.4 points to 6.7 per cent as underemployment increased.
For those who are confused about the difference between the payroll (establishment) data and the household survey data you should read this blog post – US labour market is in a deplorable state – where I explain the differences in detail.
Some months the difference is small, while other months, the difference is larger.
The differences were quite large this month.
Payroll employment trends
The BLS noted that:
Total nonfarm payroll employment rose by 372,000 in June, in line with the average monthly gain over the prior 3 months (+383,000). In June, notable job growth occurred in professional and business services, leisure and hospitality, and health care …
Total nonfarm employment is down by 524,000, or 0.3 percent, from its pre-pandemic level in February 2020. Private-sector employment has recovered the net job losses due to the pandemic and is 140,000 higher than in February 2020, while government employment is 664,000 lower.
Employment in professional and business services continued to grow, with an increase of 74,000 in June … is 880,000 higher than in February 2020.
In June, leisure and hospitality added 67,000 jobs … is down by 1.3 million, or 7.8 percent, since February 2020.
Employment in health care rose by 57,000 in June … is below its February 2020 level by 176,000, or 1.1 percent.
In June, transportation and warehousing added 36,000 jobs … is 759,000 above its February 2020 level.
Employment in manufacturing increased by 29,000 in June and has returned to its February 2020 level.
Information added 25,000 jobs in June … is 105,000 higher than in February 2020.
In June, employment in social assistance rose by 21,000 … is down by 87,000, or 2.0 percent, since February 2020.
Wholesale trade added 16,000 jobs in June … is down by 18,000, or 0.3 percent, since February 2020.
Mining employment rose by 5,000 in June … is 86,000 above a recent low in February 2021.
Employment showed little change over the month in other major industries, including construction, retail trade, financial activities, other services, and government.
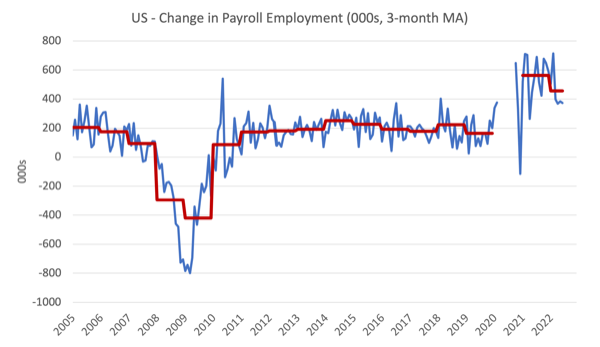
The first graph shows the monthly change in payroll employment (in thousands, expressed as a 3-month moving average to take out the monthly noise). The red lines are the annual averages. I left out the observations between January 2020 and September 2020, which were so extreme that they make it harder to compare the current period with the pre-pandemic history.
The US labour market is still 524 thousand jobs short from where it was at the end of May 2020 and the commentary from the BLS above tells us how this shortfall is distributed across the sectors.
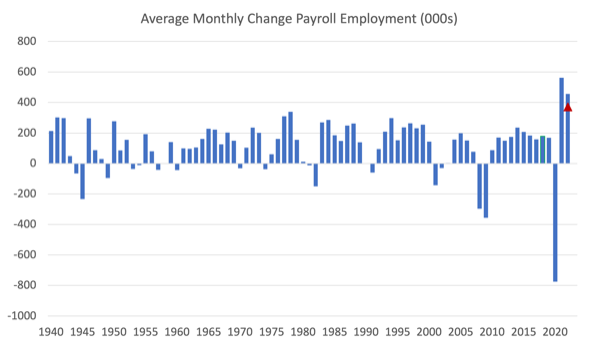
The next graph shows the same data in a different way – in this case the graph shows the average net monthly change in payroll employment (actual) for the calendar years from 2005 to 2021.
The red marker on the column is the current month’s result.
The final average for 2019 was 164 thousand.
The final average for 2020 was -774 thousand.
The final average for 2021 was 562 thousand.
The average so far in 2022 is 457 thousand.
Labour Force Survey – employment growth declines
The data for June 2022 reveals:
1. Total labour force survey employment fell by 315 thousand net (0.2 per cent).
2. The seasonally adjusted labour force fell by 353 thousand net (0.21 per cent).
3. The participation rate fell by 0.1 points to 62.2 per cent.
4. As a result (in accounting terms), total measured unemployment fell by 38 thousand to 5,912 thousand and the official unemployment rate was unchanged at 3.6 per cent (rounded to one decimal place).
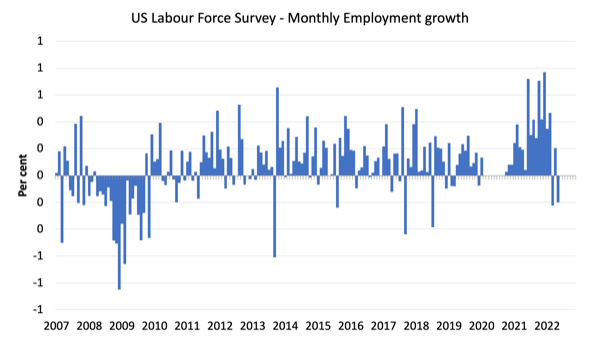
The following graph shows the monthly employment growth since January 2008 and excludes the extreme observations (outliers) between May 2020 and October 2020, which distort the current period relative to the pre-pandemic period.
The Employment-Population ratio is a good measure of the strength of the labour market because the movements are relatively unambiguous because the denominator population is not particularly sensitive to the cycle (unlike the labour force).
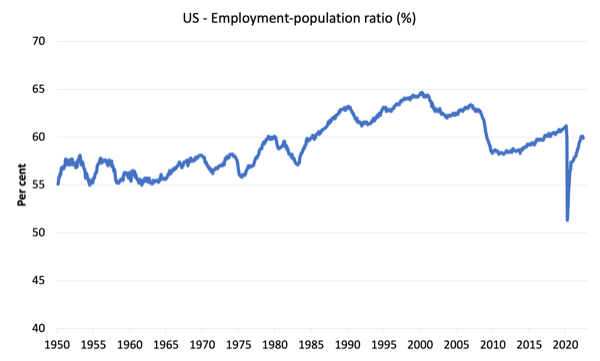
The following graph shows the US Employment-Population from January 1950 to June 2022.
While the ratio fluctuates a little, the May 2020 ratio fell by 8.6 points to 51.3 per cent, which is the largest monthly fall since the sample began in January 1948.
In June 2022, the ratio fell by 0.2 points to 59.9 per cent signifying a weakening of the labour market.
The peak level in May 2020 before the pandemic was 61.1 per cent.
Unemployment and underutilisation trends
The BLS note that:
The unemployment rate was 3.6 percent for the fourth month in a row, and the number of unemployed persons was essentially unchanged at 5.9 million in June. These measures are little different from their values in February 2020 (3.5 percent and 5.7 million, respectively), prior to the coronavirus (COVID-19) pandemic….
In June, the number of long-term unemployed (those jobless for 27 weeks or more) was essentially unchanged at 1.3 million. This measure is 215,000 higher than in February 2020. The long-term unemployed accounted for 22.6 percent of all unemployed persons in June …
The number of persons employed part time for economic reasons declined by 707,000 to 3.6 million in June and is below its February 2020 level of 4.4 million. These individuals, who would have preferred full-time employment, were working part time because their hours had been reduced or they were unable to find full-time jobs …
The first graph shows the official unemployment rate since January 1994.
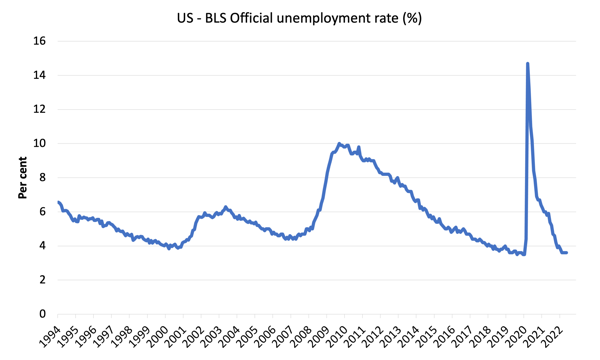
The official unemployment rate is a narrow measure of labour wastage, which means that a strict comparison with the 1960s, for example, in terms of how tight the labour market, has to take into account broader measures of labour underutilisation.
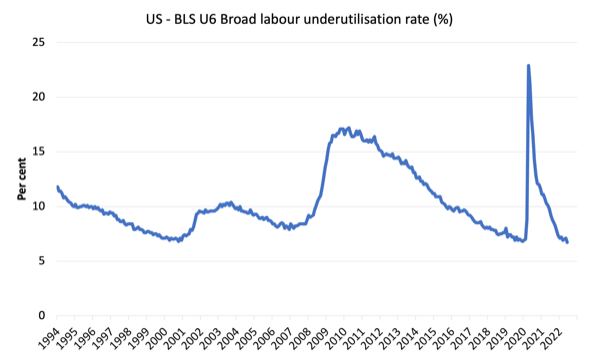
The next graph shows the BLS measure U6, which is defined as:
Total unemployed, plus all marginally attached workers plus total employed part time for economic reasons, as a percent of all civilian labor force plus all marginally attached workers.
It is thus the broadest quantitative measure of labour underutilisation that the BLS publish.
Pre-COVID, U6 was at 6.8 per cent (December 2019).
In June 2022 the U6 measure was 6.7 per cent, a fall of 0.4 points on the previous month.
The fall was largely due to the significant fall in workers forced to work part-time for economic reasons – which is the US indicator of underemployment.
Ethnicity and Education
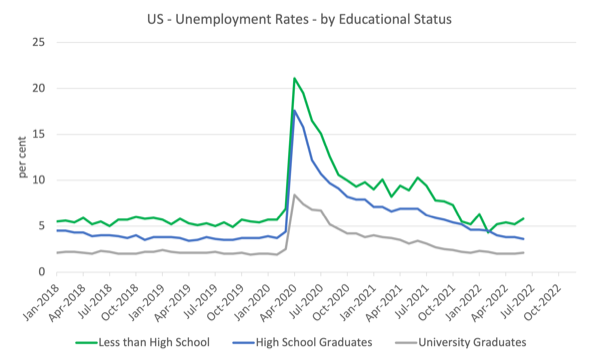
The next graph shows the evolution of unemployment rates for three cohorts based on educational attainment: (a) those with less than high school completion; (b) high school graduates; and (c) university graduates.
The unemployment rate for a person with a university degree is 2.1 per cent, while the other groups are much higher.
In the collapse in employment in the early months of the pandemic, the unemployment rates rose by:
- 14.2 points for those with less than high-school diploma.
- 13.2 points for high school, no college graduates.
- 5.9 points for those with university degrees.
The period since May 2020 has seen the unemployment rate fall by:
- 15.3 points for those with less than high-school diploma meaning the unemployment rate is now 1.1 points below the March 2020 level.
- 14 points for high school, no college graduates meaning the unemployment rate is now 0.8 points above the March 2020 level.
- 6.3 points for those with university degrees meaning the unemployment rate is now 0.4 points below the March 2020 level.
In the last month, the change in the unemployment rate has been:
- a rise of 0.6 points for those with less than high-school diploma.
- a fall of 0.2 points for high school, no college graduates.
- a rise of 0.1 points for those with university degrees.
So the least educated are now going backwards – the first signs of a more general decline in the labour market.
In the US context, the trends in trends in unemployment by ethnicity are interesting.
Two questions arise:
1. How have the Black and African American and White unemployment rate fared in the post-GFC period?
2. How has the relationship between the Black and African American unemployment rate and the White unemployment rate changed since the GFC?
Summary:
1. All the series move together as economic activity cycles. The data also moves around a lot on a monthly basis.
2. The Black and African American unemployment rate was 6.8 per cent in May 2020, rose to 16.6 per cent in May 2020 and is at 5.8 per cent in June 2022. In the last month, it was fell by 0.4 points.
3. The Hispanic or Latino unemployment rate was 6 per cent in May 2020, rose to 18.9 per cent in May and is at 4.3 per cent in June 2022. In the last month, it was unchanged.
4. The White unemployment rate was 3.9 per cent in May 2020, rose to 14.1 per cent in May and fell to 3.3 per cent in June 2022 – a rise of 0.1 point over the month.
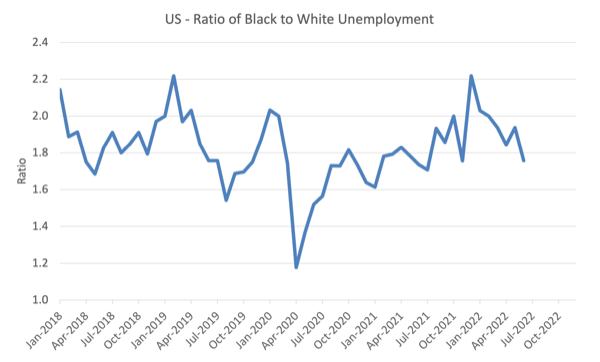
The next graph shows the Black and African American unemployment rate to White unemployment rate (ratio) from January 2018, when the White unemployment rate was at 3.5 per cent and the Black or African American rate was at 7.5 per cent.
This graph allows us to see whether the relative position of the two cohorts has changed since the crisis.
If it is rising, then the unemployment rate of the Black and African American cohort is either rising faster than the white unemployment rate or falling more slowly (or a combination of that relativity).
As the pandemic hit, the ratio rose and peaked at 2.2 in December 2021.
In June 2022, the ratio was 1.76, a decline of 0.17 points over the month, which indicates that the relative position of the Black and African American cohort has improved.
Special analysis this month – What are wages doing in the US?
With inflation rising sharply at present and the Federal Reserve pretending there is a major wage problem that needs to be disciplined with rising mass unemployment, one would expect to see strong nominal wages growth pushing the price level along.
The BLS reported that:
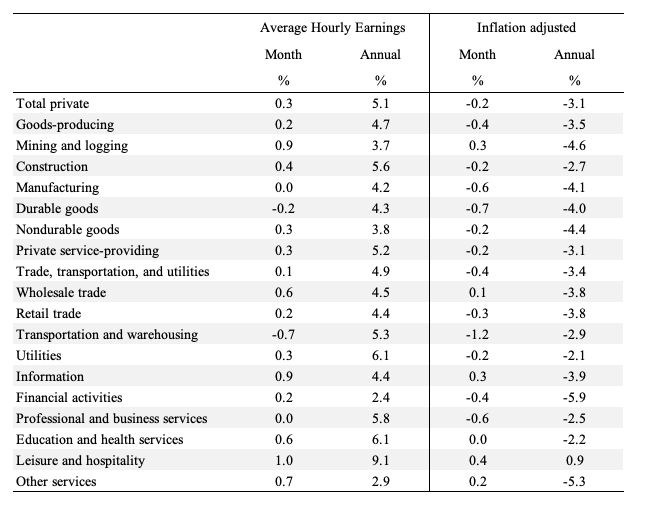
In June, average hourly earnings for all employees on private nonfarm payrolls rose by 10 cents, or 0.3 percent, to $32.08. Over the past 12 months, average hourly earnings have increased by 5.1 percent. In June, average hourly earnings of private-sector production and nonsupervisory employees rose by 13 cents, or 0.5 percent, to $27.45.
The following table shows the movements in nominal Average Hourly Earnings (AHE) by sector and the inflation-adjusted AHE by sector for June 2022 (note we are adjusting using the April CPI – the latest available).
Over the last month, real wages fell in all sectors bar leisure and hospitality.
We keep hearing that wages growth is a problem for US inflation.
But, if wages growth was pushing the inflation rate we would not be seeing persistent real wages cuts.
The following graph shows the annual hourly earnings growth for all private employees since May 2007.
In the last month, the growth rate declined and is well below the inflation rate. Wages growth is not driving the supply-side inflation acceleration.
There is no accelerating trend.
In fact since March 2022, the monthly growth rate has been systematically declining.
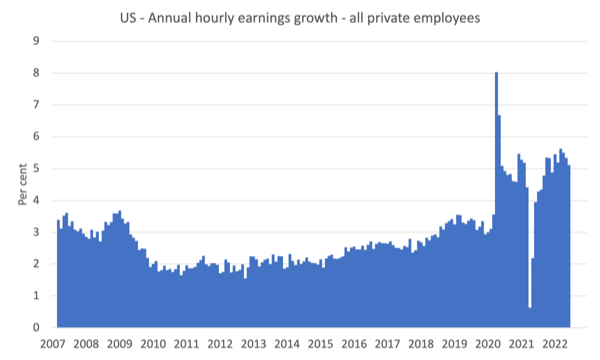
Note that the above graph is in nominal terms.
The latest – BLS Real Earnings Summary (published June 10, 2022) – tells us that:
Real average hourly earnings for all employees decreased 0.6 percent from April to May, seasonally adjusted … This result stems from an increase of 0.3 percent in average hourly earnings combined with an increase of 1.0 percent in the Consumer Price Index for All Urban Consumers (CPI-U).
Real average weekly earnings decreased 0.7 percent over the month due to the change in real average hourly earnings combined with no change in the average workweek.
Real average hourly earnings decreased 3.0 percent, seasonally adjusted, from May 2021 to May 2022. The change in real average hourly earnings combined with a decrease of 0.9 percent in the average workweek resulted in a 3.9-percent decrease in real average weekly earnings over this period.
Workers are not catching up with the price level rises and can hardly be said to be pressuring inflation.
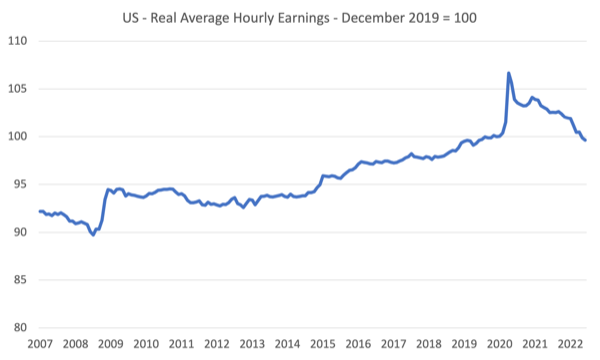
The following graph shows movements in real average hourly earnings (indexed at 100 at December 2019) up to June 2022 tells the story.
The spike in the early period of the pandemic was the result of hours adjustments rather than earnings growth.
And, from the latest – Productivity and Costs, First Quarter 2022, Revised (published June 2, 2022) – report, we find that:
Nonfarm business sector labor productivity decreased 7.3 percent in the first quarter of 2022 … as output decreased 2.3 percent and hours worked increased 5.4 percent. This is the largest decline in quarterly productivity since the third quarter of 1947, when the measure decreased 11.7 percent … From the same quarter a year ago, nonfarm business sector labor productivity decreased 0.6 percent, reflecting a 4.2-percent increase in output that was outpaced by a 4.8-percent increase in hours worked. This is the largest four-quarter decline since the fourth quarter of 1993, when the measure also declined 0.6 percent.
Even though productivity growth slumped in the first quarter of 2022, real hourly earnings growth continues to lag behind productivity growth over a longer period.
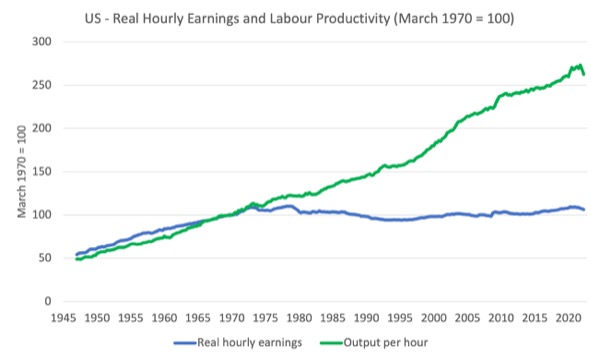
The following graph tells the story.
It shows real hourly earnings and labour productivity (output per hour) indexed at 100 in the May-quarter 1970 (around the time the two series started to diverge).
Workers have enjoyed hardly any real wages growth since 1970 (rising by just 6.3 per cent) whereas productivity growth has risen by 162 per cent.
There has been a massive redistribution of national income away from workers towards profits over this long period.
This depicts the failure of Capitalism to serve the best interests of the people.
Conclusion
In June 2022, the first signs of a slowdown in the US labour market became visible.
The labour survey employment measure fell as did the participation rate.
There was a fall in the employment-population ratio, a fairly reliable measure that the demand-side is lagging behind the supply-side.
The US labour market is still 524 thousand jobs short from where it was at the end of March 2020.
There are no fundamental wage pressures emerging at present despite the spikes in inflation arising from supply chain constraints.
Real wages are falling.
The US labour market is still some way from being at full employment.
That is enough for today!
(c) Copyright 2022 William Mitchell. All Rights Reserved
The labour force statistics are odd. Participation is down, typically an indicator of a difficult labour market when many workers give up looking for a job, yet broad labour under-utilisation is at its lowest point in 28 years according to the graph Bill has reproduced. The situation here in Canada is very similar. Employers in the US (and in Canada) are complaining they can’t find workers. This complaint is certainly true for low wage workers. Restaurants I go to in Ottawa and Gatineau have cut back their opening hours quite considerably due to a lack of staff. Canadian airports and airlines are not running properly because they can’t find workers. Of course wages should rise to induce more people to take those jobs but shortages exist in better paid fields as well. There are persistent reports of medical professionals leaving their professions in droves. And there are help wanted signs everywhere.
Yves Smith of Naked Capitalism (June15, 2022) posits that labour supply in the US has dropped significantly: “Covid led many, particularly in the medical establishment, to retire early. Covid also got some couples to realize they could get by on one income and they’ve decided they like it that way. Some low wage workers decided they aren’t going back to high risk positions in restaurants and retail. Some got long Covid and can’t work full time. And a million people died, some of them working age. Pilot shortages are the tip of the iceberg of a thinning out among seasoned employees who are hard to replace”. Also (June 8) “… Some realized they could get by on one or one and a half income(s) rather than two after they ditched the costs related to having a two earner household with kids…”
I hope our statistical agencies will eventually sort out what’s going on and provide some analysis.
The advanced economies of the west went from a long standing deflation to raging inflation.
But, if deflation was the result of cheap labour in China, it was obvious that deflation would turn into inflation, as soon as some disruption would harm global trade.
So came the pandemic.
The priests of the neoliberal religion had it all figured out, though.
All that was needed was to get China on its knees. But how?
Forcing the west into a second great depression would bring down China exports, foreclosing millions of businesses in China and forcing Xi out.
So, they’ll keep raising rates, until unpemployment in the west gets to something like 30%.
It was tested in Greece and it worked.
But, is China exactly in the same spot as Greece was in 2008?
No chance!
I Do not have the figures but it feels similar here in the south of England anyway as described by
Keith Newman in Canada especially In hospitality.Some managed to find other work and found it
Better than being run off your feet for double shifts etc
Still no means or desire to turn any labour shortages into struggle for higher wages.
Inflation is hurting and austerity and wage moderation is back on the agenda in the
Race to succeed Johnson as uk pm.
Keith,
well, some of it, at least, was entirely predictable. American doctors and nurses about a year ago were openly (but anonymously) writing online how they were leaving for hospice work, as they were overworked, overstaffed, and undersupplied, and getting more so as their colleagues left with no replacement forthcoming. Not that low skilled airport workers were let go in droves, and decided not to go back. Hospitality workers were badly mistreated by employers and costumers alike, and also wrote they were done.
One wonders if inducing high unemployment (commonly known as raising interest rates for some unknown reasons) isn’t mostly to discipline workers into going accepting anything – one wonders, but not too much, it’s almost explicit. Politically, I’d say capital is planning to overplay their hand while ignoring the board, and workers will repudiate moderation to one side or the other. They might even be expecting the winner to be the side who will grant them even more unchecked power, but it’s a pretty big aggressive gamble if so.
Statistics just won’t support story that people have retired en mass. Activity rate is within half a percentage point where it was before recession: https://fred.stlouisfed.org/series/LRAC64TTUSM156S