The recent extreme weather in the northern hemisphere, the twin monster tropical storms in Japan,…
Australian labour market continues to improve but there are warning signs
The Australian Bureau of Statistics (ABS) released of the latest labour force data today (July 14, 2022) – Labour Force, Australia – for June 2022. The labour market improved in June following up the gains in May after several months of weakness. The robust full-time employment growth was a good sign as was the increasing participation rate. That particularly favoured the younger workers. The official unemployment rate fell to levels not seen since 1974 but the underlying (‘What-if’) unemployment rate is closer to 5.7 per cent rather than the official rate of 3.5 per cent. Underemployment rose sharply however and while unemployment fell by 54,300, those in part-time work who desired more hours rose by 49,700. In other words, the jobs growth was biased towards the lower end of the hours distribution. There are still 1350.9 thousand Australian workers without work in one way or another (officially unemployed or underemployed). The only reason the unemployment rate is so low is because the underlying population growth remains low after the border closures over the last two years. With Covid infection rates rising quickly, and already around 780,000 workers working few hours than usual because of sickness, stay tuned for a deterioration in the labour market in the coming months.
The summary ABS Labour Force (seasonally adjusted) estimates for June 2022 are:
- Employment increased by 88,400 (0.7 per cent) – full-time employment increased by 52,900 and part-time employment increased by 35,500.
- Unemployment fell by 54,300 to 493,900 persons.
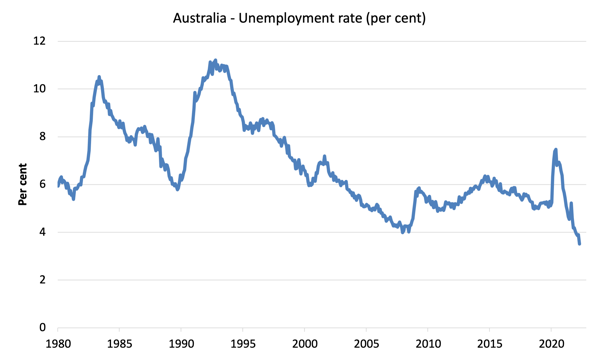
- The official unemployment rate fell 0.4 points to 3.5 per cent.
- The participation rate increased 0.1 points to 66.8 per cent.
- The employment-population ratio increased by 0.3 points to 64.1 per cent.
- Aggregate monthly hours was unchanged.
- Underemployment increased by 0.4 points to 6.1 per cent (a rise of 49.7 thousand). Overall there are 857 thousand underemployed workers. The total labour underutilisation rate (unemployment plus underemployment) was unchanged at 9.6 per cent – the rise in underemployment being offset by the fall in official unemployment. There were a total of 1350.9 thousand workers either unemployed or underemployed.
In its – Media Release – the ABS noted that:
With employment increasing by 88,000 people and unemployment falling by 54,000, the unemployment rate fell by 0.4 percentage points, to 3.5 per cent …
This is the lowest unemployment rate since August 1974, when it was 2.7 per cent and the survey was quarterly …
The large fall in the unemployment rate this month reflects more people than usual entering employment and also lower than usual numbers of employed people becoming unemployed. Together these flows reflect an increasingly tight labour market, with high demand for engaging and retaining workers, as well as ongoing labour shortages …
there was almost the same number of unemployed people in June 2022 (494,000 people) as vacant jobs …
In line with large numbers of COVID-19 cases in June, the number of people working reduced hours due to illness continued to be high. This reflected ongoing disruption associated with the Omicron variant and cases of influenza …
There was around 780,000 people working fewer hours than usual due to own illness in June 2022, almost double the usual number we see at the start of winter.
Employment increased by 88,400 in June 2022
1. Employment growth continued to be strong rising by just 88,400 (0.7) per cent.
2. Full-time employment increased by 52,900 and part-time employment increased by 35,500.
3. Employment in Australia is 598.4 thousand (net) jobs (4.6 per cent) above the pre-pandemic level in February 2020.
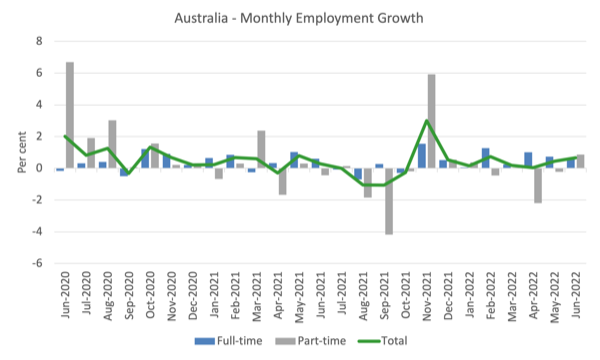
The following graph shows the month by month growth in full-time (blue columns), part-time (grey columns) and total employment (green line) for the 24 months to June 2022 using seasonally adjusted data.
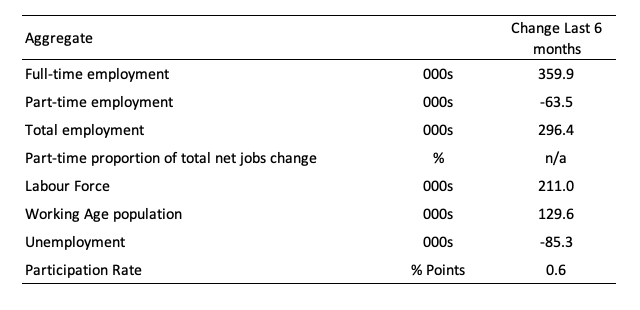
The following table provides an accounting summary of the labour market performance over the last six months to provide a longer perspective that cuts through the monthly variability and provides a better assessment of the trends.
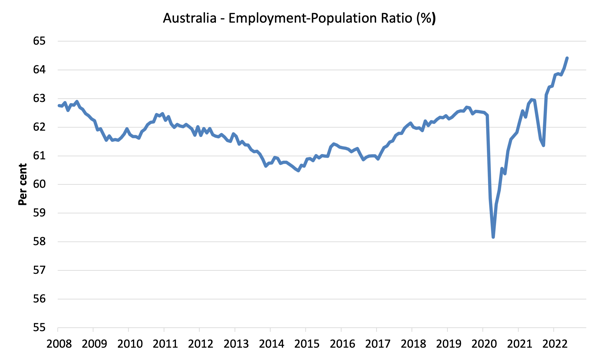
Given the variation in the labour force estimates, it is sometimes useful to examine the Employment-to-Population ratio (%) because the underlying population estimates (denominator) are less cyclical and subject to variation than the labour force estimates. This is an alternative measure of the robustness of activity to the unemployment rate, which is sensitive to those labour force swings.
The following graph shows the Employment-to-Population ratio, since April 2008 (that is, since the GFC).
There are two forces working here – the denominator (population) is clearly pushing the ratio down due to the slower population growth as the external border openings take a while to impact on inflow.
This is forcing employers to search harder for workers already in Australia rather than discriminate against the unemployed.
The numerator (employment) is clearly positive.
The ratio increased by 0.3 points to 64.4 per cent in June 2022 – a strong result.
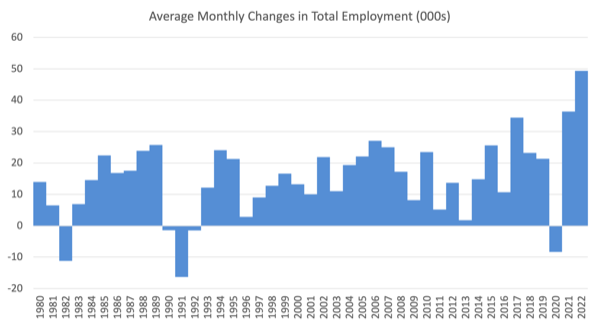
For perspective, the following graph shows the average monthly employment change for the calendar years from 1980 to 2022 (to date).
1. The average employment change over 2020 was -8.4 thousand which rose to 33.3 thousand in 2021 as the lockdowns eased.
3. So far in 2022, the average monthly change is 49.4 thousand.
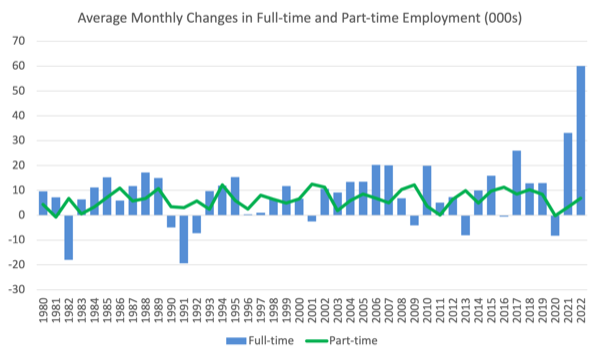
The following graph shows the average monthly changes in Full-time and Part-time employment (lower panel) in thousands since 1980.
The interesting result is that during recessions or slow-downs, it is full-time employment that takes the bulk of the adjustment. Even when full-time employment growth is negative, part-time employment usually continues to grow.
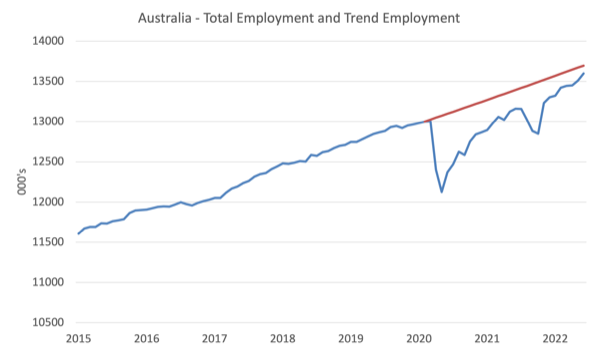
Actual and Trend Employment
The Australian labour market is now larger than it was in April 2020. But it is still a long way from where it would have been if it had have continued to expand at the previous trend.
The following graph shows total employment (blue line) and what employment would have been if it had continued to grow according to the average growth rate between 2015 and April 2020.
In June 2022, the gap fell by 62.9 thousand to 97.3 thousand jobs as a result of the stronger than usual employment growth.
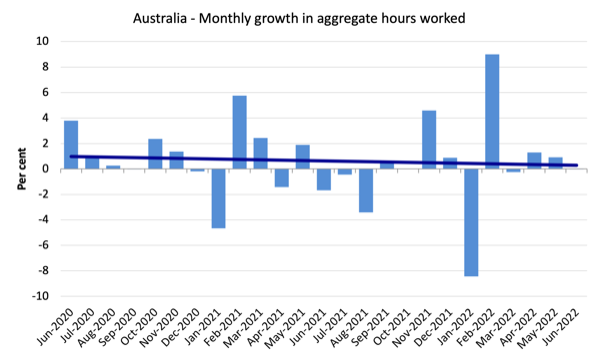
Hours worked was unchanged in June 2022
The following graph shows the monthly growth (in per cent) over the last 24 months.
The dark linear line is a simple regression trend of the monthly change (skewed by the couple of outlier result).
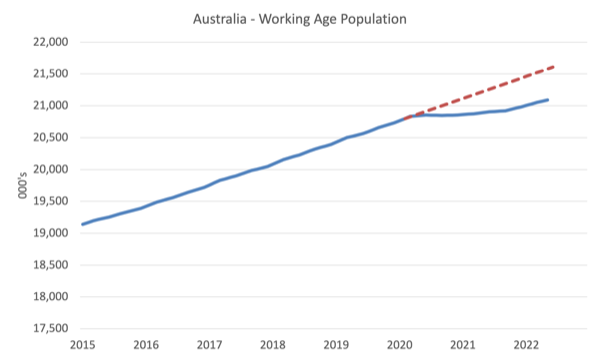
The Population Slowdown – the ‘What-if’ unemployment analysis
The following graph shows Australia’s working age population (Over 15 year olds) from January 2015 to June 2022. The dotted line is the projected growth had the pre-pandemic trend continued.
The difference between the lines is the decline in the working age population due to the Covid restrictions.
The civilian population is 310.6 thousand less in June 2022 than it would have been had pre-Covid trends continued.
The following graph shows the evolution of the actual unemployment rate since January 1980 to June 2022 and the dotted line is the ‘What-if’ rate, which is calculated by assuming the most recent peak participation rate (recorded at June 2022 = 66.8 per cent), the extrapolated working age population (based on growth rate between 2015 and April 2020) and the actual employment since April 2020.
It shows what the unemployment rate would have been given the actual employment growth had the working age population trajectory followed the past trends.
In this blog post – External border closures in Australia reduced the unemployment rate by around 2.7 points (April 28, 2022), I provided detailed analysis of how I calculated the ‘What-if’ unemployment rate.
So instead of an unemployment rate of 3.5 per cent, the rate would have been 5.7 per cent in June 2022, given the employment performance since the pandemic.
This finding puts a rather different slant to what has been happening since the onset of the pandemic.

Unemployment fell by 54,300 to 493,900 persons in June 2022
Unemployment fell his month despite the rise in participation because employment growth was strong enough to more than absorb the rise in the labour force.
The official unemployment rate was 3.5 per cent. Also bear in mind the ‘What-if’ analysis above and the fall in participation (see below).
The following graph shows the national unemployment rate from April 1980 to June 2022. The longer time-series helps frame some perspective to what is happening at present.
Broad labour underutilisation increased by 0.4 points to 6.1 per cent in June 2022
The results for June 2022 are (seasonally adjusted):
1. Underemployment increased by 0.4 points to 6.1 per cent (a rise of 49.7 thousand).
2. Overall there are 857 thousand underemployed workers.
3. The total labour underutilisation rate (unemployment plus underemployment) was unchanged at 9.6 per cent – the rise in underemployment being offset by the fall in official unemployment.
4. There were a total of 1350.9 thousand workers either unemployed or underemployed.
Given there was no change in monthly hours worked, yet employment growth was strong while underemployment also rose, it is clear that a lot of the new jobs being added were at the lower end of the hours distribution and jobs that were shed were at the higher end, given this net result.
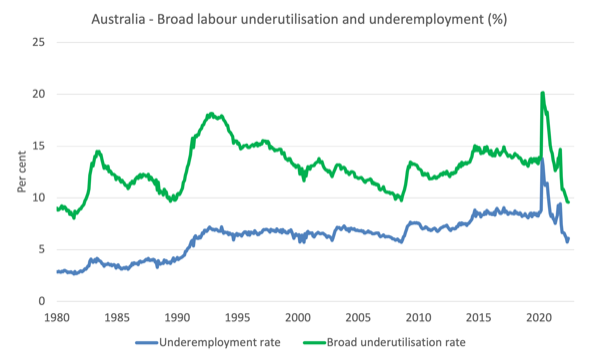
The following graph plots the seasonally-adjusted underemployment rate in Australia from April 1980 to the June 2022 (blue line) and the broad underutilisation rate over the same period (green line).
The difference between the two lines is the unemployment rate.
The three cyclical peaks correspond to the 1982, 1991 recessions and the more recent downturn.
The other difference between now and the two earlier cycles is that the recovery triggered by the fiscal stimulus in 2008-09 did not persist and as soon as the ‘fiscal surplus’ fetish kicked in in 2012, things went backwards very quickly.
The two earlier peaks were sharp but steadily declined. The last peak fell away on the back of the stimulus but turned again when the stimulus was withdrawn.
Teenage labour market much stronger in June 2022
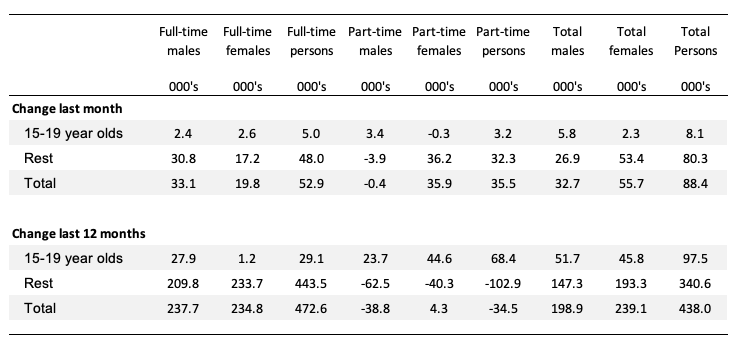
The following Table shows the distribution of net employment creation in the last month and the last 12 months by full-time/part-time status and age/gender category (15-19 year olds and the rest).
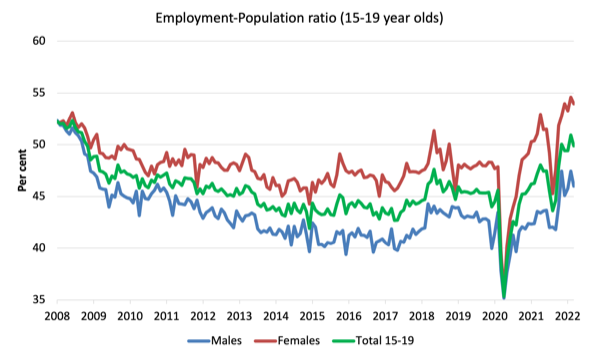
To put the teenage employment situation in a scale context (relative to their size in the population) the following graph shows the Employment-Population ratios for males, females and total 15-19 year olds since June 2008.
You can interpret this graph as depicting the loss of employment relative to the underlying population of each cohort.
1. The male ratio has fallen by 3.1 percentage points since April 2008. It rose 0.6 points over the month. It is now 5.7 points above its level in April 2020.
2. The female ratio is 4.3 percentage points above the April 2008 level. It rose 0.2 points over the month. It is now 8.6 points above its level in April 2020.
3. The overall teenage employment-population ratio has risen by 0.5 percentage points since April 2008. It rose by 0.4 points over the month. It is now 7.1 points above its level in April 2020.
4. So female teenagers are doing better in relative terms than male teenagers.
Conclusion
My standard monthly warning: we always have to be careful interpreting month to month movements given the way the Labour Force Survey is constructed and implemented.
My overall assessment is:
1. The labour market improved in June following up the gains in May after several months of weakness.
2. The robust full-time employment growth was a good sign as was the increasing participation rate. That particularly favoured the younger workers.
3. The official unemployment rate fell to levels not seen since 1974 but the underlying (‘What-if’) unemployment rate is closer to 5.7 per cent rather than the official rate of 3.5 per cent.
4. Underemployment rose sharply however and while unemployment fell by 54,300, those in part-time work who desired more hours rose by 49,700. In other words, the jobs growth was biased towards the lower end of the hours distribution.
4. There are still 1350.9 thousand Australian workers without work in one way or another (officially unemployed or underemployed). The only reason the unemployment rate is so low is because the underlying population growth remains low after the border closures over the last two years.
That is enough for today!
(c) Copyright 2022 William Mitchell. All Rights Reserved.
“Is clearly pushing the ratio [down] up”, I suggest, relative to the employment to population ratio.
I’m not sure what to make of the “what if” unemployment rate, Prof, because you are using actual employment growth rather than deducing what it would have been as a proportion of the workforce related trends. Why not also extrapolate employment relative to your WAP assumption? What are we to imply of the 5.7% rate? I’m finding this difficult to interpret. Could you please elaborate a little more. Many thanks.
This is being portrayed in the media as a roaring boom in demand for labour – and subsequently being portrayed as justification for further interest rate hikes.
Nothing of the sort is occurring. It would be more accurately described as “normalising demand for labour running headlong into a serious, chronic collapse in the available SUPPLY of labour”.
The media in general seems to have trouble with the concept of relativity. They can’t (or don’t want to) tell the difference between a situation where demand is strong even in the face of plentiful, unhindered supply (a “true” economic boom) and one where demand appears strong largely because the available supply has become tightly constrained.
Would it help you-all to be reminded that all mainstream economists are liars. That MS Econ. Theory is a pile of lies created by economists to help the rich get richer. In “Richard Werner. What’s wrong with mainstream economics.” By Why Don’t Economists…?, Prof. Werner asserts that MS Econ. Theory was created by deciding what they wanted to prove and then setting out the necessary assumptions to “appear” to have proved it. He says that when they teach it they start with the assumptions that they admit are false (but they assert that this is OK because they are simpler and close enough), while they forget to point out that in deductive logic even one false premise makes the proof invalid (or some other word for useless).
. . . He lists some of their assumptions as => everyone is very selfish and doesn’t care about the welfare of anyone else, nobody is ever influenced by anyone else (so advertising is useless), the market is perfect with millions of corps selling, in the market there is perfect knowledge where everyone knows everything about everything, there are no transaction costs, and capital (machines & things) that instantly converts to what is needed (mature grape vines convert to mature apple trees or steel mills convert to computer chip factories *whenever* the owner wants), etc. Remember this is his list.
. . . He also asserts there that MS Econ. Theory has factored banks and money out of the model.
Again, MS Econ. is a pile of lies. All MS economists must know this.
OTOH, journalists and politicians might not know this. They might just believe it because everyone else does.
.
“Would it help you-all to be reminded that all mainstream economists are liars.” I don’t think liars is the right word, but I get what you are saying. They give a version of events that simply doesn’t reflect reality for the broader community…only reflects their reality and ideological blinkering.
Esp wrote”
” “Would it help you-all to be reminded that all mainstream economists are liars.” I don’t think liars is the right word, but I get what you are saying. They give a version of events that simply doesn’t reflect reality for the broader community…only reflects their reality and ideological blinkering.”
I would to would edit that like this =>
… They give a version of events that simply doesn’t reflect reality for the broader community…only reflects their *fantasy version of* reality and *their* ideological blinkering.
Their fantasy world doesn’t reflect our real world reality in any way.
.