Today (January 22, 2026), the Australian Bureau of Statistics (ABS) released the latest labour force…
US labour market weakens a little – it is madness to be increasing interest rates in this environment
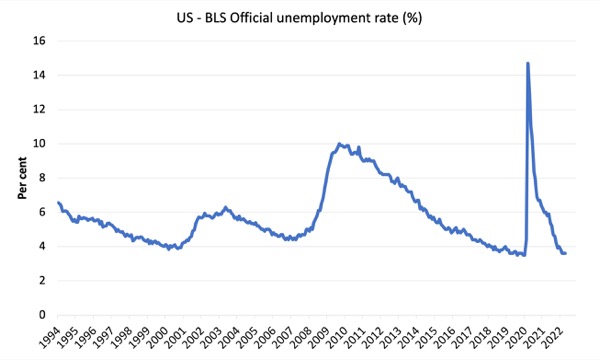
Last Friday (June 3, 2022), the US Bureau of Labor Statistics (BLS) released their latest labour market data – Employment Situation Summary – May 2022 – which reported a total payroll employment rise of only 390,000 jobs and an official unemployment rate of 3.6 per cent. The US labour market is still 822 thousand payroll jobs short from where it was at the end of May 2020, which helps to explain why there are no wage pressures emerging. Real wages continued to decline as the supply disruptions and the greed of increased corporate profit margin push sustain the inflationary pressures. Any analyst who is claiming the US economy is close to full employment hasn’t looked at the data. It is madness to be increasing interest rates in this environment.
Overview for May 2022:
- Payroll employment increased by 390,000.
- Total labour force survey employment rose by 321 thousand net (0.2 per cent).
- The seasonally adjusted labour force rose by 330 thousand net (0.2 per cent).
- The employment-population ratio rose 0.1 points to 60.1 per cent (it is still lower than the May 2020 peak of 61.2).
- Official unemployment rose by 9 thousand to 5,950 thousand.
- The official unemployment rate was unchanged at 3.6 per cent.
- The participation rate rose by 0.1 points to 62.3 per cent.
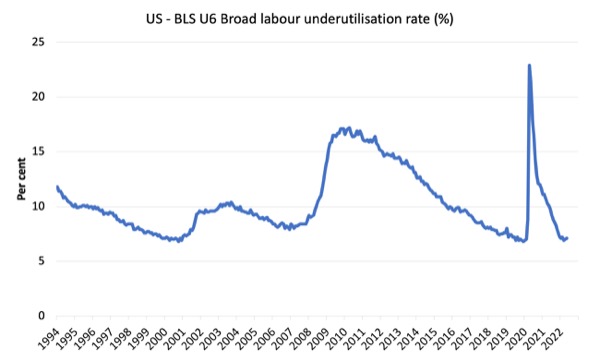
- The broad labour underutilisation measure (U6) rose 0.1 points to 7.1 per cent as underemployment increased.
For those who are confused about the difference between the payroll (establishment) data and the household survey data you should read this blog post – US labour market is in a deplorable state – where I explain the differences in detail.
Some months the difference is small, while other months, the difference is larger.
The differences were quite large this month.
Payroll employment trends
The BLS noted that:
Total nonfarm payroll employment rose by 390,000 in May. Notable job gains occurred in leisure and hospitality, in professional and business services, and in transportation and warehousing. Employment in retail trade declined over the month. Nonfarm employment is down by 822,000, or 0.5 percent, from its pre-pandemic level in February 2020 …
Employment in leisure and hospitality increased by 84,000 … is down by 1.3 million, or 7.9 percent, compared with February 2020.
Employment in professional and business services rose by 75,000 in May … is 821,000 higher than in February 2020.
In May, transportation and warehousing added 47,000 jobs … is 709,000 above its February 2020 level.
Employment in construction increased by 36,000 in May, following no change in April … is 40,000 higher than in February 2020.
In May, employment increased by 36,000 in state government education and by 33,000 in private education. Employment changed little in local government education (+14,000). Compared with February 2020, employment in state government education is up by 27,000, while employment in private education has essentially recovered. Employment in local government education is down by 308,000, or 3.8 percent, compared with February 2020.
Employment in health care rose by 28,000 in May … is 223,000, or 1.3 percent, lower than in February 2020.
Manufacturing employment continued to trend up in May (+18,000) … in manufacturing overall is slightly below (-17,000 or -0.1 percent) its February 2020 level.
Wholesale trade added 14,000 jobs in May … is down by 41,000, or 0.7 percent, compared with February
2020.Mining employment increased by 6,000 in May and is 80,000 higher than a recent low in February 2021.
Employment in retail trade declined by 61,000 in May but is 159,000 above its February 2020 level …
In May, employment showed little change in other major industries, including information, financial activities, and other services.
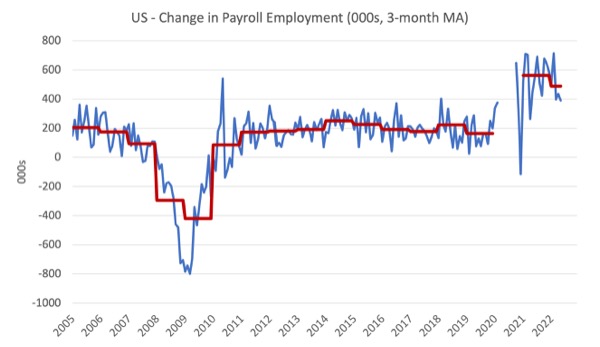
The first graph shows the monthly change in payroll employment (in thousands, expressed as a 3-month moving average to take out the monthly noise). The red lines are the annual averages. I left out the observations between January 2020 and September 2020, which were so extreme that they make it harder to compare the current period with the pre-pandemic history.
The US labour market is still 1,190 thousand jobs short from where it was at the end of May 2020 and the commentary from the BLS above tells us how this shortfall is distributed across the sectors.
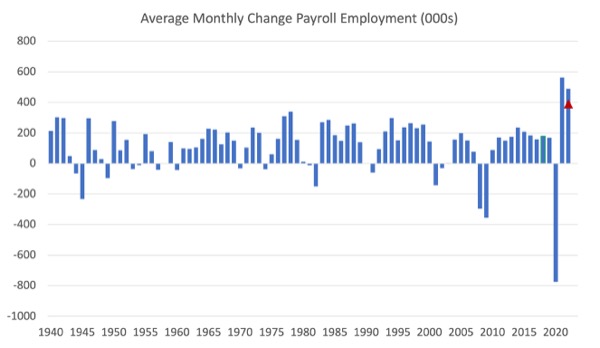
The next graph shows the same data in a different way – in this case the graph shows the average net monthly change in payroll employment (actual) for the calendar years from 2005 to 2021.
The red marker on the column is the current month’s result.
The final average for 2019 was 164 thousand.
The final average for 2020 was -774 thousand.
The final average for 2021 was 562 thousand.
The average so far in 2022 is 488 thousand.
Labour Force Survey – employment growth declines
The data for May 2022 reveals:
1. Total labour force survey employment rose by 321 thousand net (0.2 per cent).
2. The seasonally adjusted labour force rose by 330 thousand net (0.2 per cent).
3. The participation rate rose by 0.1 points to 62.3 per cent which is why the labour force gain was above the extra employment.
4. As a result (in accounting terms), total measured unemployment rose by 9 thousand to 5,950 thousand and the official unemployment rate was unchanged at 3.6 per cent.
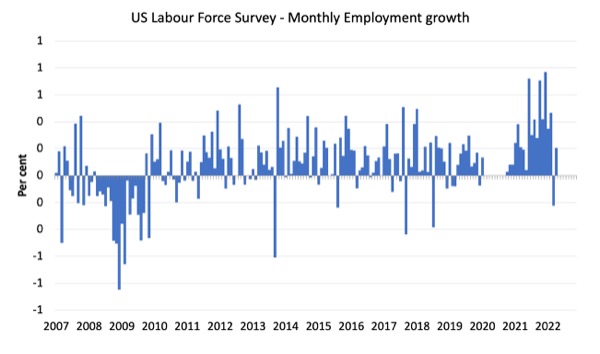
The following graph shows the monthly employment growth since January 2008 and excludes the extreme observations (outliers) between May 2020 and October 2020, which distort the current period relative to the pre-pandemic period.
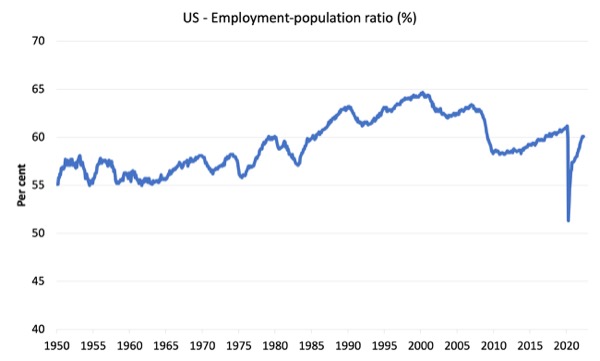
The Employment-Population ratio is a good measure of the strength of the labour market because the movements are relatively unambiguous because the denominator population is not particularly sensitive to the cycle (unlike the labour force).
The following graph shows the US Employment-Population from January 1950 to May 2022.
While the ratio fluctuates a little, the May 2020 ratio fell by 8.6 points to 51.3 per cent, which is the largest monthly fall since the sample began in January 1948.
In May 2022, the ratio rose by 0.1 points to 60.1 per cent.
The peak level in May 2020 before the pandemic was 61.1 per cent.
Unemployment and underutilisation trends
The BLS note that:
In May, the unemployment rate was 3.6 percent for the third month in a row, and the number of unemployed persons was essentially unchanged at 6.0 million. These measures are little different from their values in February 2020 (3.5 percent and 5.7 million, respectively), prior to the coronavirus (COVID-19) pandemic. …
… In May, the number of long-term unemployed (those jobless for 27 weeks or more) edged down to 1.4 million. This measure is 235,000 higher than in February 2020. The long-term unemployed accounted for 23.2 percent of all unemployed persons in May …
The number of persons employed part time for economic reasons increased by 295,000 to 4.3 million in May, reflecting an increase in the number of persons whose hours were cut due to slack work or business conditions. The number of persons employed part time for economic reasons is little different from its February 2020 level. These individuals, who would have preferred full-time employment, were working part time because their hours had been reduced or they were unable to find full-time jobs …
The first graph shows the official unemployment rate since January 1994.
The official unemployment rate is a narrow measure of labour wastage, which means that a strict comparison with the 1960s, for example, in terms of how tight the labour market, has to take into account broader measures of labour underutilisation.
The next graph shows the BLS measure U6, which is defined as:
Total unemployed, plus all marginally attached workers plus total employed part time for economic reasons, as a percent of all civilian labor force plus all marginally attached workers.
It is thus the broadest quantitative measure of labour underutilisation that the BLS publish.
Pre-COVID, U6 was at 6.8 per cent (December 2019).
In May 2022 the U6 measure was 7.1 per cent, a rise of 0.1 points on the previous month.
The rise was the result of the rise in workers forced to work part-time for economic reasons – which is the US indicator of underemployment.
Ethnicity and Education
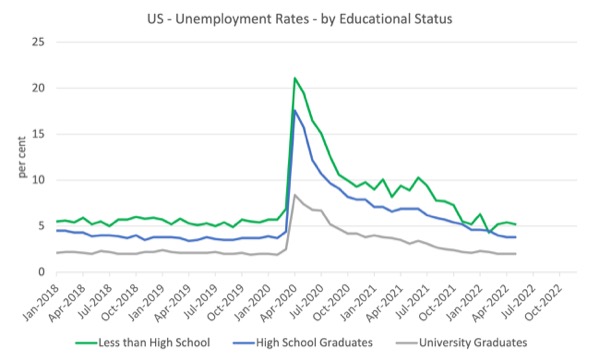
The next graph shows the evolution of unemployment rates for three cohorts based on educational attainment: (a) those with less than high school completion; (b) high school graduates; and (c) university graduates.
The unemployment rate for a person with a university degree is 2 per cent, while the other groups are much higher.
In the collapse in employment in the early months of the pandemic, the unemployment rates rose by:
- 14.2 points for those with less than high-school diploma.
- 13.2 points for high school, no college graduates.
- 5.9 points for those with university degrees.
The period since May 2020 has seen the unemployment rate fall by:
- 15.9 points for those with less than high-school diploma meaning the unemployment rate is now 1.7 points below the May 2020 level.
- 13.2 points for high school, no college graduates meaning the unemployment rate is now 0.4 points above the May 2020 level.
- 5.9 points for those with university degrees meaning the unemployment rate is now 0.5 points below the May 2020 level.
In the last month, the change in the unemployment rate has been:
- a fall of 0.2 points for those with less than high-school diploma.
- unchanged for high school, no college graduates.
- unchanged for those with university degrees.
In the US context, the trends in trends in unemployment by ethnicity are interesting.
Two questions arise:
1. How have the Black and African American and White unemployment rate fared in the post-GFC period?
2. How has the relationship between the Black and African American unemployment rate and the White unemployment rate changed since the GFC?
Summary:
1. All the series move together as economic activity cycles. The data also moves around a lot on a monthly basis.
2. The Black and African American unemployment rate was 6.8 per cent in May 2020, rose to 16.6 per cent in May 2020 and is at 6.2 per cent in May 2022. In the last month, it was rose by 0.3 points.
3. The Hispanic or Latino unemployment rate was 6 per cent in May 2020, rose to 18.9 per cent in May and is at 4.3 per cent in May 2022. In the last month, it rose by 0.2 points.
4. The White unemployment rate was 3.9 per cent in May 2020, rose to 14.1 per cent in May and fell to 3.2 per cent in May 2022 – unchanged over the month.
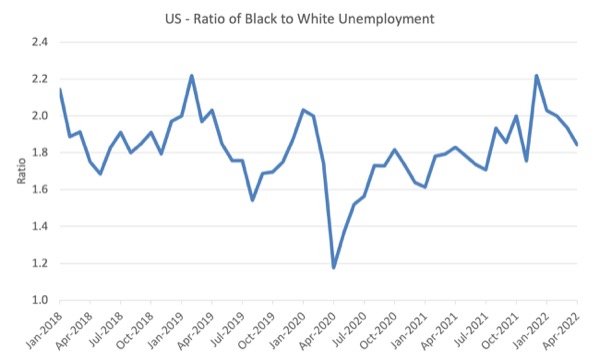
The next graph shows the Black and African American unemployment rate to White unemployment rate (ratio) from January 2018, when the White unemployment rate was at 3.5 per cent and the Black or African American rate was at 7.5 per cent.
This graph allows us to see whether the relative position of the two cohorts has changed since the crisis.
If it is rising, then the unemployment rate of the Black and African American cohort is either rising faster than the white unemployment rate or falling more slowly (or a combination of that relativity).
While there is month-to-month variability, the data shows that, in fact, through to mid-2019, the position of Black and African Americans had improved in relative terms (to Whites), although that just reflected the fact that the White unemployment was so low that employers were forced to take on other ‘less preferred’ workers if they wanted to maintain growth.
In May 2019, the ratio was 2.1 (meaning the Black and African American unemployment rate was more than 2 times the White rate).
By May 2020, the ratio had fallen to its lowest level of 1.2, reflecting the improved relative Black and African American position.
As the pandemic hit, the ratio rose and peaked at 1.8 in October 2020.
In May 2022, the ratio was 1.94, a decline of 0.1 points, which indicates that the relative position of the Black and African American cohort has deteriorated a little further.
Special analysis this month – What are wages doing in the US?
With inflation rising sharply at present and the Federal Reserve pretending there is a major wage problem that needs to be disciplined with rising mass unemployment, one would expect to see strong nominal wages growth pushing the price level along.
The BLS reported that:
Average hourly earnings for all employees on private nonfarm payrolls rose by 10 cents, or 0.3 percent, to $31.85 in May. Over the past 12 months, average hourly earnings have increased by 5.2 percent. In May, average hourly earnings of private sector production and nonsupervisory employees rose by 15 cents, or 0.6 percent, to $27.33.
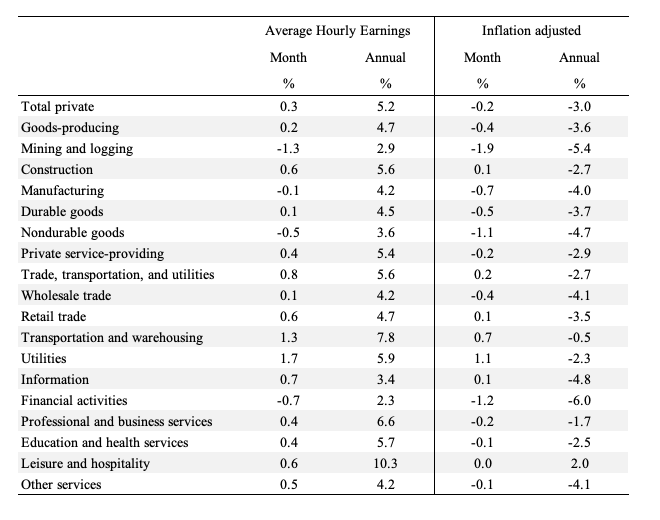
The following table shows the movements in nominal Average Hourly Earnings (AHE) by sector and the inflation-adjusted AHE by sector for May 2022 (note we are adjusting using the April CPI – the latest available).
Over the last month, real wages fell in all sectors bare leisure and hospitality.
If wages were pushing the inflation rate we would not be seeing persistent real wages cuts.
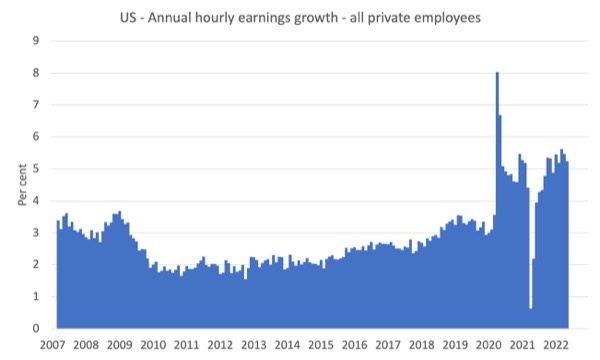
The following graph shows the annual hourly earnings growth for all private employees since May 2007.
In the last month, the growth rate declined and is well below the inflation rate. Wages growth is not driving the supply-side inflation acceleration.
There is no accelerating trend.
Note that the above graph is in nominal terms.
The latest – BLS Real Earnings Summary (published May 11, 2022) – tells us that:
Real average hourly earnings for all employees decreased 0.1 percent from March to April, seasonally adjusted … This result stems from an increase of 0.3 percent in average hourly earnings combined with an increase of 0.3 percent in the Consumer Price Index for All Urban Consumers (CPI-U).
Real average weekly earnings were essentially unchanged over the month due to the change in real average hourly earnings combined with no change in the average workweek.
Real average hourly earnings decreased 2.6 percent, seasonally adjusted, from April 2021 to April 2022. The change in real average hourly earnings combined with a decrease of 0.9 percent in the average workweek resulted in a 3.4-percent decrease in real average weekly earnings over this period.
Workers are not catching up with the price level rises and can hardly be said to be pressuring inflation.
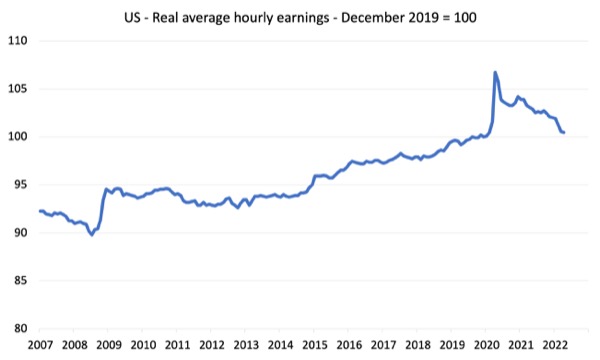
The following graph shows movements in real average hourly earnings (indexed at 100 at December 2019) up to May 2022 tells the story.
The spike in the early period of the pandemic was the result of hours adjustments rather than earnings growth.
And, from the latest – Productivity and Costs, First Quarter 2022, Revised (published June 2, 2022) – report, we find that:
Nonfarm business sector labor productivity decreased 7.5 percent in the first quarter of 2022 … as output decreased 2.3 percent and hours worked increased 5.4 percent. This is the largest decline in quarterly productivity since the third quarter of 1947, when the measure decreased 11.7 percent … From the same quarter a year ago, nonfarm business sector labor productivity decreased 0.6 percent, reflecting a 4.2-percent increase in output that was outpaced by a 4.8-percent increase in hours worked. This is the largest four-quarter decline since the fourth quarter of 1993, when the measure also declined 0.6 percent.
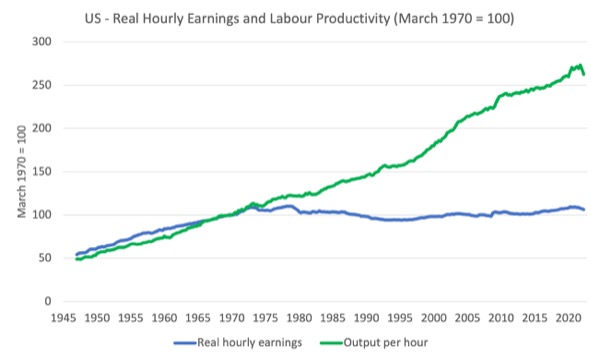
Even though productivity growth slumped in the first quarter of 2022, real hourly earnings growth continues to lag behind productivity growth over a longer period.
The following graph tells the story.
It shows real hourly earnings and labour productivity (output per hour) indexed at 100 in the May-quarter 1970 (around the time the two series started to diverge).
Workers have enjoyed hardly any real wages growth since 1970 (rising by just 6.3 per cent) whereas productivity growth has risen by 162 per cent.
There has been a massive redistribution of national income away from workers towards profits over this long period.
This depicts the failure of Capitalism to serve the best interests of the people.
Conclusion
The US labour market slowed a little in May 2022.
The US labour market is still 822 thousand jobs short from where it was at the end of May 2020.
The employment-population ratio is still down on the May 2020 peak.
There are no fundamental wage pressures emerging at present despite the spikes in inflation arising from supply chain constraints.
Real wages are falling.
The US labour market is still some way from being at full employment.
That is enough for today!
(c) Copyright 2022 William Mitchell. All Rights Reserved.
The central banks monthly monetary policy decision is due out tomorrow in Australia – lets see whether they are prepared to admit that they made a massive mistake last month……….or whether they commit to a pointless course of economic and social destruction.
Sadly, I’m leaning toward the latter.
If they raise the cash rate tomorrow – I’ll be very interested to hear their reasoning, given that it has been demonstrated that the main justification they gave for their decision last month transpired to have no basis in reality.
Raising interest rates will usher the western world into another recession.
With it, many small business will be closed in a few months time.
Other, not so small businesses will be on the market for sale, and the big sharks will be out there hunting healthy companies, for a fraction of its worth – just as they did before.
These large multinationals will grow even larger, taking monopolies to the next level.
But, it will be another test to the strenght of the eastern bloc (China, Russia, India and Iran).
The first test was to the military strength of the Russian empire.
Just imagine the strength of China, if Russia fights like they are fighting in Ukraine, with all the sanctions that were imposed upon them, with all the guns sold on credit to Ukraine, with all the propaganda fed through the media.
It didn’t go well for the west (too bad for the poor Ukrainians who were used as human shields).
If China invades Taiwan, Biden promises to go to the rescue of the Taiwanese regime, but how can the US fight back? I mean, they can’t even prevent mass shootings at home, at churchs and elementary schools. How can they prevent a massive army from crashing a relatively small territory, thousands of miles away from home?
But for now, the eastern bloc will face another test: the recession test.
The west will go into another GFC, this time on purpose, to take China/India/Russia to their knees.
But, they are expecting it, so maybe, in the end, it will be the west on its knees.
The plan goes by basic calculations: if the west doesn’t import, China will go broke. But, the eastern bloc has a massive internal market, and maybe it will be sufficient to keep the motors running, while the west commits suicide.
“It is madness to be increasing interest rates in this environment.” This supposes those increasing the interest rates have as their goal the well being of the general public, the common good, which appears doubtful given the circumstances so many are reporting now.
It’s troubling to think that they are not equipped with sufficient faculties to understand the causes of the inflation being experienced or to predict the likely impacts of their actions on those struggling to recover from the pandemic.
If they haven’t truly just lost their capacity for rational decision making, what seems left is that the political neutrality of central banks needs to be questioned. Who do they really represent and what are they up to? Who gains when business costs rise 30% and they choose to risk insolvency by selling their product at a loss because they know the market can’t bear further price increases?
Workers are on the verge gaining the slightest bit of leverage in the US, or so goes the common wisdom, so something, anything must be done to prevent that eventuality. The *market* demands it!
I’m a bit confused over the ‘propensity to save’ factor. How does one calculate that propensity? Favorable GDP growth has occurred in the U.S. before with higher interest rates. Anyway, the recent collapse from a pandemic infused recession seems to have multiple causes, multiple weaknesses in western economies. Macro is complicated, certainly.
I’m a bit confused over the ‘propensity to save’ factor. How does one calculate that propensity?
Demand leakages are unspent income. For a given currency, if any agent doesn’t spend his income, some other agent has to spend more than his income, or that much output doesn’t get sold. So if the non government sectors collectively don’t spend all of their income, it’s up to government to make sure its tax take is less than its spending, or that much output doesn’t get sold. This translates into what’s commonly called the ‘output gap,’ which is largely a sanitised way of saying unemployment.
And with the private sector necessarily pro cyclical, the private sector spending gap in this economy can only be filled with by government via either a tax cut and/or spending increase (depending on one’s politics).
So wherefore the ‘demand leakages?’ The lion’s share are due to tax advantages for not spending your income, including pension contributions, and all kinds of corporate reserves. Then there’s foreign hoards accumulated to support foreign exporters.
That should be a very good thing — all of that net unspent income means that for a given size government, and a given non government rate of credit expansion, our taxes can be that much lower. Just like the pandemic showed we could all probably retire a bit earlier, just by getting rid of a few non essentials. Millions were on furlough but we were still able to provide what people needed.
But then there’s the fear mongering about government unfunded liabilities, without even a hint of the present value of all demand leakages — all of that future income just discussed that will be unspent as it’s squirreled away in the likes of retirement plans, corporate reserves and foreign central banks.
If history is any guide, the demand leakages will probably continue to outstrip even the so called ‘runaway spending of our irresponsible government,’ just as they’ve always done in the past, as evidenced by nearly continuous output gaps/excess unemployment.
Every mainstream economist has learned that it’s the demand leakages that create the ‘need’ for government deficits, but somehow they fail to even mention it, even casually. If anything, they voice no objections to the popular misconception that we need more savings to have funds for investment, thereby tacitly supporting the call for higher levels of demand leaks, and consequently calling for the need for even higher levels of government deficit spending, which they also deem a ‘bad thing.’
I think it is all too easy to sit on the sidelines and throw mud at central banks.
I would not want to be a central banker.
Because the so-called science of economics is so imperfect, they perhaps have to err on the side of caution.
Inflation can be a terrible scourge and I do wonder when MMters profess their concerns about it given the comments in this blog.
Inflation hurts people on fixed incomes. It hurts savers and lenders. Many here would say who cares?
It also hurts the unemployed and could be responsible ultimately for more unemployment. If inflation is allowed to run away, more difficult measures will be required causing greater dislocation.
So managing inflation policy is fraught.
And only Paulo could manage to marry the consideration of the global geostrategic position to the local central bank’s decision making. 🙂
“Inflation hurts people on fixed incomes”
Nobody relevant is on a fixed income. They are known as ‘rich people’. Pensioners and the like are protected from inflation by an index linked state pension – or should be.
Inflation rots debts. It is of benefit to anybody with wage pricing power who has a mortgage.
“It also hurts the unemployed and could be responsible ultimately for more unemployment.”
How else do you think inflation is halted? Have you not read Bill’s stuff? It’s all there in MMT’s analysis of inflation.
This is why MMT people recommend a Job Guarantee. A Job Guarantee employed buffer requires fewer people to be transferred to it to halt inflation than the unemployed buffer stock we currently use. It has a steeper stabilising effect because the wage is higher. They also remain employed, ready for when the good times return.
There has been a shift in the terms of trade. Scarce resources have to be reallocated and the loss absorbed by someone. That comes out as lack of pricing power and unemployment. Those who suffer those conditions are the ones who stand the loss. Some businesses will go bust, some bank loans will go bad, some wages won’t rise, but mostly that will cause a further reallocation ripple until some people end up on the unemployment queue.
Jiggling interest rates doesn’t stop this process. In fact it is likely to make it go on longer, because the real intention of interest rate rises is to try to exempt those ‘savers and lenders’ from the inflation reallocation process – just as unions try to exempt their members by striking for better pay.
“Pensioners and the like are protected from inflation by an index linked state pension – or should be. ”
Not where I’m from. And indexation is not a panacea. Indexation can add to the problem if widespread.
“Inflation rots debts. It is of benefit to anybody with wage pricing power who has a mortgage.”
Yes that’s fair enough – but it’s not a sound reason for allowing inflation to romp. Better to have a fair wages system in place.
“A Job Guarantee employed buffer requires fewer people to be transferred to it to halt inflation than the unemployed buffer stock we currently use. ”
The inflation fighting powers of the JGS have not been demonstrated, so I don’t accept the point. I think Bill has even watered some of the claims down. (I can find quotes if you like.)
“…until some people end up on the unemployment queue.”
Exactly.
“In fact it is likely to make it go on longer….”
I think you will have to provide some evidence for this one.
“….because the real intention of interest rate rises is to try to exempt those ‘savers and lenders’ from the inflation reallocation process”
As much as you don’t like it, the capitalist system relies on this.
Dear Henry Rech (at 2022/06/09 at 8:19 am)
You wrote with reference to the Job Guarantee that:
You think wrong.
There was no ‘watering down’ only clarification in a world where people put their own spin on my work that was never intended or actual.
I have always indicated the the Job Guarantee was no panacea and just part of the story.
So if you think there has been some ‘watering down’, then that tells me you have read the original work I provided or if you have you have fully understood its intent.
best wishes
bill
Bill,
“There was no ‘watering down’ only clarification in a world where people put their own spin on my work that was never intended or actual.”
You are not responsible for what readers of your blog write but some do put a simplified interpretation on what you write. Reading some commenters posts you would think MMT says that Governments can spend without restriction. Too many people who call themselves MMTers should do their homework a little more assiduously. Same with the JGS. To many, MMT is seen as a simple panacea.
You made it quite clear of your post “Exploring the essence of MMT – the Job Guarantee – Part 2” dated the Thursday, April 7, 2022, what the limits of the JGS are. For me, that post was a welcome clarification.
It certainly is at variance with what some of your readers write in this blog.
“…then that tells me you have read the original work I provided or if you have you have fully understood its intent.”
I am not exactly sure what you are referring to as your “original work” so I cannot say. I have been reading your blog since 2016. From what I can recall of your writings on the JGS, you have previously not been as fulsome as you were in the above referenced blog. That is partly why it seemed to me to be a watering down.
Interest rates are increasing because inflation is increasing. Central banks having interest rates at emergency lows for the last decade is what has led to housing bubbles in Australia, Canada and the UK. Unemployment rates are at 48-year lows in Australia. It’s time for rates to rise!