I have been 'at it' for decades now but it never ceases to amaze me…
The current inflation still looks to be a transitory phenomenon
Inflation data continues to come in from various nations indicating an ongoing escalation in prices dominated by energy and cars (in the US), housing and transport (UK), housing and transport (Australia) and so on. The major question I always ask is this: What would you expect to happen after a major global pandemic that has lasted more than 2 years and is still not resolved and which has closed factories, ports, transport networks, made workers sick so they cannot work, choked shipping, kept people at home while governments have to varying extents maintained their income, shifted spending to home maintenance etc away from haircuts, and the rest of it. And then, add an uncompetitive cartel that manipulates supply to gouge profits (OPEC). And on top of all that have some bushfires and floods around the place. And to even top all of that have a character who thinks he is a Tsar invading a neighbour and creating havoc and destruction. What else would you expect? Oh, its all down to QE and fiscal deficits, I hear them say. Modern Monetary Theory (MMT) again – now we know those ideas are defunct. We told you so! And repeat. Interest rates have to rise. Repeat. At least the ECB seems to understand the situation more than most, which is something.
In Issue 2 of the 2022 Volume of the – ECB Economic Bulletin – there is an interesting information ‘box’ – Supply chain bottlenecks in the euro area and the United States: where do we stand?
The Introduction to the Bulletin notes that:
1. “The Russian invasion of Ukraine will have a material impact on economic activity and inflation through higher energy and commodity prices, the disruption of international commerce and weaker confidence” – Yes.
2. “Inflation has continued to surprise on the upside because of unexpectedly high energy costs” – Yes.
3. “Longer‑term inflation expectations across a range of measures have re-anchored at the ECB’s inflation target” – Yes. Read again!
4. “The Governing Council sees it as increasingly likely that inflation will stabilise at its 2% target over the medium term” – Yes. Read again! That means transitory!
It also means that QE and fiscal policy is not driving this episode.
It also means that rising interest rates will do nothing to bring the inflation rate down and may actually exacerbate it by adding to unit costs.
5. “Supply bottlenecks are expected to start easing during 2022 and to fully unwind by 2023” – Maybe. Transitory drivers! (Hopefully if we get through the virus).
6. “The impact of the massive energy price shock on people and businesses may be partly cushioned by drawing on savings accumulated during the pandemic and by compensatory fiscal measures” – Yes. Note the need for compensatory fiscal measures, which do not mean extra stimulus, but real income protection to avoid a recession compounding the real income losses from the temporary inflation.
7. “Energy inflation, which reached 31.7% in February, continues to be the main reason for the high overall rate of inflation and is pushing up prices across many other sectors. Food prices have also increased, owing to seasonal factors, elevated transportation costs and higher fertiliser prices. Energy costs have risen further in recent weeks and there will be more pressure on some food and commodity prices owing to the war in Ukraine” – Yes.
All interrelated and not much to do with demand-side pressures.
There is some uncertainty as to the duration of this inflationary episode – “given the role of temporary pandemic-related factors and the indirect effects of higher energy prices.”
8. “Various measures of longer-term inflation expectations derived from financial markets and from surveys stand at around 2%” – Yes.
So no-one is really thinking that the inflation is anything but a transitory, ephemeral episode driven by various extraordinary factors that will eventually abate.
How long before abatement?
Uncertain.
Doesn’t that stretch the meaning of transitory?
Not at all.
Transitory doesn’t mean short-term necessarily. It means as long as the extraordinary events are driving the show.
When the supply chain adjusts to the disruption – remodels itself, ships start going where they are required and shipping companies stop gouging, and workers stop getting sick, and all the rest of it, then we will see.
Meanwhile Russia has to head East out of Ukraine and OPEC has to be pressured to stop its folly.
The ECB information box – Supply chain bottlenecks in the euro area and the United States: where do we stand? – is really an interesting and clever piece of research work.
They produced this heatmap graphic:
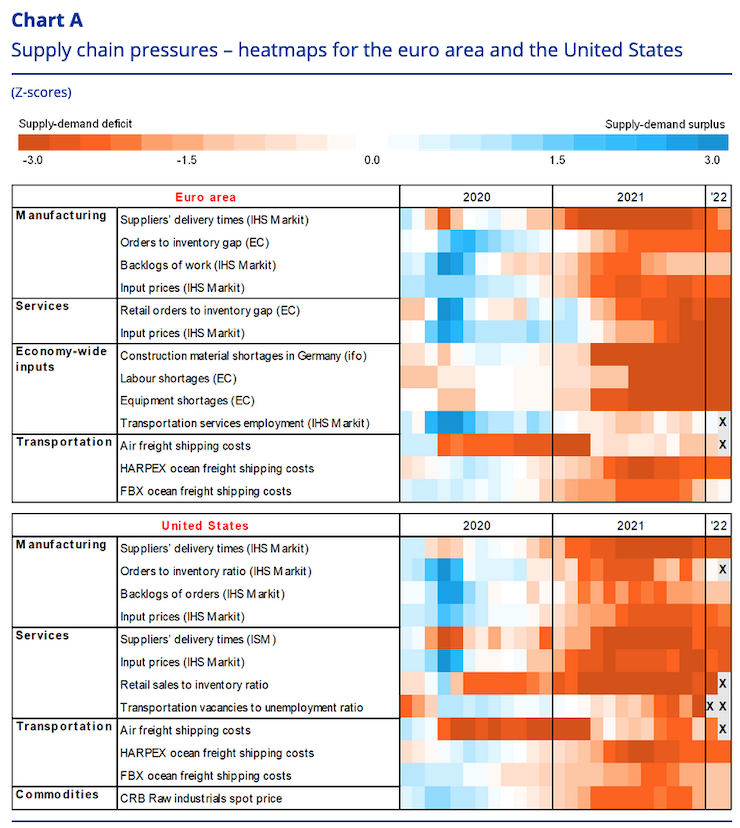
The heatmap uses data from a multitude of sources (US Bureau of Labor Statistics, European Commission, ISM, IHS Markit, Bloomberg) and is based on calculations of Z-scores, which are statistical results derived by subtracting the mean from the observation at time t and standardising by dividing by the standard deviation of the data series.
The ECB calculate the summary statistics – averages (means) and variation (standard deviation) – from January 1999 to the present and the Z-scores are based on annual growth rates.
So the darker the orange the greater the supply shortages (relative to demand) and the darker the blue indicates an abundance of supply relative to demand.
The experience for the Euro area and the US is broadly similar.
The heatmap shows that during 2020, the first year of the pandemic, demand fell away relative to available supply.
But “over the course of 2021” all the indicators moved to orange of various intensity and that state persisted up to February 2022 (so far that is).
The survey evidence the ECB elicited shows that “supply issues have generally not eased over recent months and are expected to continue throughout 2022.”
You can learn more about this survey evidence from this article – Main findings from the ECB’s recent contacts with non-financial companies – which appeared in the January issue of the ECB Economic Bulletin (1/2022)
The main, ongoing supply disruptions are in “transportation and logistics” – shipping, trucking, ports, etc.
The ECB analysis suggests that the January/February 2022 data is indicating that these major drivers of the heatmap patterns:
… have peaked and started to ease in both economies
Firms are starting “to rebuild inventories and the bottlenecks may be easing.”
But the spread of the new Omicron variant is creating further uncertainty with the “potential closure of factories and ports” and:
… there might be setbacks to supply chains if China continues to adhere to a strict zero-COVID strategy.
And, of course, don’t mention the war in Ukraine.
The ECB also noted that:
Supply chain bottlenecks stem from the interplay of several factors. First, the strong rebound in global demand for manufacturing goods, in part induced by the rotation of consumption away from services in the context of the pandemic-related containment measures, was not matched by an equal increase in the supply of goods. Second, some sectors have been hit by severe supply shortages, particularly of semiconductors, with supply struggling to accommodate the surge in demand for electronic products and equipment, and in the automotive sector …
So the pandemic caused sectoral imbalances to emerge which resulted from the reswitching of expenditure from services to goods, with major disruptions on the goods sector to respond, while the services sector was in a state of major excess supply capacity.
Abnormal and temporary.
I considered that reswitching of expenditure in this blog post – Central banks are resisting the inflation panic hype from the financial markets – and we are better off as a result (December 13, 2021).
With the December-quarter data for the US now available, I can update the graphs I produced. Last time, I used nominal aggregates to show the monetary pressures.
This time, given inflation is relatively high, I am concentrating on the real side of the economy which provides a better measure of the underlying pressures in output and real demand.
The first graph shows the path of real GDP from the March-quarter 2010 to the December-quarter 2021.
The red line is the average quarterly growth rate up to the December-quarter 2019 (the peak before the pandemic) extrapolated out to the most recent quarter. It tells us what would have happened if the US economy had have continued growing on that average growth rate trajectory.
You can see that the economy has still not reached the level that it would have if the pandemic had not disrupted pre-pandemic spending and production patterns.
As at the end of 2021, the trend index was 104.6 points, while actual GDP was 103.3 points.

The next two graphs tell what was going on in the goods- and service-producing sectors to deliver this aggregate result.
The pandemic did three things in this context.
First, the government stimulus payments, though imperfect, helped maintain incomes and spending capacity among households.
Second, the lockdowns prevented consumers spending on services by and large – hospitality, entertainment, travel etc.
And with income still intact, the spending shifted to goods-production – renovations, gadgets, flat-screen TVs, you name it.
Households brought forward spending plans on some things while normal spending patterns were short-circuited by the inability to spend on other things.
Third, the lockdowns and health concerns also reduced the capacity of the goods-producing sector to meet the new demand. This is what we are referring to when we talk about supply-side bottlenecks.
If workers are locked down, getting sick, and ports and freight terminals are disrupted, the normal smooth supply chain is interrupted and so there are inventory shortfalls, delivery delays and the like.
Then overlay market power – which allows producers, wholesalers and retailers to profit gouge the shortages via mark-up increases and you see the problem.
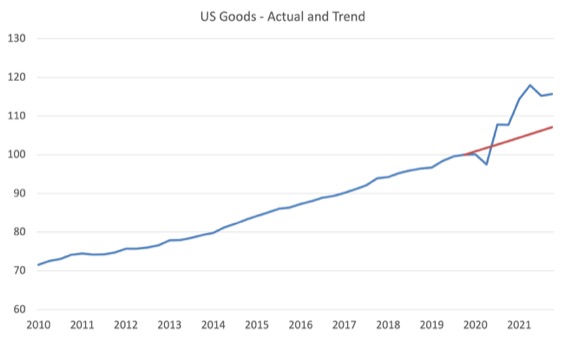
The following graph shows the expenditure on goods in the US – actual and trend (calculated in the same way as before). You can see what happened.
The expenditure on goods has shot up – well above the previous trend, upon which decisions about productive capacity and investment were being made.
The supply-side in the productive goods sector simply cannot adjust that quickly to such rapid (and artificial) shifts in demand and so the conditions for price rises are in place, given the market power held by price setters.
The next graph shows why the total GDP (the first graph shown) has only just recovered to its pre-pandemic level, while expenditure on goods increased so much.
It shows expenditure on services in the US is recovering but still well below where it would have been had the pandemic not hit and the average growth path prior to the pandemic continued smoothly.
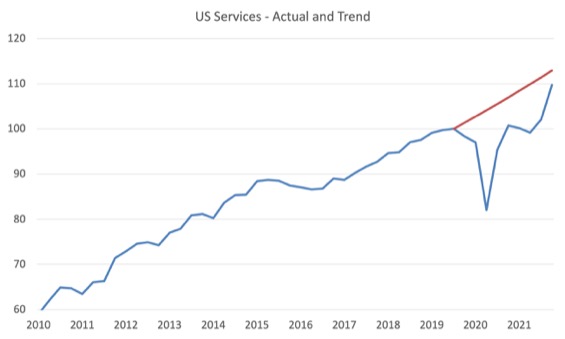
So the pandemic has created a combination of supply constraints and rapidly shifting demand patterns.
All of which are likely to be temporary in nature.
You can already see the demand for goods abating and the rise in services expenditure.
This is especially relevant now that personal consumption expenditure in the US is in decline.
I analysed that issue in this blog post – The last thing policy makers should be thinking about right now is creating a recession (February 14, 2022).
Conclusion
The LA Times article (January 13, 2021) – Inflation: What’s driving it, who benefits and when will it end? – captured the problem well.
It reported that:
The pandemic has caused enduring problems with the shipping, unloading and delivery of goods around the country, notably at the crucial ports of Los Angeles and Long Beach …
production pullbacks continue to reverberate. A shortage of semiconductors has limited car production, which in turn has raised used car and rental car prices sharply. The pandemic also saw a wave of bankruptcies among U.S. oil producers as the economy briefly came to a standstill. Now, oil demand has recovered, but supply has not …
If not for the Delta wave, maybe factories would have been running at full steam in China and Vietnam and Taiwan, and we would get the parts and semiconductors that we need to produce cars and washing machines and wearable goods in the U.S. …
Some also question the need for the Federal Reserve to take action at all, if it’s all being caused by the pandemic. If the supply chain issues were resolved, wouldn’t inflation also take care of itself? …
If the pandemic is transitory, inflation should also be transitory …
I think that analysis is on the mark.
It doesn’t mean the inflation is unproblematic.
It doesn’t mean governments should not try to use the policy levers they have to attenuate the price rises. I will write more about that soon.
It just means that it is the result of an extraordinary conjunction of events that are unlikely to persist.
That is enough for today!
(c) Copyright 2022 William Mitchell. All Rights Reserved.
Hi all,
Above Bill says the “ECB seems to understand the situation more than most, which is something.” Just wondering, given on their site they say they are ending stimulus is that wise when prices for most are still rising and stimulus for the poor is still important, maybe they are just redirecting the stimulus? Also, they mention on their site (and I’ve always heard the RBA and big banks say) that in order to combat inflation interest rates should rise, I was watching Mark Norman say that rising the cost of borrowing (which gets passed on to consumers), by raising interest rates causes inflation and vice versa. Who is right?
“maybe they are just redirecting the stimulus?”
Or they weren’t providing any actual stimulus in the first place, just performing a religious ritual that they really, really believed in.
Therefore it doesn’t actually matter if they do it or not.
“order to combat inflation interest rates should rise”
You know how interest rates are supposed to work. They raise the cost of mortgages and rents, which means ordinary people have less money to spend.
In other words the banks are taxing people.
The belief is that when the banks take money from ordinary people and give it to those nice rich people as savings interest they won’t spend it on fripperies – like paying the gas bill.
Whereas increased taxes also mean ordinary people have less money to spend, but that is a heinous crime because it also means rich people get taxed as well and also end up with less money.
The belief is that rich people should hold the money rather than government because government can’t be trusted not to spend it, whereas rich people almost never buy super yachts.
“All of which are likely to be temporary in nature.”
It all is, and can’t be anything else while wage rises lag price rises.
However the population are reacting emotionally, not logically.
What the neoliberals worked out is that people hate price rises of any sort at any time. That is guaranteed to upset over 50% of the population, whereas high unemployment will only concern a very small percentage of the population – say less than 20% at the outside, more likely 10%.
Therefore neoliberals target any hint of semi-inflation. The slightest price rise requires heavy demand destruction – and when they do that they will have the backing of the people to do it.
That is also suppresses wage rises over the long term and leaves 5% of people out of work is of no concern to the majority who are only thinking about this month’s pay check and what they have to buy with it.
It’s the rejection of semi-inflation that is the rejection of Keynesianism. Atomised individuals without unions don’t feel that they will be able to get the wage rises to compensate for the price rises, therefore they gather around any political class that says they will stop the price rises.
Even charlatans waving interest raising wands.
The trouble with QE is it doesn’t trickle down. It trickles up.
We are seeing entire cities in europe beeing bought by foreigners, because of the extra cash provided free by QE.
Those houses are then kept shut and the price of housing goes skyrocket.
This buying frenzy triggered a boom in the construction industry, but, as usual, it’s a bubble and, when it bursts, it will leave a crisis behind.
Nothing solid will come out of it, except thousands of empty houses.
Without people, cities die.
I truly am a MMTer, but I reject the “trickle down” falacy. It doesn’t work.
QE proves that MMT works, you might say.
But, just like science, it can be used for the wrong purpose.
“flat-screen TVs”
You’re dating yourself…
😉
Good article!
All inflation in the end is transitory. It eventually eases as market forces impact price. I can never understand the handwringing around this.
Dear Eric Pone (at 2022/03/29 at 4:01 am)
Thanks for your comment.
However, it misses the point.
The ‘handwringing’ is about mechanisms. I use the term transitory – and I have written a lot to make it clear – to refer to the absence of any propagation mechanisms that would amplify and allow the primary shocks to persist.
And further, to understand the nature of those primary shocks – whether they are demand or supply driven.
Yes, all inflations dissipate eventually.
That gets us nowhere in understanding them or designing policies to respond to them.
The absence of the propagation mechanisms – be they wage-price spiral interaction (the ‘battle of the mark-ups’) and entrenched self-fulfilling long term expectations – is what makes this episode transitory in the way we are using that word.
best wishes
bill
Hi all,
Thanks Neil for the reply. So is the RBA and ECB right or is Mike (not Mark sorry) Norman right about interest rates? Do they cause inflation when they go up or do they help control inflation when they go up, and vice versa?
“Transitory doesn’t mean short-term necessarily. It means as long as the extraordinary events are driving the show.” One wonders, now at least three into into it, whether “extraordinary events” are the “new normal” thus redefining the generally accepted meaning of the word “transitory”. Not that this denies the essence of this post (“not demand driven”).
“Do they cause inflation when they go up or do they help control inflation when they go up, and vice versa?”
If you give banks more free money from the state – which is what increasing interest rates does – which then goes straight to the bottom line to be given to employees and shareholders is that likely to cause more inflation or stop it?
“Not that this denies the essence of this post (“not demand driven”).”
I’m not sure the either/or categorisation helps.
In any inflationary episode the supply side is asking for more money and the demand side has the money to confirm those high prices.
It only stops when the either the demand side stops confirming the higher prices by refusing the pay them (either due to lack of money, or lack of perceived value), or the supply side stops asking for them (either because a competitor is offering better value or because nobody turned up at the higher price).
‘a character who thinks he is a Tsar’
That is geopolitics and that situation has a lot of context associated with it which should not be addressed in one small sentence!
. . . “8. “Various measures of longer-term inflation expectations derived from financial markets and from surveys stand at around 2%” – Yes.
So no-one is really thinking that the inflation is anything but a transitory, ephemeral episode driven by various extraordinary factors that will eventually abate.”
AFAIK, this means that when people are just talking they can say anything, but when they are making bets with their money they don’t bet based on things that they don’t really believe.
. . . Therefore, we can believe them in these cases, but not when they write an opinion piece in media.
.
@Joan
. “Tuesday, March 29, 2022 at 10:44
Hi all,
Thanks Neil for the reply. So is the RBA and ECB right or is Mike (not Mark sorry) Norman right about interest rates? Do they cause inflation when they go up or do they help control inflation when they go up, and vice versa?”
IMO, AFAIK, the lesson of the 70s and 80s was that small rate hikes just increase inflation when it is cost driven. When it is cost driven only rate increases that push the economy into a deep recession will kill inflation.
This “inflation” is pushed by shortages. I keep pointing out (but nobody seems to understand) that one function of the “market” is to ‘efficiently’ distribute the available supply to those with more money. This is claimed to be a feature, not a bug. So, when inflation is caused by shortages, raising rates will increase costs for businesses that will be added to their prices. So, rate increases do nothing to reduce prices, until enough people run out of money to buy stuff. Or, the people riot and loot stores because they are starving and can’t feed their kids.
Note => there is a large drought in much of the US grain growing areas. This has and will cause food prices to increase. It is caused by climate change.
. . . BTW – this was also seen in the 70s, but to a much less extent.
. . . YMMV.
“‘a character who thinks he is a Tsar’
That is geopolitics and that situation has a lot of context associated with it which should not be addressed in one small sentence!”
Absolutely.
This is a complex situation and despite the narrative presented by the western media and the fact that Putin is definitely a thug – the actions of the US-NATO leadership especially since 2008 are inexcusable and are the primary cause of this war.
It is politically impossible for said leadership to admit to what they have done so instead they double-down. After attempting to integrate into the west since the end of the Soviet Union and after all the broken promises, Russia no longer trusts the west and is beginning to detach. There is a major geopolitical shift underway and this will have global economic implications.