In the 1990s, a new industry was created in Australia. It produced nothing. But it…
Australia’s Covid recession has increased inequality – winners and losers
Today is just a number-crunching exercise, which I conducted to allow me to understand where the employment losses and gains in the Australian labour market since the onset of the pandemic. The latest Australian Bureau of Statistics Labour Force data, which I analysed in this blog post – Australian labour market – stronger as working age population flattens out (June 17, 2021) – revealed that total employment in Australia is now above the February 2020 level by 130.2 thousand (1.0 per cent). I noted that some sectors are still languishing while others are rebounding strongly. I had to wait a week before the detailed industrial level employment data was released and today’s blog post is a brief view of that data to ascertain which sectors (and sub-sectors) are in the ‘languishing’ category and which have rebounded. This is also important for assessing any impending inflation risk from the employment growth. There is always a motivation for doing this boring type of number analysis.
Total employment impacts
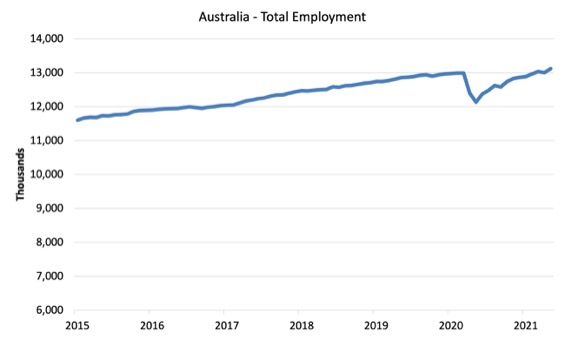
Total employment in Australia went past the February 2020 level in March 2021, after declining by 6.6 per cent between February and May 2020.
The following graph shows the recent history.
Industry level employment impacts
There are 18 separately identified industry group under the Australian and New Zealand Standard Industrial Classification (ANZSIC).
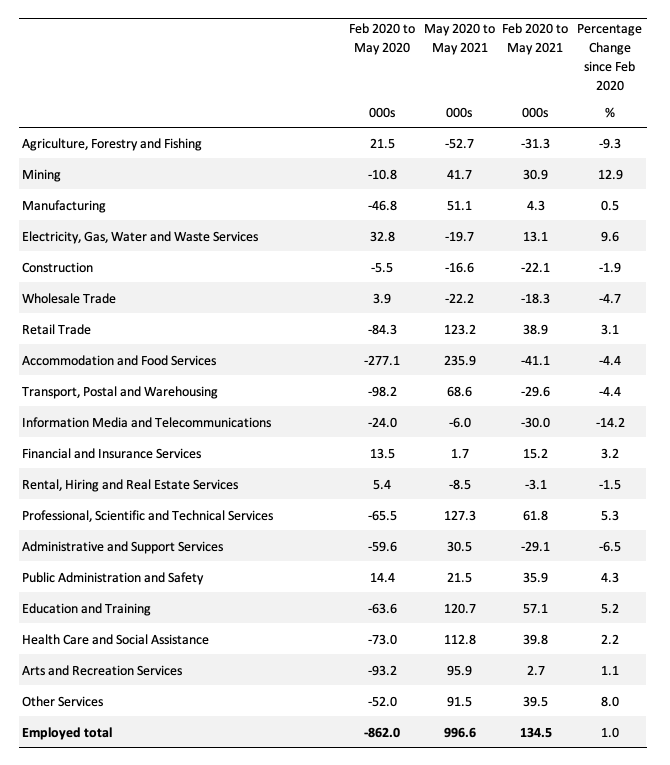
The following table shows the top level industry employment impacts of the lockdown recession and the subsequent return to employment growth.
The employment losses at the aggregate level (total Australian employment) were over the February 2020 to May 2020 period. After that steady employment gains were made as shown in the first graph).
The separate industry groups were not necessarily in sync with the national aggregate as the data in the next table shows.
The second-last column shows the total change in employment in thousands between February 2020 and May 2021, while the next column expresses that change as a per centage of February 2020 employment.
The sectors losing employment since the onset of the pandemic are Agriculture, Forestry and Fishing; Construction; Wholesale Trade; Accommodation and Food Services; Transport, Postal and Warehousing; Information, Media and Telecommunications; Rental, Hiring and Real Estate Services; and Administrative and Support Services.
To understand why these sectors endured these losses we need to dig further.
Sub-sector employment impacts
The detailed sectoral data is not seasonally adjusted so there are slight differences in the totals in the Table below and the seasonally-adjusted data reflected in the graph above.
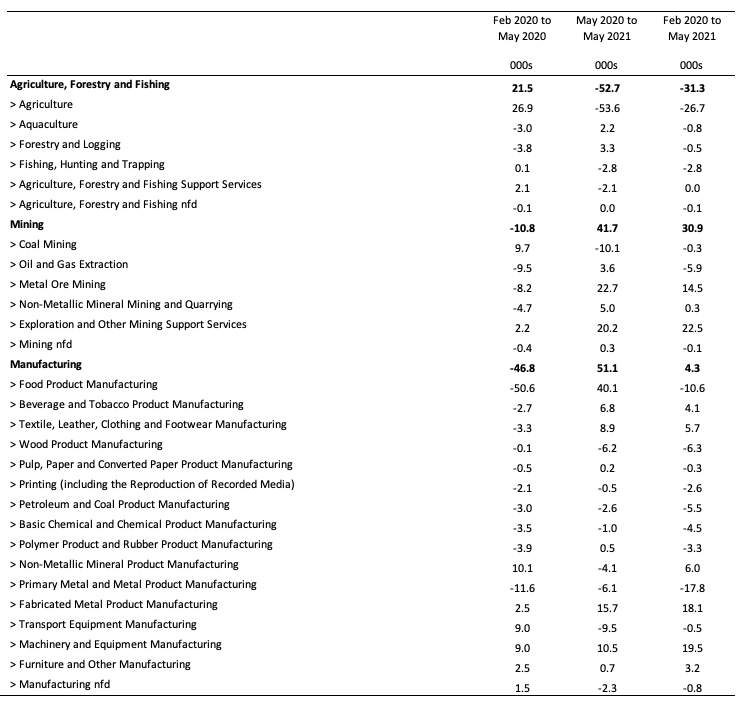
Given the detail to be presented, I cut the 18 ANZSIC industries into groups of (in classification order), and created a separate Table for each.
Here are the results for Agriculture, Forestry and Fishing, Mining and Manufacturing down to the 2-digit level (the sub-sector).
Here is the table for Electricity, Gas, Water and Waste Services; Construction; Wholesale Trade; and Retail Trade.
The surprise is the loss of jobs in construction all due to the Construction services.
The large State government infrastructure projects allows a strong result for ‘Heavy and Civil Engineering Construction’.
The rebound in retail trade is also notable.

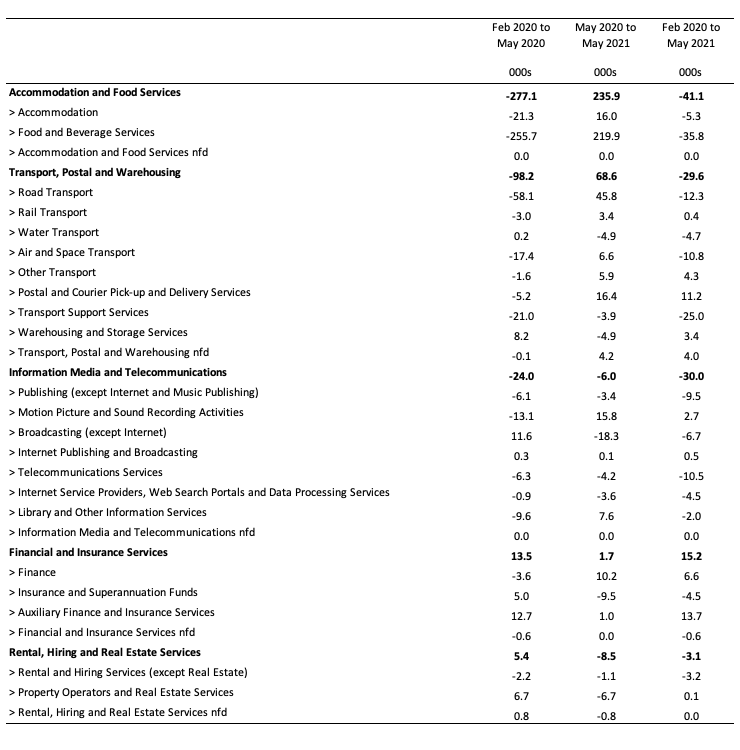
Here is the table for Accommodation and Food Services; Transport, Postal and Warehousing; Information Media and Telecommunications; Financial and Insurance Services; and Rental, Hiring and Real Estate Services.
The large loss in the Accommodation and Food Services is a direct result of continued lockdowns and the decline in tourism as is the net loss in Air and Space Transport.
I was surprised by the result for Information Media and Telecommunications, which I would have expected to have risen somewhat. More investigation is required.
The decline in the Rental, Hiring and Real Estate Services is a product of the tourism slump driven by the travel restrictions.
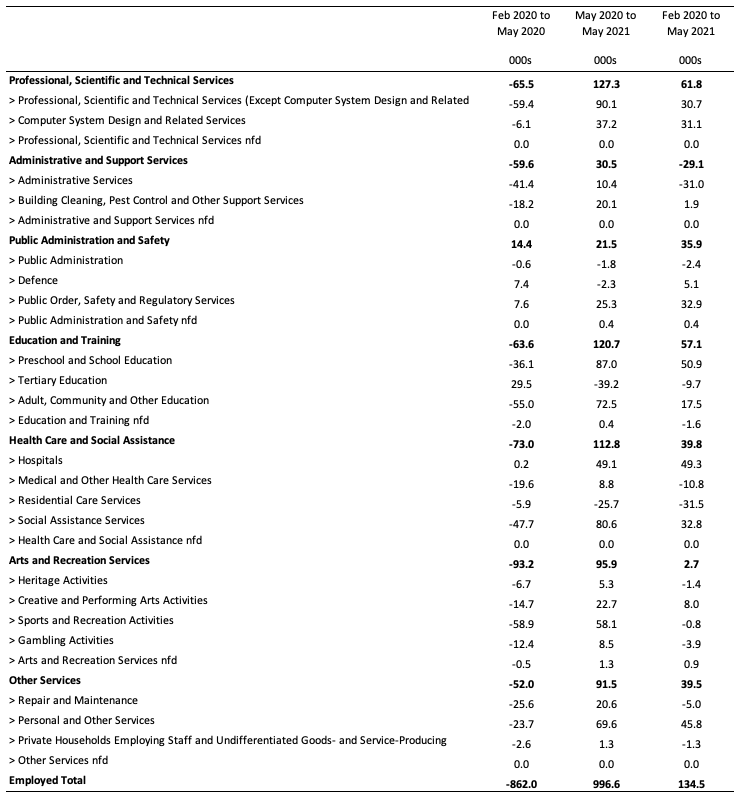
Finally, the next table applies to Professional, Scientific and Technical Services; Administrative and Support Services; Public Administration and Safety; Education and Training; Health Care and Social Assistance; Arts and Recreation Services; and Other Services.
The net increases in Public Administration and Safety and Health Care is pandemic related – more testers, hospital staff, social welfare officers dealing with the mental health fall out.
Note the net loss of jobs in the Tertiary Education sub-sector, which is a direct result of the Federal government’s unwillingness to provide any pandemic support to that sector as university revenue was decimated by the closure of the external border and the drying up of overseas student income.
That was an act of pure bastardry.
Conclusion
I have also crunched the occupational data that provides further detail but that data is too detailed to present easily here.
I am of the view that the pandemic has not damaged professional and high-pay workers all that much.
They have been able to work from home and their salaries and hence incomes have been largely protected.
The real damage is in the lower paid sectors and the lower paid occuptionations across the board.
So, while the pandemic was a very peculiar type of recession (driven by lockdowns) etc, the distributional consequences do not appear to be very different from a typical recession.
Income and wealth distributions become more skewed as the lower end loses out.
That is enough for today!
(c) Copyright 2021 William Mitchell. All Rights Reserved.
Speaking of the pandemic in the past tense seems a bit optimistic at this point.
Virologists and public health officials are now talking about covid-21, a development arising out of the variants.
With covid-19 the thinking was you had to be in room with an infected person for about 15min before it became likely you would develop an infection. With covid-21, it appears people just have to walk past each other (5 to 10 seconds exposure) for transmission to take place.
Morbidity and mortality associated with the new strains has increased not decreased, so the development has to be taken seriously.
Outbreaks are now getting difficult to control without lock downs even in places were the original virus was well contained.
The ability of the current vaccines to maintain efficacy against the growing variants is also in question now, and Biden has invested $3.2billion into research on preventive and curative drugs.
I agree with J Christensen that we likely haven’t seen the last of massive Covid social and economic disruptions, that right now we’re essentially in a lull before another pandemic storm wave. Only time will tell if J and I are being pessimistic or realistic, but a second global Covid shutdown, requiring additional infusions of trillions upon trillions in fiat money to again weather and control the crisis, should be the icing on the cake for the intellectual victory of MMT. It would be a terrible price to pay for truth to emerge, but such often is history. On another note, while reading the Gospel this morning, I was struck by a remark attributed to Jesus which MMT might strangely find useful in supporting its theory of the origin of money. According to the Gospel story, the PTB tried to trap Jesus into supporting zealot-style insurrection (or, alternatively, losing the support of more radical Jews) by asking him whether taxes should be paid to Caesar. Jesus, as we know, then asked for the production of a coin and, noting the image and inscription of Caesar on it, said that people should render unto Caesar what is Caesar’s and to God what is God’s (allowing them to sort that out for themselves). The only point I’m making is that Jesus apparently agrees with MMT that the origin of money is the state, not barter or some other nongovernmental phenomenon.