The recent extreme weather in the northern hemisphere, the twin monster tropical storms in Japan,…
Massive wastage of labour in the European Union
I have been updating my databases in the last few days and getting up to speed on the latest trends. In the past, I developed a set of broad labour market indicators for Australia with colleagues at the – Centre of Full Employment and Equity (CofFEE). Our quarterly measures of underemployment were precursors to the Australian Bureau of Statistics measures which are now published on a monthly basis. I was doing some calculations this morning using Eurostat data as part of some research I am doing to assess the inflationary potential that exists in various labour markets. As regular readers will know, my assessment of inflation risk starts in the labour market. Rarely do we encounter a situation where nominal spending outstrips the productive capacity of the economy (a demand-pull inflationary environment). That can occur is specific product segments but rarely overall. History tells us that there has to be some distributional struggle between labour and capital to drive an inflationary spiral. I am out there looking for any evidence of such a struggle. I am not having much success!
Concepts – unemployment and underutilisation
The labour force framework is the foundation for cross-country comparisons of labour market data and is made operational through the International Labour Organization (ILO) and its International Conference of Labour Statisticians (ICLS).
These conferences and expert meetings develop guidelines or norms for implementing the framework and generating national labour force data.
The rules contained within the framework generally have the following features:
- an activity principle, which is used to classify the population into one of the three basic categories in the labour force framework.
- a set of priority rules, which ensure that each person is classified into only one of the three basic categories in the labour force framework.
- a short reference period to reflect the labour supply situation at some point in time.
The system of priority rules ensure that labour force activities take precedence over non-labour force activities and working or having a job (employment) takes precedence over looking for work (unemployment).
As with most statistical measurements of activity, employment in informal sectors lies outside the scope of measurement.
Paid activities take precedence over unpaid activities.
A person is typically considered to be employed if they work 1 or more hours per week, which means the threshold between being unemployed and employed is marginally to say the least.
In terms of those out of the labour force, but marginally attached to it, the ILO states that persons marginally attached to the labour force are those not economically active under standard definitions of employment and unemployment, but who, following a change in one of the standard definitions of employment or unemployment, would be reclassified as economically active.
For example, changes in criteria used to define availability for work (whether defined as this week, in the next 4 weeks etc.) will change the numbers of people classified to each group.
Underutilisation is a general term describing wastage of willing labour resources.
It arises from a number of different reasons that can be subdivided into two broad functional categories:
- a category involving unemployment or its near equivalent – In this group, we include the official unemployed under ILO criteria and those classified as being not in the labour force on search criteria (discouraged workers), availability criteria (other marginal workers), and more broad still, those who take disability and other pensions as an alternative to unemployment (forced pension recipients). These workers share the characteristic that they are jobless and desire work if there were available vacancies. They are however separated by the statistician on other grounds
- a category that involves sub-optimal employment relations – Workers in this category satisfy the ILO criteria for being classified as employed but suffer ‘time related underemployment’ – for example, full-time workers who are currently working less than 35 hours for economic reasons or part-time workers who prefer to work longer hours but are constrained by the demand-side. Sub-optimal employment can also arise from ‘inadequate employment situations’ – where skills are wasted, income opportunities denied and/or where workers are forced to work longer than they desire.
The following diagram summarises the main sources of labour underutilisation and trace them back to their labour force status.
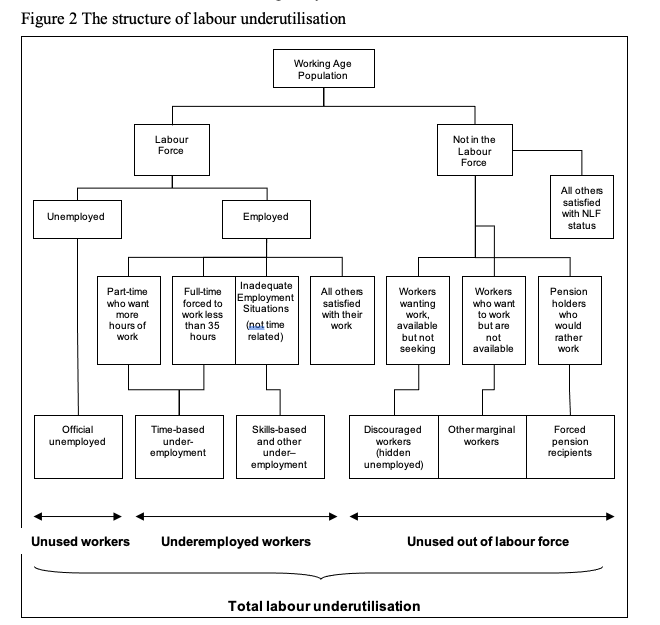
We consider a person to be unemployed if they are over a particular age, they do not have work, but they are currently available for work and actively seeking work.
Unemployment is defined as the difference between the economically active population (civilian labour force) and employment.
The inference is that the economy is wasting resources and sacrificing income by not having the unemployed involved in productive activity.
The diagram above shows that there are other avenues of labour resource wastage that are not captured by the unemployment rate as defined in this manner.
The persons represented in these other avenues of resource wastage may be either in or out of the labour force.
Time based and other types of underemployment
Underemployment may be time-related, referring to employed workers who are constrained by labour demand to work fewer hours than they desire, or to workers in inadequate employment situations, including skill mismatch.
Time-related underemployment is defined in terms of an individual who is willing to work additional hours, is available to work additional hours, but is unable to find the desired extra hours.
An economy with rising underemployment is less efficient than an economy which meets the labour preferences for working hours.
In this regard, involuntary part-time workers share characteristics with the unemployed.
A part of an underemployed worker is employed and a part is unemployed, even though they are wholly classified among the employed.
Marginally attached workers and others outside the labour force
From a statistical consideration, discouraged workers (also called hidden unemployed) are classified as being not in the labour force.
The international guidelines suggest, however, that for persons not in the labour force, the relative strength of attachment to the labour market be measured.
From the perspective of underutilisation, the issue is whether those classified as being out of the labour force have characteristics similar to those who are classified as being in the labour force but unemployed.
They want to work and are available for work (under the same terms as the unemployed) but believe that search activity is futile given the depressed labour market.
The discouraged worker is thus more like the unemployed worker than they are, for example, like a retired person or a child in full-time education.
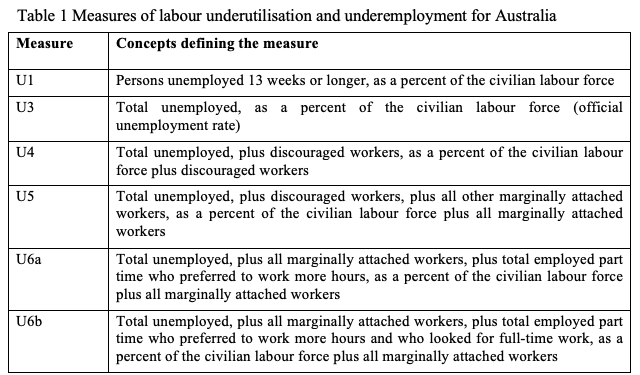
In the mid-1990s, the US Bureau of Labor Statistics developed six indicators to measure labour underutilisation.
The measures are arranged from very narrow indicator (short-term unemployment) to the broadest conception of labour wastage.
CofFEE adapted this technique to different data definitions and availability in Australia and the following Table describes the Measures of labour underutilisation and underemployment that we developed for Australia.
This morning, I calculated a version of those measures for the European Union 27 (again tailored to the way Eurostat presents its data).
As I noted in the Introduction, I am researching the possible inflationary environment in various countries and my starting place, as you would guess, is the state of the labour market.
It is very hard to precipitate an inflationary spiral if the labour market is flat.
The European Union labour market reality
The first graph shows the evolution of total employment and hours worked for the EU27 since the March-quarter 2008 to the December-quarter 2020 (the latest available data).
The series were indexed at 100 in the March-quarter 2008 (so just before the onset of the GFC).
The time series are interesting because they tell a story about how the European labour markets (in aggregate) adjusted to the GFC and the Pandemic.
During the GFC, both hours worked and employed persons were shed.
In the recovery, which was incredibly slow to emerge – it took until the March-quarter 2013 for employment to reach the trough (the downturn) as a result of the ridiculous austerity that was imposed across the Member States.
And employment did not return to its pre-GFC level until the December-quarter 2016.
Hours worked also fell for many years, reaching the trough in the June-quarter 2013 and in the lead-up to the pandemic had still not reached the pre-GFC level.
That should be emphasised – the European Union 27 Member States in total were still working less hours in the December-quarter 2019 than they were working in the March-quarter 2008 and that is not because of enlightened employment practices.
The experience of the pandemic is different with employment taking a smaller hit – dropping by 1.4 points between the peak in the December-quarter 2019 and the December-quarter 2020.
However, hours worked collapsed by 5.1 points over the same period.
This pattern is the result of the policies that were implemented by various nations during the Pandemic which aimed to protect the employee-employer relation while shutting down workplaces.
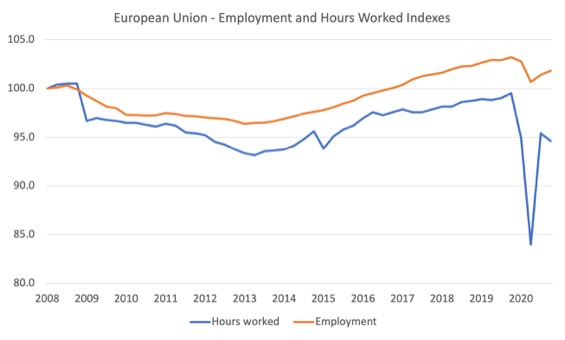
Just looking at that data indicates to me that there is little likelihood of any strong wage pressures emerging within the European Union.
The next graph shows the official unemployment rate (U3) and the broadest measure of labour underutilisation (U6) for the EU27.
You can see that during the GFC, the European Commission through its obsessive austerity mindset allowed labour wastage to rise above 20 per cent and only slowly retreat.
Just before the pandemic, the broadest rate had only fallen marginally below the pre-GFC level.
That is just deliberate human wastage leading to massive daily losses of national income.
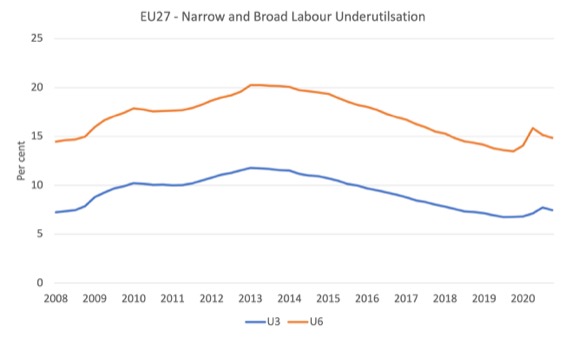
By the December-quarter 2020, the official unemployment rate was 7.5 per cent which was 0.7 points above the pre-pandemic level.
The unemployment rate was 3.1 per cent, effectively unchanged over the pandemic.
The U4 rate – Total unemployed, plus discouraged workers, as a percent of the civilian labour force plus discouraged workers – was 11 per cent up from 9.7 per cent (pre-pandemic).
The U5 rate – Total unemployed, plus discouraged workers, plus all other marginally attached workers, as a percent of the civilian labour force plus all marginally attached workers – was 11.69 per cent up from 10.4 per cent.
And the U6 rate – U6 – Total unemployed, plus all marginally attached workers, plus total employed part time who preferred to work more hours and who looked for full-time work, as a percent of the civilian labour force plus all marginally attached workers – was 14.8 per cent up from 13.4
You can draw two broad conclusions.
1. Quoting the unemployment rate as the indicator of the state of the EU27 labour market is likely to grossly underestimate the extent of labour wastage.
2. With 14.8 per cent of the willing labour resources underutilised in one way or another, it is hard to see any wage pressures emerging from that depressed labour market.
Conclusion
I will report more on this research as it unfolds.
That is enough for today!
(c) Copyright 2021 William Mitchell. All Rights Reserved.
What meaning, I ask you, can data yield (however meticulously crunched) when propositions like the following are in place? (1) “A person is typically considered to be employed if they work 1 or more hours per week, which means the threshold between being unemployed and employed is marginally (sic) to say the least…,” and (2) “(f)rom a statistical consideration, discouraged workers (also called hidden unemployed) are classified as being not in the labour force.” Has not “employment” come to be defined and measured as that level of service required of the poor to meet the needs of the rich, with anything beyond this bare minimum deemed inflationary?
Dear Newton E. Finn (at 2021/06/24 at 11:27 pm)
Your comment is quite representative of the lay view of national statistics. And, while I am not suggesting your extend that view into the ‘conspiracy’ theories about corruption in the national statistics offices around the world, it is a common sentiment that there is something up with the data and politicians are using the data to manipulate us.
The fact is that there is nothing exceptional about classifying employment as occurring when a person works one or more hour per week. That threshold obviously defines the difference between no work and some work.
The popular media likes to use sensational headlines (and make money) based on a few statistics – for example, unemployment rates, employment growth – which exploit the ‘ignorance’ of the general public and allow the politicians to mislead us and implement flawed policy positions.
But the point is that when we know employment occurs under this definition, it just means that we then have several follow up questions before we know what the reality is.
And the national statisticians provide extra data to allow us to answer those questions.
So we would ask, among other things:
1. What is the distribution of employment by hours worked?
2. What is the regional distribution of the employment changes?
3. What is the breakdown of conditions of work for the employment changes – are they casualised jobs or do they have standard conditions (leave, sick pay etc)
4. What is the demographic breakdown of the employment changes – who is getting the jobs?
5. What is the industrial and occupational distribution of the employment changes? This allows us to assess whether the jobs are high pay, low pay or whatever.
All that sort of data is available and I regularly report and analyse it.
The message is clear.
We need stable and broadly understood definitions of the labour force categories.
They should be comparable across jurisdictions and nations.
That is what the ILO classifications provide.
Then we should avoid forming opinions based on what we read in the financial media. Rather, if we want to gain knowledge about the data trends, we should consult the work of experts (like me) who do understand all these limitations and classifications and can provide informed analysis.
That is, in part, why I provided the extra views of the European data to disabuse people from thinking that a 7 per cent unemployment rate is somehow the end of the story.
I hope that helps.
best wishes
bill
Thanks, Bill. Helps a heap. I never for a moment was calling into question the accuracy of your analysis, merely expressing in the most general terms what I know is a mutual disgust with what has happened to employment in its entirety since we both were young. Your voice and your work, the clarity and precision you bring into the crucial economic arena, is so deeply appreciated by so many.
Newton Finn’s comment is also quite representative of people who have a good understanding of the English Language and actual reality. Those one hour a week jobs are not very common and for statisticians to pick that limit to determine employment status is questionable to say the least. You could also ask if someone worked one hour in the last three months to determine employment- it is somewhat arbitrary.
I don’t think you have to be a conspiracy theorist to recognize that economists have taken ordinary words that normal people understand to have a meaning and then redefined them in ways that are not ordinary usage. And then often imply the ordinary usage of the term in discussion- while leaving themselves the excuse that they were using the ‘technical’ definition as understood by economists.
EU27 labor market statistics, like any average, hide the vast disparities among its member countries, especially when comparing the north vs the south. In what respect does Germany resemble Greece in 2008 and 2021? There are other hidden factors that distort the actual labor market picture as well. Since the GFC in excess of half a million workers emigrated from Greece to the northern countries, the overwhelming majority of whom are highly educated and trained young people. This brain drain isn’t reversible even in the distant future. Whereas previously they were counted in the labor force as unemployed, now they have vanished into thin air and artificially reduced the official local unemployment rate. The same thing but to a lesser degree happened in the rest of the south. All these countries paid with their limited valuable resources to increase the productivity of domestic labor only to be enjoyed free of charge by the rich north. This is one of the many reasons why a pan European JG program is needed, which could easily be funded by the ECB within established institutions.
Jerry – It is conceivable that someone who only needs to work one hour a week is entirely satisfied with their employment. That’s why they measure underemployment, too.
It’s not the statisticians that are hiding anything, it’s the politicians that trumpet the employment percentage and ignore the labour force and underemployment, and the mainstream media which just parrots the press releases without question. You need to point the finger at the guilt party.
Sure Matt, it is conceivable that a person has a job that they work at only one hour every seven days and they and their employer are happy with that situation. I don’t know of many jobs like that -but maybe there are some. I might want that job myself. But what if their ‘hour’ is cut to one hour every eight days? Now they are employed or unemployed every other week?