Last week, the RBA hiked interest rates again and tried to claim the economy was…
Inflation is not necessarily due to excessive spending
Yesterday’s data from the Australian Bureau of Statistics (October 28, 2020) – Consumer Price Index, Australia – for the September-quarter 2020, illustrates what a lot of people do not fully grasp. Inflation can be driven by administrative decisions and can be curtailed or restrained by varying those decisions. No tax rises or cuts to government spending are needed. The data also reflect on the reasons that predictions from mainstream (New Keynesian) economic models fail dramatically. Mainstream economists claim that monetary policy (adjusting of interest rates) is an effective way to manage the economic cycle. They claim that central banks can effectively manipulate total spending by adjusting the cost of borrowing to increase output and push up the inflation rate. The empirical experience does not accord with those assertions. Central bankers around the world have been demonstrating how weak monetary policy is in trying to stimulate demand. They have been massively building up their balance sheets through QE to push their inflation rates up without much success. Further, it has been claimed that a sustained period of low interest rates would be inflationary. Well, again the empirical evidence doesn’t support that claim. The Reserve Bank of Australia has now purchased more than $50 billion worth of federal government bonds and a smaller amount of state and territory government debt. And yet inflation is well below the lower bound of the RBA’s inflation targetting range. The most reliable measure of inflationary expectations are flat and below the RBA’s target policy range.
The summary Consumer Price Index results for the September-quarter 2020 are as follows:
- The All Groups CPI rose by 1.5 per cent after falling by 1.8 per cent in the June-quarter.
- The All Groups CPI rose by 0.7 per cent over the 12 months to the September-quarter 2020, compared to the annualised fall of -0.4 per cent over the 12 months to June-quarter 2020.
- The Trimmed mean series rose by 0.4 per cent in the September-quarter 2020 and by 1.2 per cent over the previous year (steady).
- The Weighted median series rose by 0.3 per cent in the September-quarter 2020 and by 1.3 per cent over the previous year (steady).
The ABS Press Release notes that:
In the September quarter child care fees returned to their pre-COVID-19 rate having been free during the June quarter. This was the largest contributor to the CPI rise in the September quarter. Excluding the impact of child care, the CPI would have risen 0.7 per cent.
Which is the point.
The negative 1.9 per cent result in the June-quarter was all down to the federal government’s decision early in the Pandemic to provide free child care to both help families who had lost income and to help the child care centres who were at risk of insolvency due to the lockdowns.
And then when the decision was reversed – without good reason in my view – the price spike pushes up the inflation rate.
So it was an administrative decision not related to the balance between aggregate spending and the productive capacity of the economy to meet that spending through the provision of goods and services.
Which means that all those who argue that Modern Monetary Theory (MMT) is fatally flawed because the only defence against any inflationary effects of fiscal deficits are tax hikes, which might be politically difficult to introduce at certain times, haven’t really understood the full array of tools available to a government that is intent on controlling an inflationary outbreak.
The other point to note is that inflation has not surged in Australia, despite the Reserve Bank of Australia purchasing $A52,250 million worth of federal government bonds in secondary markets and $A11,098 million worth of state/territory government debt.
In other words, the central bank has been significantly funding government spending at both federal and state levels.
No inflationary pressures evident.
Which accords with the historical record where central banks in Europe, the UK, Japan, the US have been engaged in large-scale bond purchases and inflation is benign, and, in Japan’s case, has been for 30 years.
What is apparent from yesterday’s inflation figures and the most recent labour market data is that there is plenty of room for further fiscal stimulus to help the economy create more jobs to reduce unemployment and underemployment.
Trends in inflation
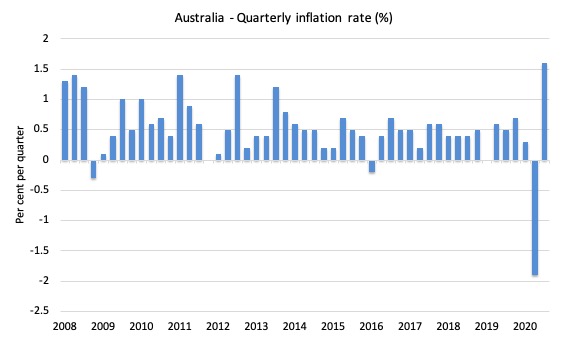
The headline inflation rate increased by 1.6 per cent in the September-quarter 2020 and 0.7 per cent over the 12 months to September (down from -1.9 per cent in the previous quarter).
The following graph shows the quarterly inflation rate since the March-quarter 2008.
The big negative spike in the June-quarter was mostly due to the free child care, which was reversed in the September-quarter.
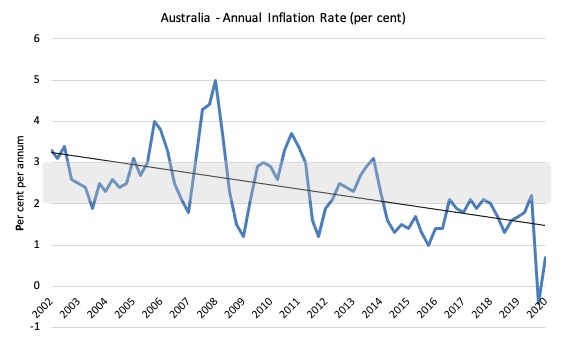
The next graph shows the annual headline inflation rate since the first-quarter 2002. The black line is a simple regression trend line depicting the general tendency. The shaded area is the RBA’s so-called targetting range (but read below for an interpretation).
The trend inflation rate is quite steeply downwards.
Once we take out the so-called ‘volatile’ items (such as, food and fuel), the annual inflation rate is only 1.2 per cent. Well below the RBA’s target range.
What is driving inflation in Australia?
The following bar chart compares the contributions to the quarterly change in the CPI for the September-quarter 2020 (blue bars) compared to the June-quarter 2020 (green bars).
Note that Utilities is a sub-group of Housing.
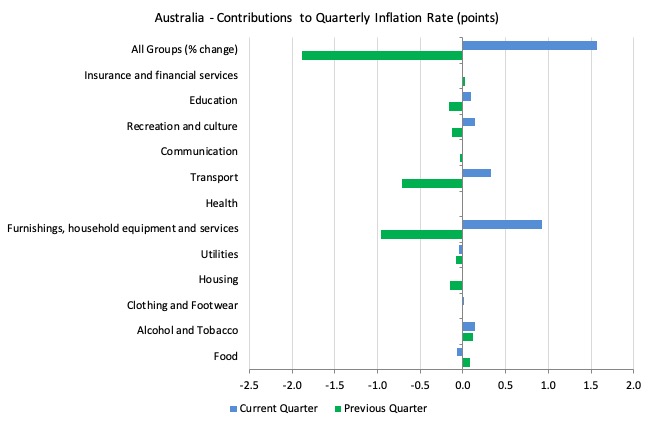
The ABS say that:
- Furnishings, household equipment and services rose in all capital cities due to child care, following the end of free child care on 13 July. Differences in the capital city movements at the All groups level can largely be explained by differences in the weight of child care in each city.
- Transport rose in all capital cities due to price rises in automotive fuel as global demand saw a partial return, and global production fell. Automotive fuel increases ranged from (+0.1%) in Darwin to (+11.1%) in Melbourne. Hobart was the only city to record a fall (-1.5%).
“Education rose in most capital cities due to preschool and primary education following the discontinuation of free childcare, affecting before and after school care.”
The next graph provides shows the contributions in points to the annual inflation rate by the various components.
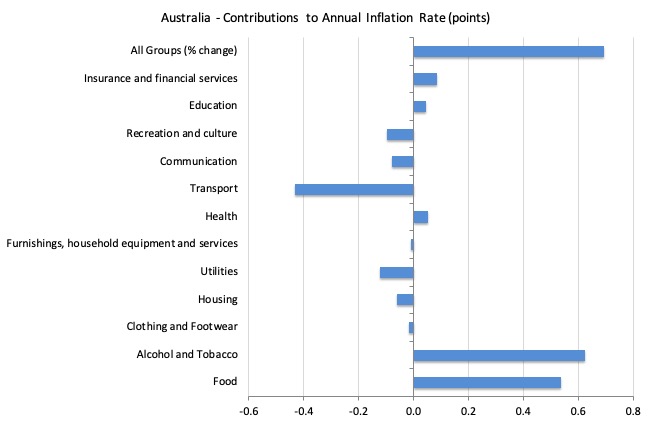
Here is another example of the administrative pricing effect.
You can see that the ‘Alcohol and tobacco group’ contributed 0.62 points towards the annual inflation rate of 0.69.
The ABS note that:
A rise of 3.2% in tobacco was the main contributor, due to the 12.5% annual excise indexation
That is, a government policy decision.
Inflation and Expected Inflation
I mentioned at the outset, the on-going inflation obsession among market players.
If you examine the market trends in speculative trades then it is clear that the traders were betting on a major shift in the RBA policy upwards after 2016 because they have been punting on a substantial rise in inflation.
They have been systematically wrong on that front.
More recently, it is clear their expectations have been falling as the RBA holds to its low interest rate regime.
Significantly, it is this misplaced fear of inflation, that, in place, drives the misplaced preference by New Keynesians for counter-stabilising monetary policy instead of fiscal policy.
If we went back to 2009 and examined all of the commentary from the so-called experts we would find an overwhelming emphasis on the so-called inflation risk arising from the fiscal stimulus. The predictions of rising inflation and interest rates dominated the policy discussions.
The fact is that there was no basis for those predictions in 2009 and nine years later no major inflation outbreak is forthcoming.
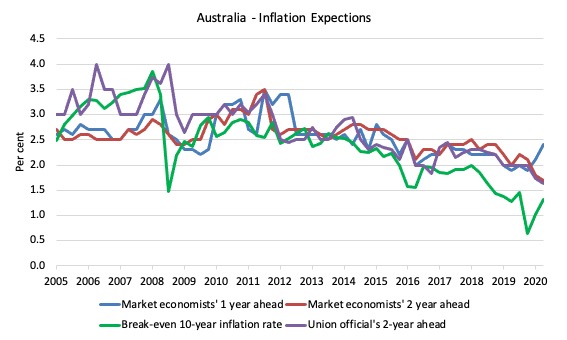
The following graph shows four measures of expected inflation expectations produced by the RBA – Inflation Expectations – G3 – from the June-quarter 2005 to the September-quarter 2020.
The four measures are:
1. Market economists’ inflation expectations – 1-year ahead.
2. Market economists’ inflation expectations – 2-year ahead – so what they think inflation will be in 2 years time.
3. Break-even 10-year inflation rate – The average annual inflation rate implied by the difference between 10-year nominal bond yield and 10-year inflation indexed bond yield. This is a measure of the market sentiment to inflation risk.
4. Union officials’ inflation expectations – 2-year ahead.
Notwithstanding the systematic errors in the forecasts, the price expectations (as measured by these series) are trending down in Australia, which will influence a host of other nominal aggregates such as wage demands and price margins.
The market economists’ one-year and two-year ahead expectations are well above the Break-even 10-year inflation rate. Even Union officials have fallen for the accelerating inflation outlook.
It is well known that the ‘market economists’ systematically get movements in the economy wrong and one wonders if their organisations actually bet money on their analysis!
The most reliable measure – the Break-even 10-year inflation rate – is now at 1.3 per cent, well below the lower bound of the RBA targetting range
It has been at or below the lower bound of the RBA’s policy target range since March 2016.
The other expectations are still lagging behind the actual inflation rate, which means that forecasters progressively catch up to their previous forecast errors rather than instantaneously adjust, a further piece of evidence that refutes the mainstream economics hypothesis that decision makers use ‘rational expectations’ (that is, on average get it right).
Implications for monetary policy
What does this all mean for monetary policy?
Clearly, the market economists were punting on a rise in the interest rate and have only started to realise in the last few quarters that this is unlikely to happen any time soon (as disclosed by their inflationary expectations above).
The inflation trends highlighted in yesterday’s data release provide no basis for any expectation that the RBA will hike interest rates anytime soon.
In fact, if anything, the pressure is now on the RBA to cut rates again and probably expand their QE program, which started in March 2020.
The Consumer Price Index (CPI) is designed to reflect a broad basket of goods and services (the ‘regimen’) which are representative of the cost of living. You can learn more about the CPI regimen HERE.
Please read my blog – Australian inflation trending down – lower oil prices and subdued economy – for a detailed discussion about the use of the headline rate of inflation and other analytical inflation measures.
The RBA’s formal inflation targeting rule aims to keep annual inflation rate (measured by the consumer price index) between 2 and 3 per cent over the medium term. Their so-called ‘forward-looking’ agenda is not clear – what time period etc – so it is difficult to be precise in relating the ABS data to the RBA thinking.
What we do know is that they do not rely on the ‘headline’ inflation rate. Instead, they use two measures of underlying inflation which attempt to net out the most volatile price movements.
To understand the difference between the headline rate and other non-volatile measures of inflation, you might like to read the March 2010 RBA Bulletin which contains an interesting article – Measures of Underlying Inflation. That article explains the different inflation measures the RBA considers and the logic behind them.
The concept of underlying inflation is an attempt to separate the trend (“the persistent component of inflation) from the short-term fluctuations in prices. The main source of short-term ‘noise’ comes from “fluctuations in commodity markets and agricultural conditions, policy changes, or seasonal or infrequent price resetting”.
The RBA uses several different measures of underlying inflation which are generally categorised as ‘exclusion-based measures’ and ‘trimmed-mean measures’.
So, you can exclude “a particular set of volatile items – namely fruit, vegetables and automotive fuel” to get a better picture of the “persistent inflation pressures in the economy”. The main weaknesses with this method is that there can be “large temporary movements in components of the CPI that are not excluded” and volatile components can still be trending up (as in energy prices) or down.
The alternative trimmed-mean measures are popular among central bankers.
The authors say:
The trimmed-mean rate of inflation is defined as the average rate of inflation after “trimming” away a certain percentage of the distribution of price changes at both ends of that distribution. These measures are calculated by ordering the seasonally adjusted price changes for all CPI components in any period from lowest to highest, trimming away those that lie at the two outer edges of the distribution of price changes for that period, and then calculating an average inflation rate from the remaining set of price changes.
So you get some measure of central tendency not by exclusion but by giving lower weighting to volatile elements. Two trimmed measures are used by the RBA: (a) “the 15 per cent trimmed mean (which trims away the 15 per cent of items with both the smallest and largest price changes)”; and (b) “the weighted median (which is the price change at the 50th percentile by weight of the distribution of price changes)”.
Please read my blog – Australian inflation trending down – lower oil prices and subdued economy – for a more detailed discussion.
So what has been happening with these different measures?
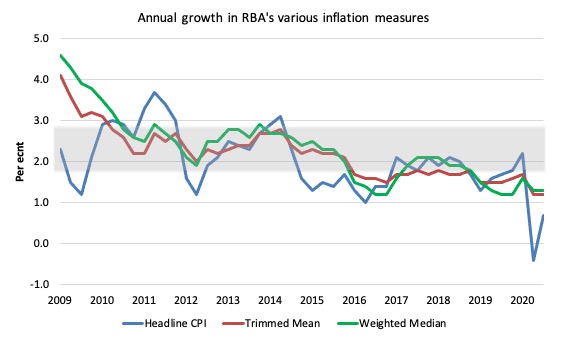
The following graph shows the three main inflation series published by the ABS since the March-quarter 2009 – the annual percentage change in the All items CPI (blue line); the annual changes in the weighted median (green line) and the trimmed mean (red line).
The RBAs inflation targetting band is 2 to 3 per cent (shaded area). The data is seasonally-adjusted.
The three measures are all currently below the RBA’s targetting range:
1. CPI measure of inflation – 1.6 per cent and below the RBAs target band for the last two years.
2. The RBAs preferred measures – the Trimmed Mean (1.2 per cent and stable) and the Weighted Median (1.3 per cent and stable) – are also below the lower bound of the RBAs targetting range of 2 to 3 per cent.
How to we assess these results?
First, there is clearly a downward trend in all of the measures – even before the pandemic. The “core” measures used by the RBA have been benign for many quarters even with an on-going significant fiscal deficit, record low interest rates, and the newly introduced QE program.
Second, inflationary expectations are benign and trending downwards, although the ‘market’ sector seems to think there will be a rise in inflation. I would discount that expectation.
Third, in terms of their legislative obligations to maintain full employment and price stability, one would think the RBA would have to change its monetary policy tack.
It clearly cannot cut interest rates much and will avoid negative rates.
I think it is time they dropped their prima donna position and announced they would fund all deficits – federal and state – for the foreseeable future to allow governments to deal with the pandemic without the unknowing claims in the media that public debt is out of control.
We don’t need those diversions any longer.
Conclusion
Just before the pandemic hit all the macroeconomic policy talk in Australia was about getting the fiscal position into surplus to reduce public debt and ensure that inflation didn’t accelerate.
Given what has happened since, one wonders if they will ever be able to prosecute that nonsense into the future.
The problem is that the effort to cut public net spending created the circumstances such that the economy was already in trouble even before the pandemic hit.
Now we have large deficits, low interest rates and a central bank engaging in QE.
Inflation will not be an issue.
That is enough for today!
(c) Copyright 2020 William Mitchell. All Rights Reserved.
No matter how much evidence we have the neo-liberals will still keep rolling out the Weimar Germany or Zimbabwe cases to skew peoples judgement.
Now back to Otis Rush: https://www.youtube.com/watch?v=Uy2tEP3I3DM&feature=emb_logo
” the Reserve Bank of Australia purchasing $A52,250 million worth of federal government bonds in secondary markets ”
Is there any way to ascertain how much profit was made by bond market players before the RBA stepped in?
It would be a useful statistic when arguing against the practice of issuing bonds.
Brian Romanchuk does a lot of great work on the 10 year break even inflation.
Which can be found at his blog Bond Economics and even wrote a short book about it.
“Oil prices have a significant effect on spot breakeven inflation via their effect on gasoline prices. If we look at short-term breakevens, most of the “mispricing” outside of crises (where all relative valuations get hammered) is due to gasoline prices moving in one direction or another. If one could get the correct hedging ratio for gasoline futures and short-term breakevens (which is complex task, and is not implementable at many asset managers), short-term breakeven inflation trading would likely look quite efficient (most of the time). ”
And
” He argues that the base case would be a repeat of the glacial recoveries seen in the post-1990 era. The theory behind MMT helps explain why economies have been so slow-moving — and what could be done to return to the economy closer to a high pressure labour market. In any event, the forward rate has recovered to levels that are near the cyclical lows of the previous cycle. That is, there is no expectation of a vibrant recovery, with a tight labour market. This is definitely not aligned with the wailing about “MMT is coming!”
Why ?
Because there will be a fiscal error. There’s always a fiscal error the last one and the many before that. They’ll cut back way too early and talk about deficits and debts. The series on PBS America at the moment called the Rosevelts shows they’ve been doing it for decades. Watch the tactics FDR was up against as he was forced to cut back early due to the US supreme court. The supreme court stopped many of his policies and it wasn’t until he tried to get rid of some of the judges that they actually kept social security.
Brian’s books are excellent on the subject and the Rosevelts currently on PBS America is well worth a watch. It shows what MMT has to “face down” to get implemented today.
Look who is in the US supreme court today.
They would all have to die and be replaced by” true” left wingers not liberals before a job guarentee the way we describe it could ever be implemented.
It just ain’t gonna happen I’m afraid. Nowadays it will be a million times worse than what FDR faced. They stopped FDR in his tracks back then with moderates in the court.
Prof Mitchell. My studies of MMT have come to the point that concerns the velocity of circulation of sovereign fiat currencies; is it an important metric?
Sovereign currency issuing Treasury are creating and issuing into their respective non-government sectors; large quantities of their “units of account”, to support locked down non government sector households and firms.
The more these fiscal injections get saved and not spent, means the velocity of circulation of these units of account, is slowing down, with a consequent increase in what is, in neoliberal terms, known as the national debt.
How does MMT overcome the reducing velocity of circulation of fiat currency fiscal stimulus; or, is it irrelevant?
I’m probably wrong, but I thought the main place we see “inflation” when cutting interest rates is through asset prices rising (eg real estate, stocks, precious metals), rather than consumer prices. It seems to me that what the reserve bank expects is for asset price inflation to somehow lead to consumer price inflation. I think this link might be broken (or perhaps was always broken?).
In terms of real estate prices, we have definitely had inflation! similarly with gold and cryptocurrencies as well.
But as long as the money in assets is mostly just buying other assets (e.g. sell an asset and use the money to buy another asset) inflation can’t leak out into other places. The “wealth effect” appears to be getting used to buy assets – e.g. borrow against your house to buy another house, rather than buy goods and services.
Looking at the other aspect, we don’t have supply shortages. Plenty of energy, plenty of food, etc. Zimbabwe and Weimar had supply problems which money printing didn’t fix. Maybe one possible issue is in Aus is water, but with La Nina, should be less of an issue in the short term.
A very interesting discussion where Warren Mosler sets out his take on the relationship between interest rates and inflation from around 40 min in https://podcasts.apple.com/us/podcast/the-mmt-sequence-with-warren-mosler/id1453085489?i=1000495081006 . As I see it Warren isn’t talking about asset price inflation, which is to do with the financialisation economy, but the “real” productive economy. I would be interested in Bill’s views on what Warren has to say.
Zimbabwe also had problems because people were using other currencies rather than the one their government issued,
This would have had all sorts of implications with respect to tax collection and its role in forcing citizens to use the money the government issues.
@vote for pedro,
Yes, but, OTOH, rising real estate prices also leads to a rise in rents.
If the newly bought house, apt. building, or other commercial space cost more to buy then the buyer must raise the rents to cover his/her own payments. This changes what others can charge, as does the imagined increase in the value of such properties that you have owned for years and this makes you charge more because the rent is related to the property’s value, right?
Aren’t rents a part of the CPI?
.
@steve_american
Interest rate decrease will also decrease the lowest acceptable rent that landlord needs to make a profit. Eg at 2% the interest bill on a $400000 loan needs $8000 per year vs $16000 per year at 4%. This means a landlord can lower rent by roughly $230 per week without being “worse off”. Ie the payment a landlord receives less interest costs are equal under both scenarios.
So interest rates decreases could put downward pressure on rents. This gets partly offset by the increase in asset prices, generally meaning a larger loan.
Assuming most landlords are too small to influence market prices for rent – a landlord cannot “raise their rent” to cover costs all that easil. ie why would a landlord wait for a cost increase to raise their rent to market prices? The tenant will likely leave for the cheaper rents wouldn’t they? Or they would get increased rent when occupied but also increased time where the property is vacant, as it takes longer to find a tenant willing to pay a premium.
The more likely outcome is the landlord will want to sell the property I would think. Which is what is happening in Aus now – some investors are starting to leave the property market.
@vote for pedro
1] Interest rates were not at 4%.
I actually, have no idea what a new mortgage rate was In Aust, back in Jan.
If they were at 4% why do you think that banks will reduce the rate to 2% after the pandemic hit.
2] Interest rates on the loan are not the only cost of owning property to rent.
3] Yes, small owners don’t make the ‘market’, but 98% of them will raise their rents ASAP to follow the market.
4] Rental property owners may be selling because they expect the *property bubble to burst* pretty soon and they wan to sell to a sucker *before* the bubble bursts.
“means the velocity of circulation of these units of account, is slowing down”
The velocity isn’t slowing down. The mistake is including all the units.
Subtract the units that are just put in a figurative jar and you’ll find that the velocity of the remaining ones is just as fast as before. The problem is that there is insufficient money, not the speed they are moving. In pipe terms the water is going down the pipe as fast as ever, there just isn’t enough water to fill the pipe.
There are some monetarists (Derek knows them) who are able to do this separation. Most can’t and continue to work with an aggregate – since they *expect* these units to move.
MMT doesn’t. MMT understands that people save for lots of reasons and that these buffers will continue to exist no matter how much policy tries to dislodge them. So it recommends that you don’t try. Instead you accommodate them.
It’s absolutely fascinating that neoliberals, monetarists and even Marxists cannot seem to get their head around the idea that there are piles of money kicking around that have no relationship to underlying production and assets. Even though practically everybody has positive balance in bank accounts and notes on them.
And yet, when you listen to ScoMo during question time, the gloats how the only reason Australia is doing so well in their stimulus efforts compared to the rest of the world, is because of the prudent fiscal situation they where in prior to the pandemic….heading for a surplus.
To my mind raising interest rates would do two things…1 put the brakes on housing prices going out of control and …2 create the desired inflation in all goods and services as the cost of credit increases….not to mention earning more on savings …which would act as another economic stimulator….bingo
Sorry Neil but “The velocity isn’t slowing down. The mistake is including all the units.” is a nonsense statement. Units of account created by the government sector and issued/spent into the non government sector are exactly that, you can’t dismiss some coming out of the Treasury having a different address on them to others. They get saved, including debt reduction, or they get spent; it is as simple as that.
The more times each unit gets spent in transactions between individuals or firms in a given period, the higher the velocity of circulation; and, the more opportunities the Treasury gets to tax those transactions and get its units of account back; lessening the “national debt”. https://thistimeitisdifferent.com/uk-money-velocity-2018
MMT has a lot of academics pushing the theory; BUT, lacks accountants that can explain the arithmetic at street level.
Monetary policy is broken on so many levels of abstraction. Its a secondary to fiscal policy. Even in the narrow selection of where you’d think its effective its not coherent with reality. We’ll only get firms producing more inventory if consumers are spending and taking from inventories faster. If anything that’s not inflationary in a modern economy and moreover it deflationary for any time period beyond what it takes to build a factory to respond to the demand.
Provocative point to be made: Why not double triple the COVID crisis payments in these developed economies? You’re never going to get any inflation like those neoclassical models predict. So what if that money is spent and pushes a secotor beyond its productive capacity, it creates a short term demand-pull effect. So what! Where’s the real damage there? Will that be a debilitating inflation like entire sectors of the economy can add to inflation measure just by rent-seeking price setting.
What happens in real world: Firms will open new assembly lines, a factory built in 2008 will have lesser/exponentially slower automation than a new one in 2020. You literally wont be able to buy the equipment to do the same tasks at the same speeds, those IC’s are not in the semiconductor manufacturers catalogue they’re obsolete, the new ones control robotics at 500% faster speeds, sorry will just have to make a factory for the same cost and size that’s 5 times faster. Produce 5 times efficiently.
The problem with these conventional models will be they wont spot or discern real inflation or deflation problems because they’re counting dollars rather than mapping cyclones, typhoons, floods, drought, fires, earthquakes and volcanoes. Want to predict the next inflation event? watch as global warming climate catastrophies produce real mappable constant inflation in coming years, that’s where we’ll be bitten when something cannot literally be replaced or minimised/substituted/an essential building block material is scarce due to climate change.
steve_american
regarding your points
1) mortgage interest rates in Aus were at 4% not that long ago, and have been cut to 2% since covid.
2) yes interest is not the only cost, but the other costs are not so sensitive to interest rates. So calling R=rent, C=other costs (e.g. rates tax maintenance), i1=interest cost at 4%, and i2=interest cost at 2%. The cash flow would be P1=(R – C – i1) vs P2=(R – C – i2) The difference between these is just the difference in interest costs P2 – P1=(i1 – i2).
This is the situation for someone who bought before interest rates dropped, and their rent didn’t change. If you add in that rent also dropped then R1<R2. This drop in rent would be offset partly by the drop in interest cost. Additionally some of the other costs have been lowered as well, such as land tax and rate reductions.
3) rising rents are more about vacancy rates, not rising house prices. You can increase the rent if there is nowhere else for a tenant to go. This can be seen already, where some landlords are offering free rent for the first 2-4 weeks just to get someone in. Landlords follow the market down as well!
4) I think landlords are also selling because vacancy rates are too high in some areas, which means their income is expected to be on a downward trend if they hold onto the property. If vacancy rates are low (e.g. <1%) then rental income is unlikely to fall, and probably will increase. I'm not sure investors who are getting good and possibly increasing rental income will necessarily feel the urge to sell, unless they need a big pile of money.
I don’t understand about the ‘free’ child care causing inflation to fall just because the government paid for it. And if the government stopped paying for it why would that make inflation rise? It just seems like more of a problem with how inflation is measured than anything else.
“They get saved, including debt reduction, or they get spent; it is as simple as that.”
Not quite. Mainstreamers, Marxists and monetarists assume they are all in motion and calculate velocity on all the units. MMT and sane monetarists understand that quite a lot of the units are saved and therefore stay in one place – and that condition persists over time even if the different units move state in the meantime.
That the difference. There’s either M. Or there is M in motion and an amount of static M not in motion. Much as with a computer network there is bandwidth, used bandwidth and unused bandwidth. It’s not all the same conversations that are generating the ‘used bandwidth’ but in aggregate the total amount remains pretty stable and moves in a particular way at particular times of day.
It’s less the accounting that’s the issue. That tends to be static snapshots. It’s more explaining the dynamic flow between balance sheet states using words that is difficult.
Well I don’t understand how the government paying for something lowers inflation. In the US the government pays for the military and all the ‘hardware’ they sometimes use to kill people- but I don’t see how that is deflationary. Likewise the government ends up paying about half of total medical care in the ridiculous health care provision system that we have- and that doesn’t seem to be deflationary either.
“Well I don’t understand how the government paying for something lowers inflation.”
You’re in the business of selling rockets. The government says the price for rockets is $200 per rocket – take it or leave it.
You wanted $300. What’s your alternative buyer, and where are they going to get the money from if government isn’t injecting $200 per rocket to offset the standard drain to net savings?
One of the reasons for a Job Guarantee is so that the “but what about the jobs” defence to this tactic no longer has any bite – which then means government can drive any price in the economy to where it wants it to be.
A sort of fiscal equivalent of “Quantitative Easing” if you like.
No- I am not in the business of selling rockets. You gotta pick a more reasonable category of goods than ‘rockets’ to explain this. Say buildings. I am actually in that business. The government buys a lot of buildings and building services. So does the private sector.
You want me to come work on your house and you will pay me $200 a day to get me to do that. The government wants work done on their buildings also and they are going to have to at least match what you offer to get me there instead of on your project. If the government suddenly decides to pay for Neil Wilson’s house project how does that change anything? I still want the $200 a day regardless of who is paying it.
I think it is simply because the child care fees are counted in the price index. The government paid the fees and cut that consumer price to zero, hence inflation declined. Inflationary effects of that extra spending was negligible, particularly in current conditions. The opposite effect – increasing inflation – was due to the administrative raise of tobacco prices. Bill’s point is that such purely administrative acts can affect inflation reports.
Thanks SG. I think that makes sense.
“You want me to come work on your house and you will pay me $200 a day to get me to do that. The government wants work done on their buildings also and they are going to have to at least match what you offer to get me there instead of on your project.”
Then they will refuse planning permission on my changes (and anybody else’s) until the government work is done. And then offer you $150. Now what’s your choice?
Or they tax everybody who is likely to run building projects hard so they don’t have the funds. Or they proscribe lenders so they can’t lend for building projects.
Or they start training up people to increase the supply of builders. Or open the immigration floodgates and bring in people from abroad (which is what happened in the IT industry when we all started billing silly money per day).
Government uses its coercive powers to make the resources the government wants to purchase unemployed in the currency of issue. Then that will encourage bids for the government’s money. With sufficient political power that means government can force the price of anything down to where it wants it to be. It tends not to do that overall because it is impractical, but it can.
See p114 of Warren’s Seven Deadly Innocent Frauds of Economic Policy.