It is a public holiday in Australia today celebrating our national day - the day…
Never trust a NAIRU estimate
It is Wednesday, so only some snippets today as I have deadlines and some travel to deal with. We have been finalising a Report on our latest estimates of the investment required to introduce a full-scale Job Guarantee in Australia. As part of that work, I have been going back through my NAIRU (Non-Accelerating Inflation Rate of Unemployment) estimates and updating data. I am also going to talk about that a bit in my presentation to the Economic Society of Australia tonight. That talk is about ultimately aimed at explaining the inflation fighting mechanisms inherent in the Job Guarantee, which is a centrepiece of Modern Monetary Theory (MMT). But to understand why that option is superior in efficiency terms, one has to know what the alternative buffer stock mechanism is. And that, of course, is the NAIRU orthodoxy. Also today, I am announcing some more detail about our plans to launch MMTed Q&A, as a weekly live program that will help people interested in our work to achieve better understandings. And some RIP style music with a suprising inflation result! Who could ask for more on a Wednesday. Tomorrow, the ABS release the Labour Force data and we will see how bad things have become in the Australian labour market over the month (more or less) just gone.
The aim of my talk tonight is as follows:
To discuss “flattening the Phillips Curve”, full employment, the role of price anchors and automatic stabilisers versus discretionary fiscal policy, how the ‘price rule’ of stimulus contrasts with the ‘quantity rule’ of conventional Keynesian pump-priming, and the choice between unemployed buffer stocks (the NAIRU) and employed buffer stocks (the NAIBER) in inflation management policy.
As I understand it all are welcome to join and you can book to join on-line – HERE.
The event starts at 18:00 (Australian Eastern Standard Time)
I have written about the NAIRU before and have done years of work on the topic:
1. My PhD thesis included a lot of technical work (theoretical and econometric) on the topic and buffer stocks.
2. In my 2008 book with Joan Muysken – Full Employment abandoned – we analysed the technical aspects of the NAIRU in detail.
3. Many refereed academic papers.
4. The following blog posts
(a) The NAIRU/Output gap scam reprise (February 27, 2019).
(b) The NAIRU/Output gap scam (February 26, 2019).
(c) No coherent evidence of a rising US NAIRU (December 10, 2013).
(d) Why we have to learn about the NAIRU (and reject it) (November 19, 2013).
(e) Why did unemployment and inflation fall in the 1990s? (October 3, 2013).
(f) NAIRU mantra prevents good macroeconomic policy (November 19, 2010).
(g) The dreaded NAIRU is still about! (April 6, 2009).
I don’t intend rehearsing the narratives in those blog posts again.
But here is an updated graph from 1960 to 2020 showing the old Australian Treasury TRYM estimates of the NAIRU, the current OECD estimates, and the actual unemployment rate.
The OECD data starts in 1985. The TRYM model was discontinued in 2011.
You can see the problem clearly without having to understand anything much.
If two agencies estimate the same concept that come up with the red and green lines, then something is amiss.
It turns out that lots is amiss.

While I won’t go into all the discussion that I covered in the blog posts referred to above, the following points are worth noting:
1. Proponents of the NAIRU as a useful policy construct have never explained the sudden jump from 1974 which coincided at the time with the rise in the actual unemployment rate.
The latter occurred as a result of the recession that followed the OPEC oil price hikes and was clearly understood in terms of a negative spending shock exacerbated by contractionary policy.
But conceptually shifts in the NAIRU have to be driven by shifts in microeconomic factors – the so-called structural factors, which are invariant to the economic cycle.
Why is that important?
Because if the structural factors (attitudes towards work, regulations such as minimum wages, income support levels, taxes, etc) fully determine the NAIRU and they are invariant to the economic cycle, which is driven by spending, then it would be difficult for the government to use expansionary fiscal policy to reduce the unemployment rate without incurring accelerating inflation.
That is exactly the notion that defined the entry of Monetarism and the Natural Rate Hypothesis (NRH) into their literature.
It is the causality that underpins their argument that there is only one unique unemployment rate consistent with stable inflation and fiscal policy adjustments (classic Keynesian policies) are unable to influence that rate and only cause inflation if the government tries to influence the level of unemployment.
The game is thus to accept that for given structural parameters, the unemployment rate where inflation stabilises is the ‘natural rate’ and if the government feels it is too high then they have to engage in structural changes which include reducing (scrapping minimum wages), reducing trade union bargaining power, cutting corporate taxation, increase the strength of activity tests for unemployment benefit recipients and even scrapping the benefit altogether.
You can see how the NAIRU is such a powerful pillar of the neoliberal deregulation agenda.
But, even if structural factors are determinant of the NAIRU, it remains the fact that if they are influenced in any way by the economic (spending) cycle, then the NAIRU becomes sensitive to government spending shifts and the whole Monetarist-NRH story crumbles.
That is what the concept of hysteresis was about. That was one of the things my PhD contributed – I was one of the first to develop that concept in the literature in the 1980s.
The idea is that structural shifts accompany cyclical shifts and so there is no determinant NAIRU and estimates of it will just follow the actual unemployment rate up and down in some lagged fashion depending on the econometric technique used to estimate it.
And, when one examines the alleged structural factors (proposed by proponents of the NAIRU concept) using all sorts of statistical and econometric tools – from simple linear regressions to advanced techniques (non-linear, filters, etc) the overwhelming result is that the structural variables, are, themselves, highly sensitive to the economic cycle.
Which means if the actual unemployment rate falls, the estimated NAIRU falls (and vice versa).
Which means that if governments stimulate the economy using fiscal policy and reduce the unemployment rate, they create their own non-inflationary space in the process.
Please read my blog posts:
(a) A Job Guarantee job creates the required extra productive capacity (October 2, 2013).
(b) Long-term unemployment – stats and myths (August 17, 2009).
2. The reliability of the NAIRU estimates are low (see below). The NAIRU is what we call an unobserved variable so it has to be estimated using proxy indicators.
The problem as I show below is that the usual statistical estimates are so imprecise – very large confidence intervals.
So we sometimes see estimates of between 4 and 12 per cent being within points of statistical indifference – meaning the estimates are useless for policy making.
3. We always see the pools of long-term and short-term unemployment being accessed by employers when there is strong enough employment growth, which means that there are no structural impediments to growth as a result of a large pool of long-term unemployment.
The so-called ‘irreversibility hypothesis’ claimed that the long-term unemployed require extensive re-training before they are ready for work.
Further, if the government tries to stimulate employment growth to reduce the long-term unemployment rate, the irreversibility properties will mean that wages growth will rise strongly as employers compete for skilled workers and ignore the long-term unemployed and inflation will result.
The long-term unemployed thus represent a constraint on non-inflationary growth and the only solution is to force them to upskill through various rules on their income support payments, including cancellation.
The proposition that there were structural impediments (and elevated NAIRUs) was the centrepiece of the OECD’s Jobs strategy in the 1990s that developed the idea of full employability and a focus on supply-side explanations for mass unemployment (lazy workers with poor attitudes that didn’t have skills, etc).
Like most of the mainstream dogma, the concept failed as soon as data was applied to it
4. What we end up with is the observation that the estimates of the NAIRU provided by agencies all around the world really just track the actual unemployment rate and provide no independent information upon which to base policy shifts.
We can get as good a NAIRU estimate using a moving-average filter of the actual unemployment rate. And, of course, that provides nothing new by way of information or theoretical rigour.
But the central bankers and treasuries around the world continue to plug away with attempts to estimate it.
The reason is that without it, they have no capacity to link activity (the real economy) with price movements (the nominal economy).
And without that, their antagonism to fiscal policy and their bias towards monetary policy as the principle counterstabilisation tool has no foundation.
In June 26, 2019, the RBA held a so-called ‘Teacher Immersion Event’ and a paper – Understanding the NAIRU – was presented.
These graphs were shown.
First, the changing NAIRU estimates relative to the actual unemployment rate.
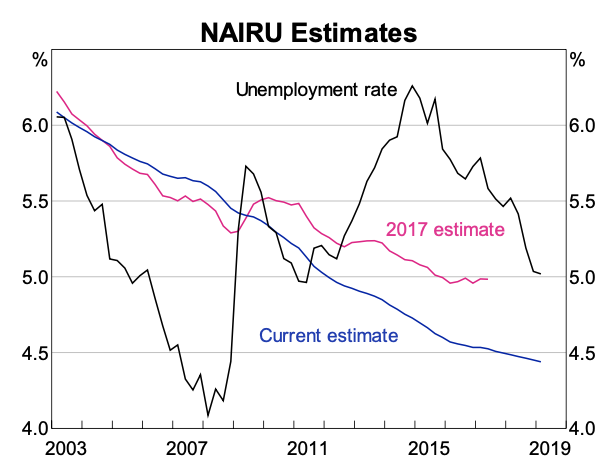
Second, the confidence intervals around the estimates from the early 1980s to 2019.
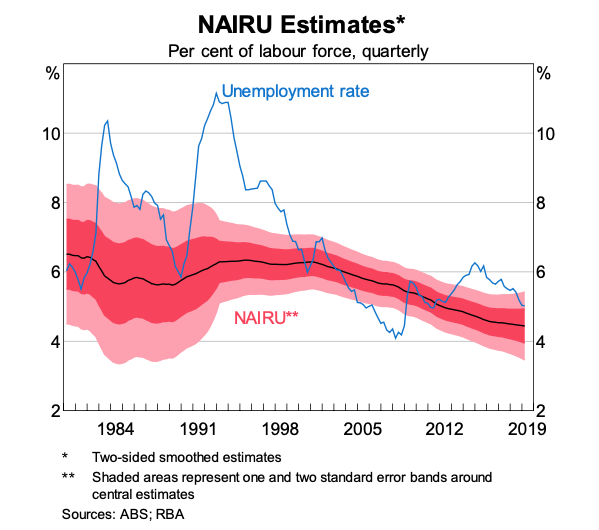
The general impression is that essentially, the NAIRU follows the unemployment rate with some lag.
There are high standard errors when the actual unemployment rate is moving about a lot.
And in 1997, the RBA published a Research Paper – Is the Phillips Curve A Curve? Some Evidence and Implications for Australia – which produced this graph (Figure 8).
It shows the confidence intervals around the estimates of the NAIRU between 1960 and 1997.
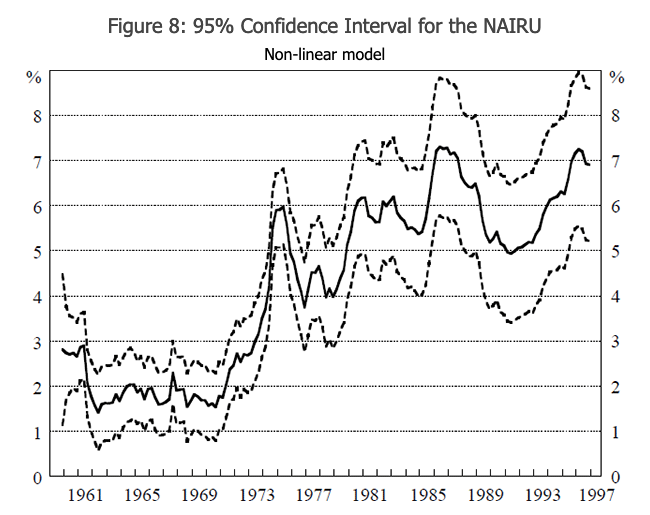
Summary: Huge and unusable as a precise policy tool.
According to that research one could be equally confident, in say 1985, that the steady-state unemployment rate was at 9 per cent or 4 per cent (about).
As this recent RBA research paper concluded (Source):
… the path of the NAIRU estimated now can look quite different to the path estimated at various times in the past, even using the same model and data history. The high degree of uncertainty around the NAIRU estimates means new data can change the estimate of the NAIRU for the previous few years …
Because of the uncertainty around the NAIRU, the estimates generated by incorporating new data each quarter can move around much more sharply than the estimates made with the benefit of hindsight and the full history of the data.
This – dynamic graph – from the RBA June Bulletin shows the evolution of different NAIRU estimates as the estimation sample changes.
The most recent NAIRU graph from the RBA with Confidence Intervals is this one. The intervals are still rather large even at low unemployment rates.
So given the actual unemployment rate in that year was 8.2 per cent, the Federal government should have introduced a massive fiscal stimulus to drive the unemployment rate down to 4 per cent, without fear that the inflation rate would rise.
Instead, they drove the fiscal deficit down from 2 per cent of GDP to 0.9 per cent of GDP and over the next two years, GDP growth slumped from 5.3 per cent in fiscal year 1984-85 to 2.5 per cent in 1986-87.
And the unemployment rate hovered above 8 per cent until the 1988, only to rise again above 10 per cent during the 1991-92 recession.
Usefulness of NAIRU estimates for policy: Zero!
MMTed Q&A
As part of the on-going development of our MMTed project, we are introducing – MMTed Q&A – which will be a weekly live program screening on Wednesday nights starting at 20:00 Australian EST.
This will be at:
10:00 Dakar
11:00 London
12:00 Paris
13:00 Helsinki
19:00 Tokyo, Kyoto and Dili
03:00 San Francisco
06:00 New York
The program will run for 30 minutes each week and the format will be around 5 questions will be answered with discussion.
Each week, we plan to bring in some of the MMT experts who can help answer your questions.
If you want to ask a question the process, as a trial, will be to submit your enquiry via the – MMTed Q&A – page.
We do not guarantee that your question will be answered but we will do our best.
Only submissions will valid E-mail addresses will be accepted.
The first program will be broadcast on Wednesday, May 20, 2020 at 20:00 Australian EST.
The links to the live stream each week will be published in advance on the site and via Twitter and on this blog site.
Let’s see how it turns out.
Call for MMTed Support
I imagine the current crisis will put a halt on people donating to causes.
But we are making progress in developing the program that will become – MMTed.
But we still need significant sponsors for this venture to ensure that we can run the educational program with negligible fees.
If you are able to help on an ongoing basis that would be great. But we will also appreciate of once-off and small donations as your circumstances permit.
You can contribute in one of two ways:
1. Via PayPal – which is our preferred vehicle for receiving donations.
The PayPal donation button is available via the MMTed Home Page or via the – Donation button – on the right-hand menu of this page (below the calendar).
2. Direct to MMTed’s Bank Account.
Please write to me to request account details.
Please help if you can.
We cannot make the MMTed project viable on a sustainable basis without funding support.
We will always maintain strict anonymity with respect to donations received, except if the donor desires to be publicly associated with the venture and gives their permission in writing to appear on the Donors Page.
Music – RIP Little Richard
Over the weekend just gone – Little Richard – died aged 87.
He was more than a pioneer of R&B and what followed. But, importantly, he forced white America to accept so-called ‘cross-over’ artists at a time when segregation was breaking down.
Here is a detailed report of his career from Rolling Stone – Little Richard, Founding Father of Rock Who Broke Musical Barriers, Dead at 87
The song – Lucille – is built on a driving riff, perfect tenor sax solo (from – Lee Allen, not too much flash piano jangling, Fender guitars and Little Richard.
This is from February 1957 – a glorious period of modern music – and this is my favourite Little Richard track.
The Everly Brothers recorded a rather sterile version on their “That’s Old Fashioned” album.
The Beatles recorded a version on their Live at the BBC “Pop Go The Beatles” Album (Volume 2) (recorded on September 17, 1963) – no match for the original.
Deep Purple used to play the song – poorly.
Many of my R&B bands in the past played to the song – obviously well (-:
I heard a live version of this from Leo de Castro at the Palais Theatre in St Kilda (Melbourne) when I was a teenager as a preliminary act to the release of D.A. Pennebaker’s film – Monterey Pop (1969). It was memorable.
The lead guitar player on this recording of Lucille was none other than – Roy Montrell – who was one of the defining forces in R&B. I learned a lot of licks listening to him playing.
The year before Little Richard released Lucille, Roy Montrell had recorded his own single – (Everytime I Hear) That Mellow Saxophone – watch that video and you will not stay seated for long.
A really defining sound from the late 1950s.
While Lee Allen played on Lucille, tenor on this recording was from – Alvin ‘Red’ Tyler – who was a premier R&B and then neo-bop sax player.
In October 1957, Little Richard performed in Newcastle, NSW (where I mostly live now but didn’t then).
While he was in town, he apparently decided to reaffirm his “commitment to God”, while “aboard the Stockton ferry”, which runs daily across the harbour (Source).
Apparently, as an expression of this renewal, he threw his rings into the harbour water and cancelled the second scheduled concert.
The story is somewhat blurred and alternative versions have him throwing them from a train as it went over Carrington Bridge (across the Hunter River which flows into the Harbour).
Here is a advertisement from the Newcastle concert.
All the R&B – Rock’n’Roll stars emerging were on the bill.
Note the ticket price – 10 shillings (before Australia went decimal).
What would that be worth now? About $A16.20. Pretty cheap for a concert given that you don’t get a ticket for under $A100 these days to a major concert.

That is enough for today!
(c) Copyright 2020 William Mitchell. All Rights Reserved.
I have this quote from a speech by the assistant governor of the RBA last year:
“Could we look back in a few years and realise that the NAIRU is even lower than we thought today? There’s no way to know for sure until we get there, but I can’t rule it out. And if that turns out to be the case, that would be an excellent outcome. It would mean that more people were in jobs.”
No mention of those that went without jobs thanks to restricted fiscal policy informed by their NAIRU estimates..
“Further, if the government tries to stimulate employment growth to reduce the long-term unemployment rate, the irreversibility properties will mean that wages growth will rise strongly as employers compete for skilled workers and ignore the long-term unemployed and inflation will result.”
If there is competition for skilled workers and there are prices rises, then doesn’t that just say there is insufficient competition in the product/service market the firm is operating in? In other words inflation of any sort is an indicator of insufficient competition, ie a monopoly situation arising. (Possibly due to firms dying from competitive pressures)
Firms can’t just hike their prices and expect people to swallow them unless there is no quantity competition in the market place to force the price back down again.
Would it be beneficial to point out that inflation indicates a failure of the competitive market? A failure of competitive pressure to drive productivity and quantity expansion. And therefore an indication that profit seeking in that market segment no longer serves any purpose.
Driving too much money into an area needs to cause all the firms in that area to go bust so whoever drove the circulation beyond the productive limit pays the price. How do we design something to bring that about?
What would a systemic threat of “prices rises mean you will be broken up” help?
Dear Neil,
One of the main components of costs are wages and firms apply markup on top of the costs. If workers are able to bid for higher (real) wages and firms are targeting the same (real) rate of profit, an inflationary spiral may develop. This is an emergent phenomenon.
If the labour market (or a significant segment of it) is close to full employment, quantity competition is constrained by the amount of labour available.
I like to look at French Productivity who have strong Labour laws and union protection that are currently being dismantled by Macron.
You would think they would make the French more productive and they do, but not by as much as you would think they would when you compare them with the UK and Germany for example. Who have had these protections dismantled already.
I suppose strong labour laws also keeps a lot of “deadwood” in the system that should have been flushed out and been allowed to die as various businesses no longer know how to compete.
Surely getting the balance right is key and the JG will help to do that.
Unfortunately the booking form requires an Australian address, so I am unable to register. Will the session be recorded and posted elsewhere afterwards for interested parties who reside outside of “the lucky country”?
” firms apply markup on top of the costs”
They don’t. They apply a markup on top of the costs, then try to sell at that price. And they may get no takers. Which forces a re-evaluation of the markup. Or they may have already got a price in the market and do no wish to move that price because they are scared of losing market share.
“Apply a markup on costs” is overly simplistic. That’s not how firms on the ground actually work, nor is it how competition needs to work if it is to be effective. Markups requests are tempered by market action.
“quantity competition is constrained by the amount of labour available.”
By definition it isn’t in this case. Not only is there overtime available because nothing is ever run at full capacity, but there are other labour options. It is constrained by the refusal of the firm or firms to think outside the box and which should therefore lead to its demise to be replaced by a superior operation.
That’s the trouble with economic “received wisdom”. It’s utterly devoid of any “and how does that work in reality” checks.
“I heard a live version of this from Leo de Castro at the Palais Theatre in St Kilda ”
I haven’t heard that name for 50 bloody years.
https://www.youtube.com/watch?v=s8FwbYHE1n8
Not the Palais but GTK – where else.
You also need a competition authority with some real teeth. Not poachers that have become gatekeepers Somebody who is willing to throw the book at them.
A newly created division of the police force sent away to study economics at a MMT university.
Just look at the price gouging by banks during the virus. Loans that should never have been loans in the first place.
We need something in place that they are scared of.
Dear Neil,
I think that Post-Keynesian pricing theory (based on Marxian and Sraffian foundations) is quite well supported by econometric data. What you have mentioned suggests a more neoclassical behaviour, even if a few individual firms might have behaved like you said, on average there are sectors where they don’t.
There are nice graphs of available on a the internet. We can just search for “S&P 500 Sectors & Industries Profit Margins (quarterly)” Except for the GFC period, profit margins within various industries remain quite stable, with a long-term rising trend only recently shattered by the corona crisis (what BTW goes against simplistic reading of Marx). There are obviously a few industries showing high volatility in operating profit margins such as the energy industry. (operating profit margins are linked with markups)
“it [is] how competition needs to work if it is to be effective” – I am sorry this is wishful thinking and true neoclassical “received wisdom” I do not subscribe to. One can’t make the current system, poisoned by systemic underemployment, job insecurity and full of leeches such as Uber and Amazon, work for the majority of humans even if it works OK for a few members of the middle class. The fact that I cannot complain about my personal situation as an IT worker does not blind me to the suffering of other people and to the systemic collapse unfolding around us. As stated yesterday, the coronavirus is the trigger but Western capitalism collapses under its own weight.
It seems to me that inflation needs to have some kind of imbalance between demand and supply. The most common hyper inflation problems are related to negative supply shocks is what I’ve seen. Any hyper inflation not started/preceded by a supply shock?
It seems as well that making a 2 types of demand/supply behaviour. The “need to buy/sell immediately” (type A) and the ability to wait for the “right” price to buy/sell (type B). Seems like hyper inflation will occur in a market with type B sellers and type A buyers. The seller price gouges and the buyer just puts up with it. example is food retailers hiking prices as people stock up for isolation (“panic buy”).
We had deflation in oil prices because of type A sellers and type B buyers in that market. And we have everyone wondering if housing market will have an increase in type A sellers dragging down prices.
I wonder if this sort of thing is accounted for this or not in the nairu modelling?
Seems like a general strategy for inflation would be aiming to make a large portion of markets contain mostly “type B” buyers and sellers.
Bill. What does NAIBER stand for?
Of Course NAIRU is just the institutionalization , a form of expression, that the prime economic hazard is the wants, desires, greed and selfishness of working people. And this hazard is held in abeyance by their abuse. The greed and selfishness of the wealthy and the powerful are not conceptualized.
What does NAIBER stand for?
Non-Accelerating Inflation Buffer Employment Ratio (NAIBER) is the BER that results in stable inflation via the redistribution of workers from the inflating private sector to the fixed price JG sector.
( search naiber site:http://bilbo.economicoutlook.net)
“https://www.youtube.com/watch?v=s8FwbYHE1n8”
Fascinated by this performance.
Some licks in the guitar break at the end are very reminiscent of Clapton’s driving guitar in the live Winterland recording of Crossroads. Even the bass has touches of Bruce’s thumping rolling playing.
If you start from a premise of a super efficient price mechanism you end up with
NAIRU like nonsense.
The irony of course is the victory of monetarism [as supply side reformers once used to be described]
came on the back of the inevitable inflation caused by quadrupling oil prices nothing to do with
unemployment levels at all.