Last week, I considered recent research published by the BIS - Bank of International Settlements…
JobKeeper wage subsidy – some strange arithmetic is afoot
It is Wednesday so music and some snippets. I have updated the US unemployment claims data with a new map and state table. Shocking. We are working on updated estimates of what the Australian government would need to invest to run a Job Guarantee. We haven’t done that for a while because I didn’t want the press to get obsessed with dollar amounts. But as I am currently talking a lot about the Job Guarantee in the media, I thought some numbers would be useful as a comparative exercise against the JobKeeper wage subsidy, which is the central stimulus plank of the Australian government. The current estimates suggest that to create around 685 thousand jobs might require an outlay of $34 billion over the course of a year. That got me thinking. The main response of the Australian government is the $A133 billion over 6 months JobKeeper wage subsidy scheme. The Treasury claims it will be the difference between an unemployment rate of 10 per cent and 15 per cent. That difference is 685 thousand jobs. Then start doing some division and multiplication and you start to see that this doesn’t make sense as I explain below.
Strange arithmetic – Australia’s JobKeeper wage subsidy
We are working on updated estimates of what the Australian government would need to invest to run a Job Guarantee. We haven’t done that for a while because I didn’t want the press to get obsessed with dollar amounts.
After all, as I have said often, the ‘cost’ of a public policy program is not the numbers that come out in government financial statements under ‘outlays’. The cost is the extra real resources that are consumed as a result of the program.
But as I am currently talking a lot about the Job Guarantee in the media, I thought some numbers would be useful as a comparative exercise against the JobKeeper wage subsidy, which is the central stimulus plank of the Australian government.
Well when I started digging things started to look pretty strange.
Here are some facts:
1. When the Treasurer announced the JobKeeper initiative on April 14, 2020 – Jobkeeper payment supporting millions of jobs – he said:
Given these actions and the position of economic strength from which we approached the coronavirus crisis Treasury expects the unemployment rate to rise to 10 per cent in the June quarter from 5.1 per cent in the most recent data.
In the absence of the $130 billion JobKeeper payment, Treasury estimates the unemployment rate would be 5 percentage points higher and would peak at around 15 per cent.
More than 800,000 businesses have already registered for the JobKeeper payment which will allow the economy to recover more quickly once we are through to the other side of the crisis.
I was immediately suspicious.
Why?
By their own statements, the JobKeeper is the difference between a 10 per cent unemployment rate and a 15 per cent rate.
5 per cent of the current labour force is equal to 686.8 thousand jobs – not millions.
But then I thought about it.
2. The announced injection is $A133 billion.
The wage subsidy is a $A1,500 fortnightly payment “per eligible employee until 27 September 2020”. Firms have to pass the full amount on per worker and meet all other employment costs outside of the scheme.
Okay, so each worker gets $A1,500 per fortnight.
The specifics of who is eligible etc is one thing. I discussed my antagonism to the scheme in this blog post – The government should pay the workers 100 per cent, not rely on wage subsidies (March 31 , 2020).
Those criticisms remain but are not the point I am making here.
So if the outlay of $A133 billion is to protect 685 thousand jobs, that means $A193,651 per job protected, yet the workers are only getting $750 a week for 6 months.
A worker receiving the subsidy will get $A18,000 over the course of the scheme as long as the employer keeps them on.
Okay, that would imply 7,388,889 workers are being funded if the full $A133 billion was taken up. The March 2020 labour force was 13,736.2 thousand.
Which would mean that the JobKeeper was protecting something around 54 per cent of the labour force.
Which would mean the Treasury estimates that the JobKeeper would be the difference between a 10 per cent unemployment rate and a 15 per cent rate doesn’t make sense.
3. Then there are those 800,000 businesses the Treasurer claims have registered. Even if they employed just one person that would be more than 686.8 thousand.
And if the 7.3 million figure was correct, then they would on average be claiming for 9 workers. That sounds too many.
4. Then we hear – in Senate Estimates yesterday – that only 540,000 firms have enrolled in the scheme covering 3.3 million workers. See JobKeeper payments start next week, but hundreds of thousands of businesses hit by coronavirus aren’t signed up.
More confounding statistics.
Conclusion: I have written to Treasury to request their analysis. They have not released it publicly. I am waiting – probably in vain. Next step will be an FOI request. I would expect lots of blacked out sheets from that.
The points are:
1. Our Job Guarantee estimates so far, which I will release when we have double-triple and more checked them, suggest that the government needs to invest about $A34 billion to create 685 thousand jobs at minimum wage – which is close to the JobKeeper subsidy.
$A34 billion is a lot less than $A133 billion.
If we are right, then something is awfully wrong with the JobKeeper arithmetic and the statements the Treasurer has been making about it.
2. If businesses are not taking up the JobKeeper program – as today’s reports suggest – then the government will not go close to spending the $A133 billion.
Which means the stimulus will be much lower than suggested and the consequences will be very bad for Australia.
As my previous writing on the subject suggest, the stimulus is only about a half of what I think is required.
The latest data suggests it is even worse than that.
So I am waiting for the Treasury to enlighten me. As it stands, the $A133 billion figure does not make sense given other statements the Treasury have been making about the scheme.
US update to April 18, 2020
Here is the latest update (as for the week ending April 18, 2020) from the US Department of Labor’s weekly data releases for the unemployment insurance claimants.
I first started tracking this data for this downturn in my last commentary on the monthly US labour market data release – Tip of the iceberg – the US labour market catastrophe now playing out (April 6, 2020).
The Department of Labor provides an archive of the weekly unemployment insurance claims data back to July 1, 1967 – HERE.
The weekly data can be found in the – UI Weekly Claims Report.
Bringing together the archived data and the most recent release (April 18, 2020), the following table tells the shocking story.
| Week ending | Initial Claims (SA) | Weekly Change | Cumulative sum since March 7, 2020 |
| March 7, 2020 | 211,000 | -6,000 | n/a |
| March 14, 2020 | 282,000 | +71,000 | 282,000 |
| March 21, 2020 | 3,307,000 | +3,025,000 | 3,589,000 |
| March 28, 2020 | 6,687,000 | +3,560,000 | 10,456,000 |
| April 4, 2020 | 6,615,000 | -252,000 | 17,071,000 |
| April 11, 2020 | 5,237,000 | -1,378,000 | 22,308,000 |
| April 18, 2020 | 4,427,000 | -810,000 | 26,453,000 |
If we assume all those new claimants were unemployed then the unemployment level by mid-April would have been around 32,522 thousand which would mean that the unemployment rate would have been 19.9 per cent compared to the BLS March figure (taken up to March 10) of 4.4 per cent.
So within a month and a bit, the unemployment rate has probably jumped from 4.4 per cent to 20 per cent (give or take).
That is a shocking deterioration.
The peak unemployment rate during the Great Depression was 24.9 per cent in 1933, before the New Deal brought it down somewhat.
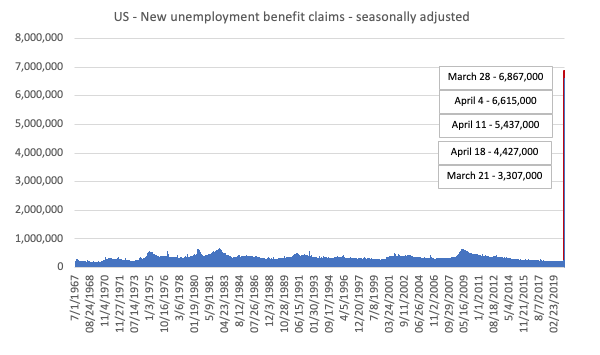
The next graph show the full sample to (week-ending April 18, 2020).
The spike at the end of the graph shows how drastic the situation is in the US.
This is a quite extraordinary graph.
Last week, I also provided some spatial analysis – US downturn very harmful to low wage workers and their communities (April 14, 2020).
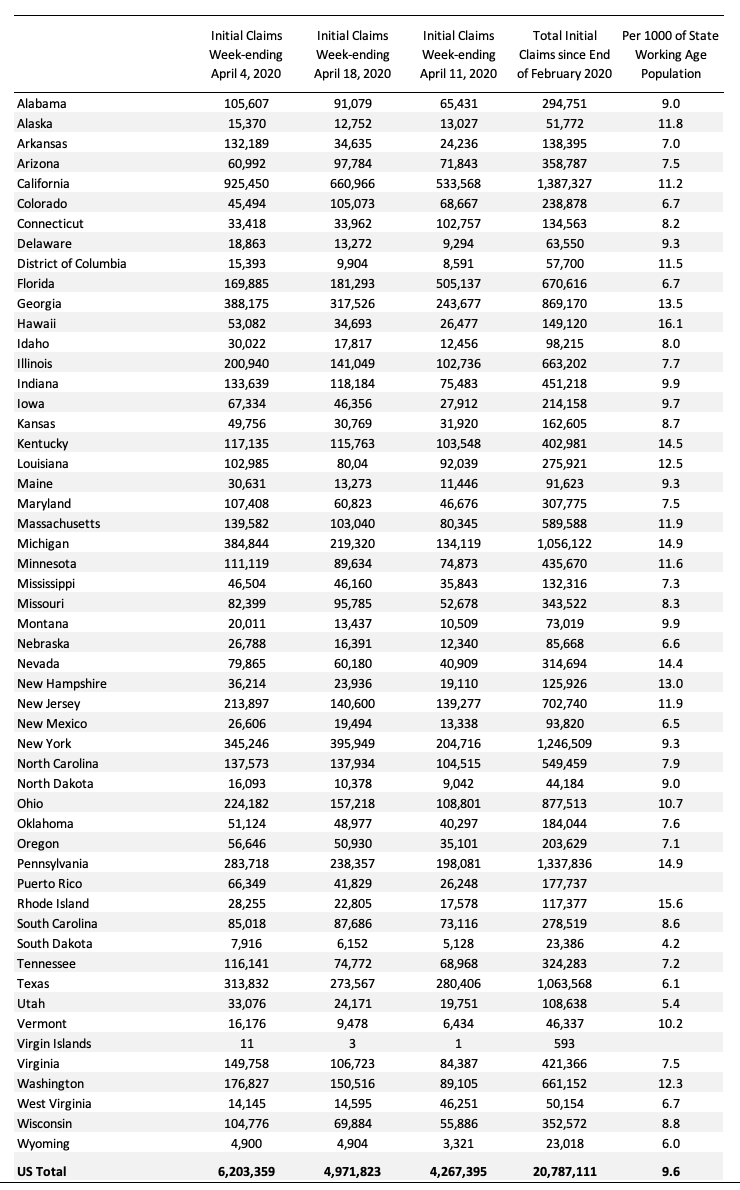
In the Department of Labor report cited above, we saw there were sharp differences in initial claimants across the US states.
The next map shows the cumulative sum of unemployment insurance claimants since the end of February 2020, expressed as a percentage of the Working Age Population in each state (Alaska was 11.8 per cent and Hawaii was 16.1 per cent).
This graph more starkly demonstrates where the loss of jobs is impacting most significantly. You can compare this map with the map I produced last week to see where the virus job losses are having shifting impacts.

The following Table presents the same data for those who prefer numbers.
Call for MMTed Support
I imagine the current crisis will put a halt on people donating to causes.
But we are making progress in developing the program that will become – MMTed.
I ran my first Masterclass in London recently and it was well attended. I received good (useful) feedback from several people which will help tune the way we run these face to face classes.
The planned further Masterclasses (May in Australia, June in Europe, September in the US) are on hold while we assess the state of the world. But I hope we will be able to offer them sometime this year.
And on-line curricula is being developed.
But we still need significant sponsors for this venture to ensure that we can run the educational program with negligible fees.
If you are able to help on an ongoing basis that would be great. But we will also be appreciate of once-off and small donations as your
You can contribute in one of three two ways:
1. Via PayPal – which is our preferred vehicle for receiving donations.
The PayPal donation button is available via the MMTed Home Page or via the – Donation button – on the right-hand menu of this page (below the calendar).
2. Direct to MMTed’s Bank Account.
Please write to me to request account details.
Please help if you can.
We cannot make the MMTed project viable on a sustainable basis without funding support.
We will always maintain strict anonymity with respect to donations received, except if the donor desires to be publicly associated with the venture and gives their permission in writing to appear on the Donors Page.
Thanks to all who have kindly donated to date.
An announcement is forthcoming.
Shuggie Otis – one of my favourites
Johnny Otis – was one of the great blues, R&B musicians, vibrophone player, keyboard player, drummer, bandleader, composer – he did it all.
He was referred to as the “Godfather of Rhythm and Blues.” He is credited with ‘discovering’ the marvellous Etta James as a 13-year phenomenon.
Shuggie Otis – was one of his sons and also does it all. In the early 1970s he put out three wonderful albums, which most people will never have heard but are among my real favourites and are on my iPhone wherever I go.
As it goes, the music press called him the ‘heir’ to Jimi Hendrix. His guitar playing was phenomenal, which is where I became interested in his work in the early 1970s.
He was to be the gap between Stevie Wonder and Prince. The Rolling Stones invited him to join to replace Brian Jones.
In addition to putting out his own albums, upon which he played most of the instruments, he also played (as a teenager) on Kooper Session – with Al Kooper and – Hot Rats – with Frank Zappa.
His most famous song – Strawberry Letter 23 – was on his second album – Freedom Flight (1971) – was a bit hit for – The Brothers Johnson and produced by Quincy Jones. Here is a link to remind you what was happening in 1977 as disco started taking over. Obviously, I preferred the original.
Shuggie Otis’s third album is the best in my view – Inspiration Information – and it was released in 1974. A short album (31:38) but full of classics.
This is a great song from that album – Aht Uh Mi Hed.
Shuggie Otis hasn’t had an easy life – the usual issues. But I saw him a few years ago playing live again and he is still a masterful guitar player. Pity the drugs and drink got in the road when his star was really shining.
‘Heir to Hendrix’ Shuggie Otis: ‘I could have been a millionaire, but that wasn’t on my mind’ (April 16, 2016) is a contemporary discussion of Shuggie Otis.
That is enough for today!
(c) Copyright 2020 William Mitchell. All Rights Reserved.
Richard Dennis from the Australia Institute did a Q&A via zoom with Jim Chalmers (Aus. Treasurer) this morning . Archived at their site they said.
He got quite testy late on when MMT was raised in the chat, saying it’s not important to name or even know about theory as, paraphrasing, “I don’t know the theory behind how my iPad works but I use it all the time.” He went on to say that debt doesn’t matter because we will never have to pay it off.
I think this is naive and politically dangerous to advance fiscal expansion without an MMT ‘lens’ as it will still leave you open to a scare campaign from the debt cultists.
Interestingly in this discussion and one last week held by Essential media (Labor/union PR company) moderators went to lengths to shield Chalmers from having to discuss MMT in any way.
Dear Dan Murphy,
Jim Chalmers is a shadow treasurer not the “proper” one, that is he wants to be the treasurer should the Labor win the elections in 2031 and he is still alive then. I don’t think his views are relevant at the moment. I did not bother watching. But tomorrow there is a similar session with Joseph Stiglitz and Wayne Swan which I want to watch, even if I am very critical of Swan’s approach to the housing market when he was the treasurer during the GFC and his premature withdrawal of the fiscal stimulus. But I think that Stiglitz is a very wise person, who has contributed a lot even if he sometimes speaks “New-Keynesian”.
I am retired to the north of Thailand, 50km from the nearest city. I have been to that city twice since the virus started and will go again this weekend to grocery shop.
Therefore, I have not seen the situation in the US.
I’d like to make some comments related to the economic impact of covid-19.
1] AFAIK, covid-19 is worse than seasonal flu. Much worse. It spreads faster, it hides for many days, and it kills many more.
2] The US was totally unprepared.
. . . a] It did not have enough masks.
. . . b] The experts were not ready with a plan for ho the people themselves could make “good enough” masks in a few hours. For example cut up T-shirts and double or triple them, or whatever the experts knew would work.
. . . c] The plan in place was not followed. This despite at least some experts predicting this sort of virus 20 years ago would someday be a problem.
. . . . . [BTW — I take special note of the fact that this “someday” was not taken seriously by the Gov., but in economics there are a few “somedays” that scare the stuffing out of Gov. so it keeps deficits low that hurts the mass of the people.]
3] Closing the borders was the right thing to do.
4] An emergency business shutdown was the right thing to do, for a week or so.
5] During that week the Gov. should have flooded the airwaves with PSA that explained what people needed to know.
. . . a] How to make face masks for yourself.
. . . b] How to social distance.
. . . c] What sorts of business can be opened soon. Like baseball games (they’re outdoors) seem fine to this non-expert IF EVERYONE HAS A MASK ON, and nobody eats things. {Drinking thru a straw around the mask seems OK.} Restaurants are not OK, there is no way to eat with a mask on, until a mask for this in invented and produced. Outdoor bars seem OK, if everyone drinks thru a straw.
6] So, in the US they should open many business as soon as people can make homemade masks that are good enough. The “covid-19 police” should go after *every* person who is not wearing a mask in public. Exceptions are: in your home and in your car with the windows closed and AC on, etc. The “covid-19 police” should have a supply of homemade masks to give to those without one while they are take home, no exceptions, except an emergency trip to the hospital.
Here in Thailand restaurants are closed, but most businesses are still open. Construction is booming.
I predict that the US Gov. will let the mass of the people be devastated economically WHILE being sure that the 1% make huge net profits.
PS to my post
Thailand had enough masks for everyone.
Bill, I come up with 6,666,667 workers to absorb $130B over 6 months. For the u/r top to have been 15%, treasury must have assumed that huge amounts of people fell out of the jobs market completely. Can’t see why most wouldn’t have applied for JobSeeker and stayed in the loop.
Treasury has a history of horrendous modelling…
Random thoughts:
-Dennis is capable of writing good stuff; his piece in TSP a few weeks back was very good, IMO, though stepped around deficits, which was not strictly within the topic.
-I don’t know why they get so tetchy; partly, I suspect, it’s (male, usually) ego, though Emma D is another who needs to be mollycoddled into talking around the topic
-some of this is to do with some stridency on the part of some MMT advocates; and I think Steven H is particularly mindful of this. I’ve tried to take this on board. I now rarely place #MMT in, say, Tweets, or even name it at all, if I think I can get across the new paradigm without them. It acts as an attractor to MMT-phobic progressives
-Hot Rats is one of my all time favourite albums. When I bought it on release in the 70s (still have the vinyl, but a re-issue CD as well), I knew it was special; I just hadn’t sussed *how special. Some of the anthemic jazz/rock hybrid hooks can hang in your head a long time once recalled. Also makes me wonder why saxophone has not held a higher profile in the better end of rock over the decades.
The chart that shows the unemployment claims by state over the past few weeks includes “Per 1,000” in the far right column. Seems like this is actually a percentage based on the population of each state (i.e. per 100).
Dan Murphy,
I have had a few ‘big names’ of left-wing this tanks get ‘testy’ when I ask MMT based questions, sometimes to the point they choose to mock or insult rather than answer the question.
The thing with JobKeeper is that it is limited to business that have a reduced revenue of 30%. The business I work for had a reduced revenue of 25% in March, so wasn’t eligible for that month.
So that 15% to 10% unemployment figure touted must be based on estimates of business that would go bust if they have a reduction of 30% revenue, over the months of the Jobkeeper program. Which, as far as I know, can be estimated about as accurately as the NAIRU.
Bill. For years I’ve been keeping track of initial claims; year on year percent change, which is usually in the single digits, sometimes under stress to 15% area. Last month it was 1300%.
Re: JobKeeper wage subsidy – some strange arithmetic is afoot
Thanks for the analysis, Not an expert on this but an explanation for this discrepancy may be that employers can if they qualify use Job keepers to pay employees who would not necessarily have been laid off without the subsidy, The $34B you calculate is for employees who would have been made unemployed and hence contributed to the additional 5% unemployment. The remaining $99B is presumable a subsidy for employers who use the Job Keepers subsidy to pay employees they would not actually lay off if they didn’t get it. So effectively its a big transfer of money to business (equivalent to a business tax cut or grant), but dressed up in a way that makes it sound like its all going to workers to make it more politically palatable to everyday people. Just sounds like typical crony capitalism to me.