The recent extreme weather in the northern hemisphere, the twin monster tropical storms in Japan,…
Tip of the iceberg – the US labour market catastrophe now playing out
On April 3, 2020, the US Bureau of Labor Statistics (BLS) released their latest labour market data – Employment Situation Summary – March 2020 – which shows a deteriorating labour market situation due to the coronavirus crisis. However, as I explain below, the data released was drawn from samples that went up to March 12 (establishment survey) and March 14 (household survey), and so doesn’t fully capture the extent of the unfolding catastrophe. More recent data released by the US Department of Labor (unemployment insurance claimant data) doesn’t leave anything to doubt. In the last two weeks of March 2020, 9.955 million workers registered unemployment insurance claims (6.6 million in the last week). If we consider that shift, then the US unemployment rate would be around 9.8 per cent by the end of march and rising. All the aggregates are demonstrating dramatic shifts. The employment-population rate fell by 1.1 points to 60 per cent, which is the largest monthly fall since the sample began in January 1948. The U6 measure of broad labour underutilisation increased by 1.7 points to 8.7 per cent. This is the largest monthly rise in this measure since it was first published in January 1994. The situation will get worse.
Overview for March 2020:
- Payroll employment fell by 701,000 – a sharp fall.
- Total labour force survey employment fell by 2,987 thousand (net).
- The seasonally adjusted labour force fell by 1,633 thousand (as participation fell).
- Official unemployment rose by 1,353 thousand to 7,140 thousand (but see below for commentary on latest data)
- The official unemployment rate rose from 3.5 to 4.4 per cent. But the actual March figure is close to 10 per cent (see below).
- The participation rate plunged by 0.7 points to 62.7 per cent. Adjusting the unemployment rate for the change in hidden unemployment would generate an unemployment rate of 5.4 per cent rather than 4.4. per cent.
- The broad labour underutilisation measure (U6) rose sharply by 1.7 points to 8.7 per cent because of a rise in the number in the part-time for economic reasons cohort (the US indicator of underemployment) and a rise in other marginal categories.
For those who are confused about the difference between the payroll (establishment) data and the household survey data you should read this blog post – US labour market is in a deplorable state – where I explain the differences in detail.
The catastrophic impacts of the health crisis – so far
The BLS provided a special explanatory note “Coronavirus (COVID-19) Impact on March 2020, Establishment and Household Survey Data” with their April 2020 labour market release.
We learned that the survey week – when the household survey was conducted ran from March 8 to March 14, 2020. This is when the unemployment estimates are derived.
The payroll employment data is derived from an establishment survey that spans “the pay period including the 12th of the month”.
Further, the conduct of both surveys was impacted by the virus. The labour force data (household survey) was exclusively conducted by telephone, which reduced the “response rate” to “73 percent … about 10 percentage points lower than in recent months”.
The BLS tell us in this – Technical Note – that:
At an unemployment rate of around 6.0 percent, the 90-percent confidence interval for the monthly change in unemployment as measured by the household survey is about +/- 300,000, and for the monthly change in the unemployment rate it is about +/- 0.2 percentage point.
So there is sampling error, which may have been larger than usual as a result of the reduced response rate.
However, the BLS also note that given the sample survey week ended on March 14, 2020:
We cannot precisely quantify the effects of the pandemic on the job market in March. However, it is clear that the decrease in employment and hours and the increase in unemployment can be ascribed to effects of the illness and efforts to contain the virus. It is important to keep in mind that the March survey reference periods for both surveys predated many coronavirus-related business and school closures in the second half of the month.
Already, up to March 14, 2020, there was an:
1. “extremely large increase in the number of persons classified as unemployed on temporary layoff.”
2. “there was also a large increase in the number of workers who were classified as employed but absent from work.”
The BLS instructed the interview team to count those employment but absent as “unemployed on temporary layoff”.
But they admit that:
… it is apparent that not all such workers were so classified. Such a misclassification is an example of nonsampling error and can occur when respondents misunderstand questions or interviewers record answers incorrectly.
What does that mean?
It means that the “the overall unemployment rate would have been almost 1 percentage point higher than reported.”
However, the BLS reports the data “as recorded”, which means they are above accusations of manipulating the data for political or other reasons.
So we know the unemployment situation is worse than reported in the official March data and this will be more clearly revealed in the April figures (released early May).
But we can speculate using the US Department of Labor’s Unemployment Insurance claims data, which is released on a weekly basis.
The Department of Labor provides an archive of the weekly unemployment insurance claims data back to July 1, 1967 – HERE.
The last two weeks data can be found in the – UI Weekly Claims Report.
The following reality emerges.
The Department of Labor reports that:
In the week ending March 28, the advance figure for seasonally adjusted initial claims was 6,648,000, an increase of 3,341,000 from the previous week’s revised level. This marks the highest level of seasonally adjusted initial claims in the history of the seasonally adjusted series.
Bringing together the archived data and the most recent release, the following table tells the shocking story.
| Week ending | Initial Claims (SA) | Weekly Change | 4-Week Moving Average (SA) |
| March 7, 2020 | 211,000 | -6,000 | 161,500 |
| March 14, 2020 | 282,000 | +71,000 | 232,500 |
| March 21, 2020 | 3,307,000 | +3,025,000 | 1,004,250 |
| March 28, 2020 | 6,648,000 | +3,341,000 | 2,612,000 |
If we assume all those new claimants were unemployed then the unemployment level by the end of March would be 16,024 thousand instead of the BLS estimate (take up to the end of the survey week – March 14) of 7,140.
This would mean that the unemployment rate would be 9.8 per cent by the end of March rather than the official BLS March figure of 4.4 per cent.
The peak unemployment rate during the Great Depression was 24.9 per cent in 1933, before the New Deal brought it down somewhat.
The next two graph show the extraordinary nature of the current period.
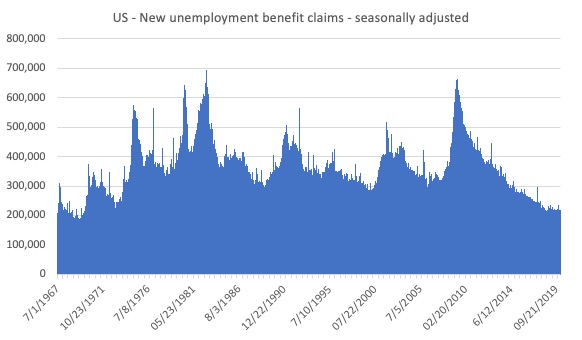
The first graph shows new weekly claimants for unemployment benefits from July 1, 1967 to the week-ending March 13, 2020 (that is two weeks ago).
You can see the big cycles in the US labour market – the mid-1970s downturn, the recessions in the early 1980s, the early 1990s recession, the early 2000s and then the GFC.
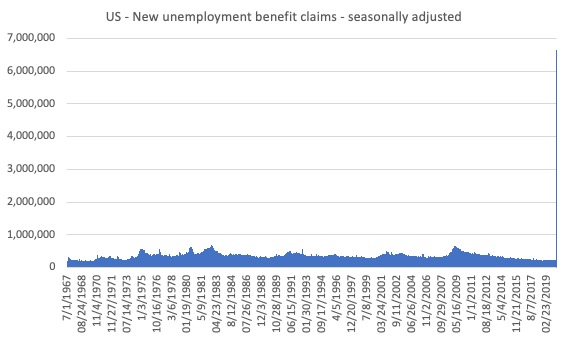
The next graph adds the last two weeks of available data (week-ending March 21 and March 28) to the entire sample.
The spike at the end of the graph shows how drastic the situation is in the US.
As a researcher who has dealt with time-series data all my career, I have never seen anything quite that stark in a dataset.
Payroll employment trends
The BLS noted that:
Total nonfarm payroll employment fell sharply in March (-701,000), reflecting the effects of the coronavirus and efforts to contain it. About two-thirds of the drop occurred in leisure and hospitality, mainly in food services and drinking places. Notable employment declines also occurred in health care and social assistance, professional and business services, retail trade, and construction. In the prior 12 months, nonfarm employment growth had averaged 196,000 per month.
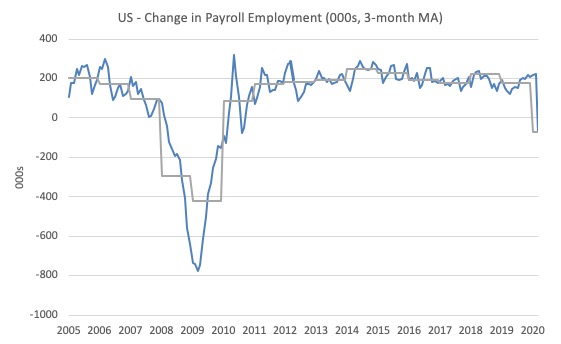
The first graph shows the monthly change in payroll employment (in thousands, expressed as a 3-month moving average to take out the monthly noise). The gray lines are the annual averages.
This month saw the rapid fall in payroll employment – which really blows out any comparison with past performance.
For the time being, this sort of plunge will be the norm.
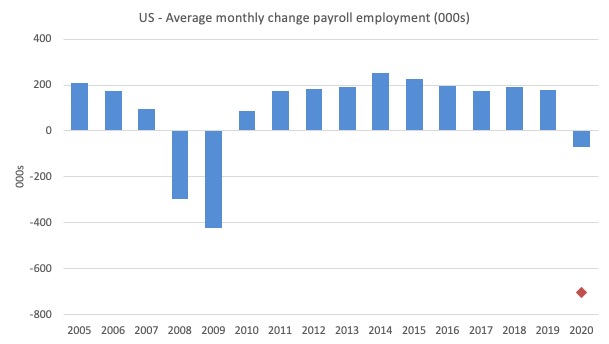
The next graph shows the same data in a different way – in this case the graph shows the average net monthly change in payroll employment (actual) for the calendar years from 2005 to 2020 (the 2020 average obviously is just the January result).
The red diamond is the current month’s observation.
The slowdown that began in 2015 continued through 2017 was reversed last year. The 2018 average was 223 thousand compared to 179 thousand in 2017.
The final average for 2019 was 178 thousand.
While it looked like 2020 was started well in terms of quantity of jobs, a rise in the average rise for the first two months, the March result has changed things dramatically.
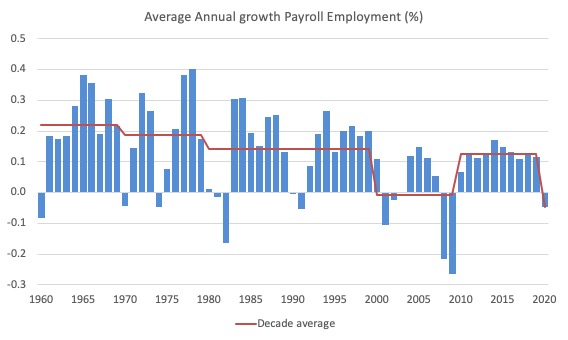
To put the current recovery into historical perspective the following graph shows the average annual growth in payroll employment since 1960 (blue columns) with the decade averages shown by the red line.
It reinforces the view that while payroll employment growth has been steady since the GFC ended, it was still well down on previous decades of growth before the latest crisis hit.
Labour Force Survey – employment growth collapses
The BLS report that:
In March, the unemployment rate increased by 0.9 percentage point to 4.4 percent. This is the largest over-the-month increase in the rate since January 1975, when the increase was also 0.9 percentage point. The number of unemployed persons rose by 1.4 million to 7.1 million in March. The sharp increases in these measures reflect the effects of the coronavirus and efforts to contain it.
The data for March is staggering:
Employment as measured by the household survey fell by 2,987 thousand net (-1.88 per cent) while the labour force declined by 1,633 thousand (-0.99 per cent) as the participation rate fell by 0.7 points (a huge monthly contraction.
As a result (in accounting terms), total unemployment rose by 1,353 thousand and the unemployment rate rise by 0.9 points to 4.4 per cent.
However, as the previous analysis showed this is just the tip of the iceberg.
For the time being the extended period of low unemployment is over.
The next graph shows the monthly employment growth since January 2008. The red line is the average labour force growth over the period December 2001 to December 2006 (0.09 per cent per month).
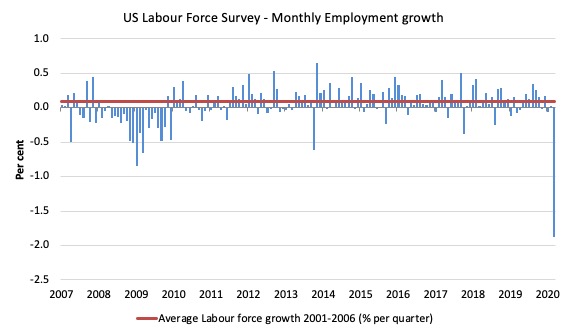
The summary conclusion: As in the previous graph (UI claimants), the decline in employment growth is dramatic – much worse than the GFC.
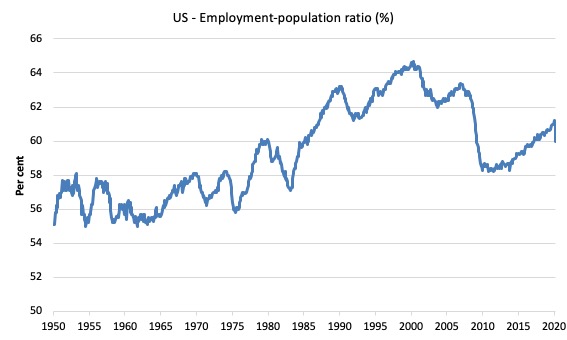
The Employment-Population ratio shift is also dramatic.
This is a good measure of the strength of the labour market because the movements are relatively unambiguous because the denominator population is not particularly sensitive to the cycle (unlike the labour force).
The following graph shows the US Employment-Population from January 1948 to March 2020.
While the ratio fluctuates a little, the March 2020 ratio fell by 1.1 points to 60 per cent, which is the largest monthly fall since the sample began in January 1948.
Unemployment and underutilisation trends
The first graph shows the official unemployment rate since January 1950 which shifted from 3.5 per cent to 4.4 per cent (noting the caveats at the outset.
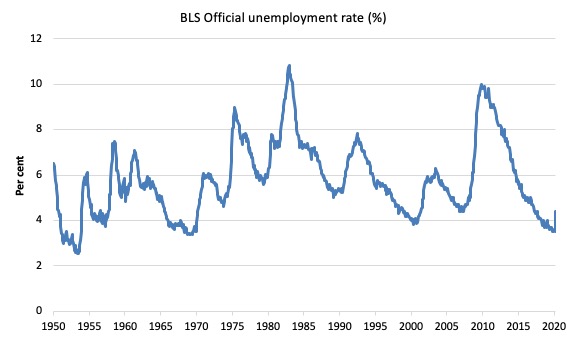
The official unemployment rate is a narrow measure of labour wastage, which means that a strict comparison with the 1960s, for example, in terms of how tight the labour market, has to take into account broader measures of labour underutilisation.
The next graph shows the BLS measure U6, which is defined as:
Total unemployed, plus all marginally attached workers plus total employed part time for economic reasons, as a percent of all civilian labor force plus all marginally attached workers.
It is thus the broadest quantitative measure of labour underutilisation that the BLS publish.
In December 2006, before the effects of the slowdown started to impact upon the labour market, the measure was estimated to be 7.9 per cent.
In March 2020 the U6 measure increased by 1.7 points to 8.7 per cent.
This is the largest monthly rise in this measure since it was first published in January 1994.
This was driven, in part, by the rise in the category ‘Part-time for economic reasons’ – a measure of underemployment in the US data context) – it rose by a huge 1,447 thousand or 25.1 per cent.
The BLS say that “These individuals … would have preferred full-time employment, were working part time because their hours had been reduced or they were unable to find full-time jobs”.
So not only are there massive layoffs occurring but firms are also making hours adjustment – cutting full-time hours back to part-time or cutting part-time hours.
There was also a sharp increase in the category – Discouraged NLF search and available not available – which taken together with the rise in underemployment compounds the loss of jobs and rise in official unemployment.
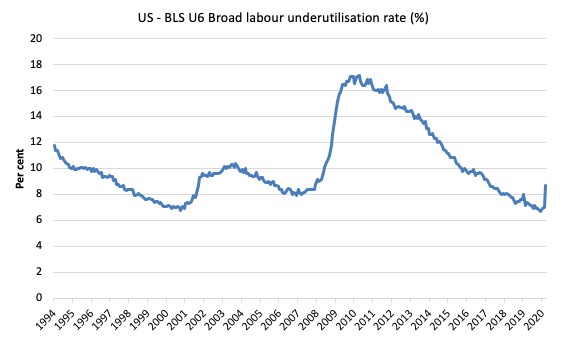
The U-6 measure is now below the pre-GFC level, and, while, signalling improvement, there is still some scope to go before full capacity is reached.
Aggregate participation rate – plunges by 0.by 0.1 points to 66 per cent
The fall in the labour force participation rate eased the pressure on official unemployment.
By how much would unemployment have risen if the participation rate had not fallen?
The labour force is a subset of the working-age population (those above 15 years old). The proportion of the working-age population that constitutes the labour force is called the labour force participation rate. Thus changes in the labour force can impact on the official unemployment rate, and, as a result, movements in the latter need to be interpreted carefully. A rising unemployment rate may not indicate a recessing economy.
The labour force can expand as a result of general population growth and/or increases in the labour force participation rates.
The labour force would have been 164,732 thousand instead of the actual official value of 162,914 thousand had the participation rate not fallen.
If we add the difference back into the official unemployed then we would get an adjusted unemployment rate of 5.4 per cent instead of 4.4 per cent.
Conclusion
The March 2020 US BLS labour market data release reveals a rapidly deteriorating labour market.
But as the song goes – You ain’t seen nothing yet!
The weekly claimant data released in the last two weeks of March (after the survey end-date for the household survey) shows how dramatic the deterioration revealed in the official BLS data is much worse.
Once these trends are factored into the next month’s labour force survey then the unemployment rate will jump up past 10 per cent.
All variables reported changed sharply.
I have never seen these sorts of monthly shifts.
The scale of the crisis requires dramatic interventions.
The current position of the US government has biased their stimulus spending towards the corporate sector and high income earners.
It disadvantages precarious workers and those losing jobs.
The US government should immediately announce an unconditional Job Guarantee and guarantee salaries for all workers made redundant.
That is enough for today!
(c) Copyright 2020 William Mitchell. All Rights Reserved
Covid is just the type of crisis the con man in charge is by nature very unsuited to address: it’s based on science and requires the imposition of unpleasant measures to protect the general population against a future danger, working under apprehension for the well being of others.
@Yok: “its based on science” oh yes? I defy anybody to believe that after reading:
https://off-guardian.org/2020/04/05/covid19-death-figures-a-substantial-over-estimate/
The death figures being touted at us daily by the lamestream media that brought us Trump as being due to the Russkies or Saddam’s non-existent WMD are thus meaningless.
It starts with Covid deaths WITH the virus being classed as Covid deaths FROM the virus and just gets statistically worse.
Yes I am afraid these stats are just the tip of the iceberg. We are in a really tough time now. I liked Neil Wilson’s idea for a job guarantee that at the moment would pay people to stay at home. But we would be on notice that you might be required to get out there and help as soon as necessary.
One thing I wonder about is how labor intensive is most farming or agriculture? I have been hoping, and actually think, that it isn’t and that farmers will continue to be able to grow food. And then that it can be shipped or trucked around the country adequately. Any thoughts about that? I’m someone that can barely grow grass let alone a vegetable. But grain production shouldn’t take much of a hit should it?
Scary times and I admit I’m scared.
From The Guardian today>
….Premier Gladys Berejiklian announced the establishment of Resilience NSW on Monday, saying it would ensure the state was prepared and able to respond to crises – “be it Covid, be it cyber security, be it a whole range of things we may not foreshadow…..
May not, as meaning not allowed to…why do I think that this is a government acting on the old adage> never let a good crisis go to waste, cf Naomi Kleins book on Shock Therapy incl. Milton Friedmans monetarism and the Chicago Boys…
Bill, you wrote,
“The U-6 measure is now below the pre-GFC level, and, while, signalling improvement, there is still some scope to go before full capacity is reached.” Right below the graph of U6 from 1994 to 2020.
I suspect that this was left as is by mistake while you were editing something.
Clearly the graph shows it being “under” the 2009 level but it also shows it has shot up in 3/20 and is now above the 2009 level.
Covid-19 has given Australia the best set of economic policies we have seen in generations demonstrating how easily conservative governments can move to the left. Unfortunately Labor governments can move with equal ease to the right as we saw when Hawke and Keating gave us the Accord and sold the Commonwealth Bank. Fraser’s conservative government would never have got away with those stunts. Labor and the unions would have howled the House down.
Trump can move to the left on pragmatic grounds. Who will oppose such a move? Joe Biden? The problem after 40 years of Reagan, Thatcher and Milton Friedman is finding competent civil servants to make it happen. Still, as Nugget Coombs used to say, it should not be beyond the wit of man.
The last time anything like this happened was in 1929 & 30.
Almost every expert will tell you that the New Deal did *not* end the Depression, that WWII did that.
Most experts and people deduce from this that the New Deal was a failure; and many go on to further deduce that fiscal stimulation will always fail to end a Depression.
What I see is that WWII added more fiscal stimulation onto the New Deal, and that this was then enough fiscal stimulation to end the Depression. From this I deduce that the Depression would have been ended sooner if FDR had doubled or tripled the deficits that he actually got past by a reluctant Congress.
And of course, that the WWII level of deficits did not cause any problem. Not inflation, not crowding out of bank lending, and not high interest rates. And the national debt was never a burden that the people had to scrimp and suffer to repay.
Yes, there are “reasons” why it didn’t cause any problems. But, the reasons don’t *prove* anything. It is unfortunate that those ‘reasons’ were there to confuse the issue and keep the lack of problems from being PROOF that large deficits do *not* cause any problem except maybe inflation, if taken to huge extremes.
This matters a lot in the current crisis. The deficit must be 2x or 3x more than Congress is likely to pass. The deficit spending must be fed into the economy at the bottom and allowed to trickle, or is it gush up, to the top f the economy. We have seen that feeding money into the top of the economy does little to stimulate the economy (but it can save big corps. from going bankrupt, which does do good, in that the situation doesn’t get worse).
@ Sceptic
Thanks for the link to off.guardian.org
And thanks to Prof. Mitchell for not censoring this link.
History will probably assess the currently accelerating economic and social catastrophe as the unnecessary consequence of misinformed myopic government actions.
Lockdowns may be succeeding in “flattening the curve”, but this exacerbates and prolongs the economic catastrophe.
Recovery will take several years and can only begin when a majority of people have immunity after catching and surviving the illness, or (less likely) through vaccination.
Hello World
We have daily press conferences here in New Zealand. Our prime minister Jacinda Ardern and finance minister Grant Robertson like to lead out their respective spin with “how well we are doing compared to other countries”. Usually they compare our public deficits to GDP ratios with other nations. Grant Robertson will say gleefully, “we were in great shape going into the crisis because we had a surplus and a debt to GDP of 20%. All politicians in NZ do this. But relative measures are always deceiving, and I don’t care about some ratio. I am worried about unemployment and rental prices and a Job Seeker Support for a country that has no jobs. But we still have the working poor, unemployment, underemployment, suicides, child abuse, meth and on and on. And a public sector and private sector that do not hire the unemployed. They just recruit “talent” from the worldwide labour market. Successive governments have given up training kiwis, and they like to claim victory with $X million dollars of foreign revenue generated by flunky tertiary institutions that teach junk courses to folk from Delhi. WE are a mad bunch here in NZ needing some help from Bill or Warren or Randall or Michael or Stephanie.
Conclusions and remedies
Bill closes today’s blog piece by emphasizing the need for the US to “announce an unconditional Job Guarantee and guarantee salaries for all workers made redundant”. Thus counteracting the current bias towards sectors of the economy favoring high-end earners.
Whether you support JG as part of an advanced economy or not, the overwhelming reaction of society is that wage-earners and gig workers should receive particular support during the aftermath of the coronavirus pandemic.
MMT principles have now established a world-wide level of understanding of the role of government debt. That it allows the re-generation of severely depleted economies within a fiscal framework has long established historic instances.
In essence the problem has therefore moved on from virtuous theory to practical application.
If nothing else, the current disruptive outcome of the virus has highlighted a misalignment between the aspirations of a materialistic society and our sense of empathy and compassion. How long this realization with last however, depends to a large extent on how our economies recover and their competitive and social driven direction.
We have already seen the great upheavals wrought on retailing by online shopping; it is likely to be exacerbated as economic recovery accentuates these changes. We are seeing dramatic developments in the speed at which technology can come to our aid. No less important is the realization that certain jobs in the clinical and social sector are inadequately recognized and rewarded. Society is in effect under a form of judicial scrutiny
MMT theoreticians have been instrumental in bringing advances in the understanding of economic theory. This now needs to projected forward by linking theory to the practical formats that will enhance human activity and well-being.
I guess Bill is already aware of the road that this must follow, and I imagine it will have a leftward tilt in its elevation.
“Lockdowns may be succeeding in “flattening the curve”, but this exacerbates and prolongs the economic catastrophe”.
Starting from the premise that the aim of the lockdowns is to minimise the number of initial deaths (however computed), that a consequence of imposing them will be to worsen the pandemic’s effects on the economy clearly must have been accepted as inevitable. Those govts that chose not to impose one (Holland and Sweden for example) must therefore be presumed to have consciously been accepting the risk that the initial death-rate might thereby be – to some extent – increased compared with what it otherwise would have been. To put that another way:- that an unknowable number of lives might be sacrificed.
The whole thing is a gamble.
If it were to turn out that a vaccine is able to be brought into full effect relatively quickly (not sure what I mean by that – would 6 months be a reasonable benchmark?) then would 6 months of lockdown or near-lockdown have imposed too big an economic price to pay for the (unknowable) reduction in the number of lives foreshortened?
I guess the answer will vary depending on who is considering the question. Anyone in the most vulnerable age-category who is in reasonably robust health (and/or on whom some other person, such as a spouse, is dependent) will presumably answer “yes, unconditionally” because it’s her/his own life-expectancy which is being weighed in the scales. Conversely, anyone not in that category might be inclined towards advocating that the risk be taken – given that the consequences for themselves of it not coming-off become increasingly less severe the younger they are (other things equal).
I must say that I really feel for those democratically-elected politicians (Trump excepted, owing to his lacking any moral compass whatever and thus disqualified) who have to make such an impossible decision, in a context of so many unknowns and with such dire consequences hanging on whatever decision is made!
Sorry, the answer given should – self-evidently – have been;- “No, unconditionally”!!!
Meanwhile, back in Blighty, FT: “BoE governor rejects money creation tool”. That’s Andrew Bailey who previously f**ked up at Financial Conduct Authority. Such a good choice.
Meanwhile, back in Blighty, FT: “BoE governor rejects money creation tool”.
So, this is presumably when we discover how “independent” the BoE *really* is!
“not sure what I mean by that – would 6 months be a reasonable benchmark?”
Anecdotal I know, but I’ve seen several people involved in vaccine production saying ten years is the usual time to create an effective vaccine so if we see a SARS-2 vaccine within 3 years that would be really remarkable.
“Herd Immunity” is the only way out of this mess. The problem is that we just don’t have the capacity in the health services to handle the cases, nor do we have the stomach in the community for the rate of death that would entail.
It’s not just about keeping the load under the ICUs capacity to cope. It’s about keeping the flow of death down to a level the population will tolerate. But as we know only too well, flows accumulate into stocks over time.
Meanwhile, back in Blighty, FT: “BoE governor rejects money creation tool”
Has anybody asked him how there’s supposed to be any inflation if nobody has any money to buy things?
We really are in the Chernenko phase with Monetarist Central Bank Governors aren’t we.
Glad to see some scepticism over the Covid19 numbers. For those interested, it’s worth checking out mathematician Andrew Mather’s “Peerless Reads” Youtube channel.
Well Robert, not everyone thinks only about themselves right? I mean I’m 52 so not in a super high risk category- but certainly getting there and not at no risk. The argument about shutting down verses riding it out actually is a difficult one. And I have had it with a lot of people. And sometimes it has gotten very bitter.
I favor the shut-down till we have more data- which should come soon. If that data comes back saying most of us have already gotten this thing and recovered- then that would be great news and I will go around apologizing for supporting the tremendous hurt to people that this shut-down has in fact caused.
But if it turns out that only 10% of people have already got this and 20% of them require hospitalization and the virus actually has a 2% death rate even with hospital care well then well that really sucks worse than the shut-down. It is difficult when we are mostly flying blind. Two more weeks we will know much more. We are doing more testing for active cases and an antibody test is becoming available. I will have that as soon as possible.
Anyways- when Donald Trump says 200,000 deaths means he is doing a great job- well it makes me worry.
“BoE governor rejects money creation tool” I guess he means as a tool in support of social welfare as opposed to corporate welfare. He couldn’t possibly mean that he’s going to switch off the BofE computer that magically pays our heroic NHS workers, could he.
Brilliant article by Yeva Nersisyan and Randy Wray.
http://multiplier-effect.org/what-mmt-is-and-why-we-should-not-wait-for-the-next-crisis-to-live-up-to-our-means/
We need more of this out there and front run this thing with correct MMT narratives.
Here in the States, I just ordered a new yard sign to replace or complement my current one, which is “NO NEW WARS/HOT OR COLD.” My new sign will say: “WE’RE IN THIS TOGETHER/BAIL OUT EVERYONE.” I would love to see my country flooded with similar signs, bumper stickers, buttons, T-shirts, etc., conveying a similar message, and would love to see other countries embrace the idea in their own ways, as some already seem to be doing. As the plutocrats scramble to preserve their interests and to profit from this pandemic, it is shaking the very foundations of neoliberalism and attacking at its weakest point. The moment may well have come that will make us or break us, meaning humanity as a species. Although my wife and I fall within the most-likely-to-die category, I’m eager to use the breath I have left to keep saying the same thing: face down your fear, face up to your mortality, embrace your brothers and sisters, and do all you can to do what we only talked about in the 60s, to SEIZE THE TIME. Forgive me for preaching largely to the choir here, but I happen to be an actual preacher and sometimes just can’t help myself.
Hi Bill,
The second graph, US – New Unemployment Benefit Claims… is missing the March spike, at least on my phone.
“Anecdotal I know, but I’ve seen several people involved in vaccine production saying ten years is the usual time to create an effective vaccine so if we see a SARS-2 vaccine within 3 years that would be really remarkable”.
Well that’s that then. Herd immunity is all that we have left, effectively.
Because there’s no way our societies (or any previous ones come to that) could endure lockdowns lasting anything like that long without descending into chaos and civil disorder. Even six months would be far too long for most people.
Does anyone know of a nice desert island where my wife and I could go and live until a vaccine is developed or we die of old age – whichever happens first?
No? Thought not.
Sceptic, have you perhaps considered applying some of that famous scepticism to everything you read, rather than selectively?
To take one example (only one, I admit) from that off-guardian piece, it refers to NHS guidance (though it appears to actually come from the UK Office of Statistics):
“[I]f before death the patient had symptoms typical of COVID19 infection, but the test result has not been received, it would be satisfactory to give ‘COVID-19’ as the cause of death, and then share the test result when it becomes available. In the circumstances of there being no swab, it is satisfactory to apply clinical judgement.”
The Off-Guardian piece then goes on to editorialise, paraphrasing that the UK Gov is giving deaths when there is ‘literally no evidence the deceased was infected’, with the bit in inverted commas emphasised with Very Serious Itallics. O-G Is literally wrong. Circumstantial evidence (that acquired by medical practitioners using their clinical judgement in lieu of or pending test results – remember that tests are in limited supply) is literally evidence. Verily, crap argumentation and deduction exists in media both mainstream and alternative.
Meanwhile, you seem to question that the CoViD-19 pandemic is based on science because of the imperfect data that’s being collected as a corollary of this novel (key word, that) coronavirus, data which is imperfect not because of malign intent but because of the exigencies of the situation (limited testing available, healthcare workers under considerable strain during a rapidly developing situation, variable policies for data collection). This seems to be a conception of science as something that is or ought to be perfect and beyond question at all times, which is childish. You have not rhetorically supported your contention that death figures being cited are meaningless.
I’m not sure there’s a pandemic in human history that has perfect and exact casualty numbers. There is usually a range of estimates.
I don’t deny that, per Ioannidis at Stanford, there are potential issues with the data being collected and its application, and we should be careful about its analysis. Inferring a non-event or sinister motive or, gasp, ~conspiracy~ from these imperfections is mere dilettantism.
Incidentally, as any sceptic would know, the following:
‘Group X (Mainstream Media, a probably-more-heterogenous-than-you-assume group of thousands of organisations and their employees worldwide) were wrong or lied about X and Y in the past, therefore they are wrong or lying about Z now’
Is an informal ad hominem fallacy (or ad newsmediam, if you like), and not worth taking seriously.
Perhaps a username change from Sceptic to Contrarian is in order?
@ Basil Pesto
Well said indeed and IMO a comprehensive rebuttal of Sceptic’s irresponsible, callous (albeit not intentionally so), argumentation. Contrarian, as you say.
I’m glad that there should be more than one single, unquestioned, source of data (Imperial College for instance) about the pandemic, because obviously that must increase the chances of a “correct” picture being assembled rather than one which otherwise cannot be other than incomplete and imperfect. The better the data the more carefully can counter-measures be targeted.
But only if that is done responsibly and as scientifically as the state of the science’s (epidemiology’s) development permits. And above all with a scrupulous regard for truth rather than being influenced by polemical intent or self-interest. Which seems to be just where some – by no means all – of the O-G “counter-evidence” seems to me to go somewhat astray.
@Basil Pesto: why Pesto, how about cherry, as in cherry-picking…amusing on an MMT website fighting several decades of orthodox mythmaking that the word Contrarian is used by you as a pejorative…
To wit: conspiracies are not theories they are crimes. But I digress: there are by now enough written memoirs of what Paul Craig Roberts is pleased to call “presstitutes” and academic studies of the media by e.g. the group in Glasgow to utterly gainsay your allegation of media heterogeneity. As Marx tells us., “Die herrschende Meinung ist die Meinung der Herrschenden”, difficult in English. but roughly: The ruling opinion is the opinion of the rulers”.
You carefully avoid mentioning that the off-guardian.org piece has no fewer than a couple of dozen condemnatory statements by leading medicos in responsible academic or (ex-) public service positions in various countries.
One of them, pulmonologist Dr Wodarg was not only instrumental in exposing at the Council of Europe the swine flu vaccine scam a decade ago, he has commented how the leading German TV medical face of Corona, Prof Drosten of the Charite hospital in Berlin, was heavily involved in the swine flu debacle as well.
Excellent comment, Basil Pesto. A major criticism of sceptics is the comorbidity in Italian death figures. If coronavirus deaths are overstated there, this could suggest the danger elsewhere is overstated. But the usual Italian figures are solely of hospital deaths – who are naturally the sicker people, more likely to have other health conditions. More recent study indicates that if one takes into account home and nursing home deaths, the usual figures understate the actual deaths by a factor of at least two! So the idea that the Italian figures are exaggerated is weak and unlikely and thus does not help the sceptical case.