The recent extreme weather in the northern hemisphere, the twin monster tropical storms in Japan,…
US downturn very harmful to low wage workers and their communities
I am monitoring the US Department of Labor’s weekly data releases for the unemployment insurance claimants account, that I reported in my last commentary on the US labour market – Tip of the iceberg – the US labour market catastrophe now playing out (April 6, 2020). Their latest release (April 9, 2020) – Unemployment Insurance Weekly Claims – shows that in the prior week ending April 4, 2020, the initial claims rose by 6,606,000, but this was down on the increase the week before by 261,000. In the last three weeks, the total initial claims is 16.8 million persons. The impacts are quite stark already. For example, as you will see, in just one month (March), service sector occupations have shed 36.7 per cent of the total jobs that were added in the ‘recovery’ period between January 2010 and February 2020. And given the timing of the surveys (biased towards earlier in the month), the situation was much worse by the end of March. It is quite obvious that this crisis is impacting heavily and disproportionately on the least-advantaged workers and communities in the US. This cohort always suffers during a recession. But this time, the specific occupation biases are exacerbating the problem and inequity, given the nature of the economic shock (closures, shutdowns etc). It means the fiscal support should be heavily weighted to assisting the most impacted both in terms of people, their families and the regions they live in. The maps show that the spatial impact of the downturn to date is also very uneven. As yet, I have not seen a commensurate response from the US government. The fiscal support funds so far announced do very little for the most impacted communities and people. They certainly shore up the top-end-of-town which, while predictable, will come back to haunt the nation in the years to come.
Nation-wide analysis
The Department of Labor provides an archive of the weekly unemployment insurance claims data back to July 1, 1967 – HERE.
The weekly data can be found in the – UI Weekly Claims Report.
The following reality emerges.
The Department of Labor reports that:
In the week ending April 4, the advance figure for seasonally adjusted initial claims was 6,606,000, a decrease of 261,000 from the previous week’s revised level …
The largest increases in initial claims for the week ending March 28 were in California (+871,992), New York (+286,596), Michigan (+176,329), Florida (+154,171), Georgia (+121,680), Texas (+120,759), and New Jersey (+90,438), while the largest decreases were in Nevada (-20,356), Rhode Island (-8,047), and Minnesota (-6,678).
Bringing together the archived data and the most recent release (April 4, 2020), the following table tells the shocking story.
| Week ending | Initial Claims (SA) | Weekly Change | 4-Week Moving Average (SA) |
| March 7, 2020 | 211,000 | -6,000 | 161,500 |
| March 14, 2020 | 282,000 | +71,000 | 232,500 |
| March 21, 2020 | 3,307,000 | +3,025,000 | 1,004,250 |
| March 28, 2020 | 6,686,700 | +3,560,000 | 2,666,750 |
| April 4, 2020 | 6,606,000 | -261,000 | 4,265,500 |
If we assume all those new claimants were unemployed then the unemployment level by the end of March would be 22,849 thousand instead of the BLS estimate (take up to the end of the survey week – March 14) of 7,140.
This would mean that the unemployment rate would be 14.1 per cent by the end of March rather than the official BLS March figure of 4.4 per cent.
The peak unemployment rate during the Great Depression was 24.9 per cent in 1933, before the New Deal brought it down somewhat.
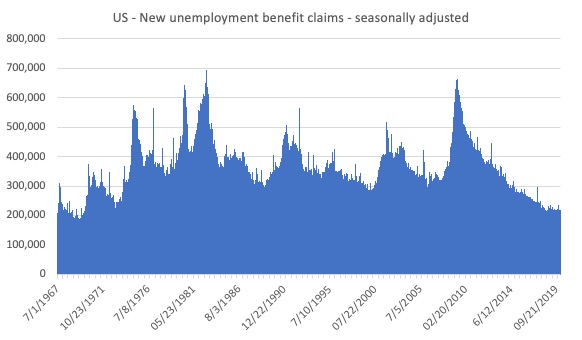
The next two graph show the extraordinary nature of the current period.
The first graph shows new weekly claimants for unemployment benefits from July 1, 1967 to the week-ending March 13, 2020 (that is two weeks ago).
You can see the big cycles in the US labour market – the mid-1970s downturn, the recessions in the early 1980s, the early 1990s recession, the early 2000s and then the GFC.
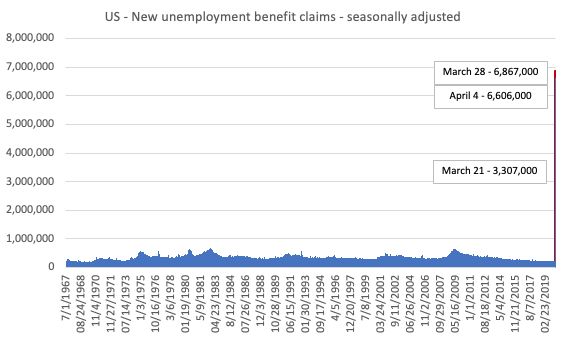
The next graph adds the last three weeks of available data (week-ending March 21 to April 4, 2020) to the entire sample.
The spike at the end of the graph shows how drastic the situation is in the US.
This is a quite extraordinary graph.
The spatial patterns
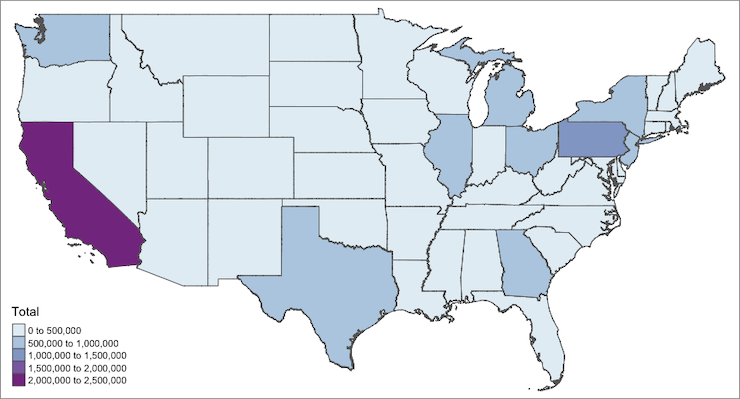
In the Department of Labor report cited above, we saw there were sharp differences in initial claimants across the US states. I decided to do some analysis and produce some maps to visualise the patterns that are emerging.
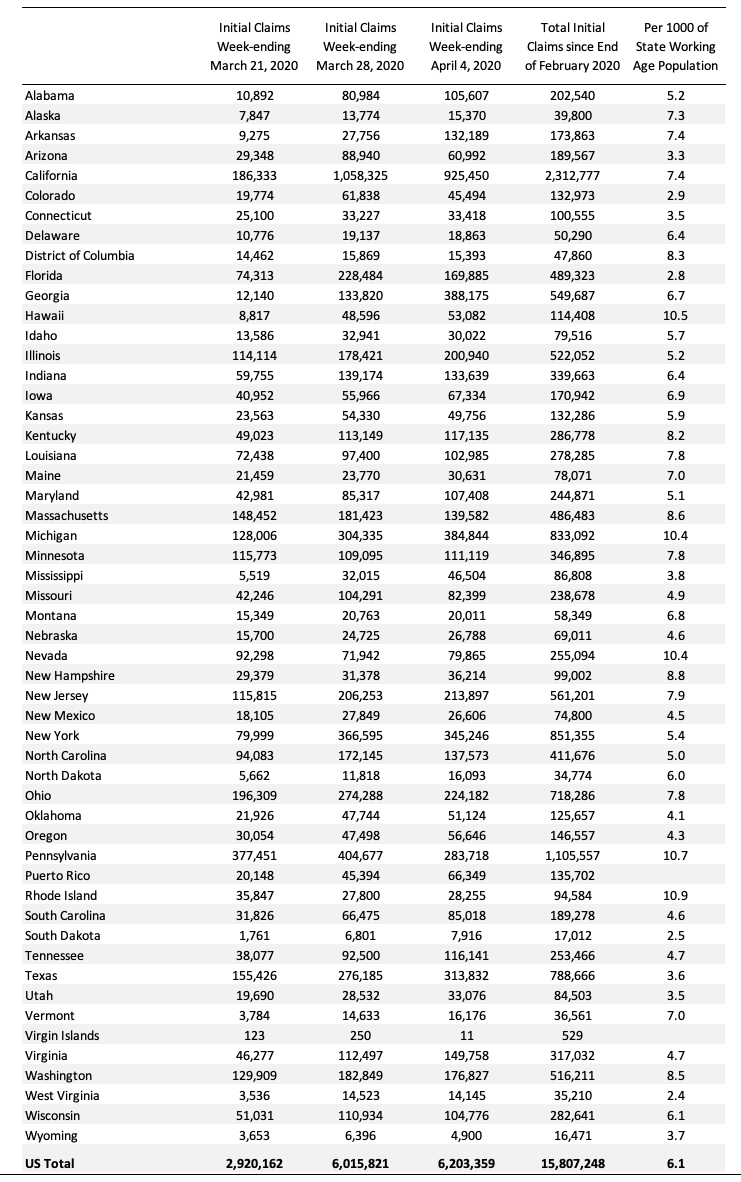
The first map shows the Sum of the Initial Weekly UI Claimants over the period February 29, 2020 to April 4, 2020 for the mainland American states (Alaska was 39,800 and Hawaii was 114,408).
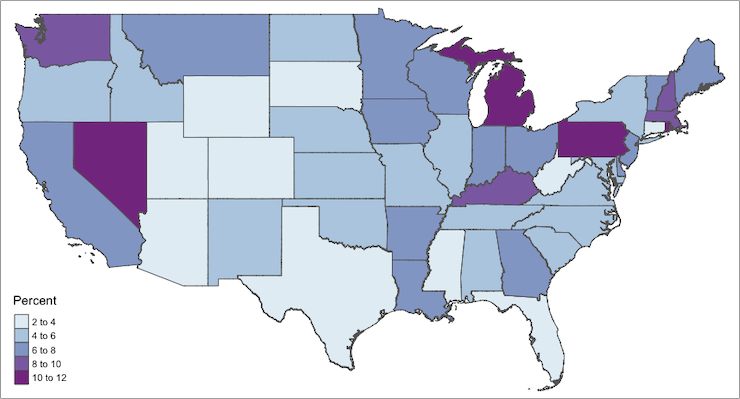
To scale this better, the next map shows the changes expressed as a percentage of the Working Age Population in each state (Alaska was 7.32 per cent and Hawaii was 10.49 per cent).
This graph more starkly demonstrates where the loss of jobs is impacting most significantly.
The following Table presents the same data for those who prefer numbers.
The Occupational Impacts to date – low wage workers bearing the brunt
As regular readers will know I have been tracking the sectoral and occupational employment changes in the US in relation to earnings for some time now. I am working on a very disaggregated version of that approach – more about that in the coming months.
But for now I just updated my research into the cyclical shifts in employment at the main occupational levels for the US today.
And the results are very interesting.
I am exploring now is how is the US labour market collapse impacting on workers across the wage distribution.
The burning question is whether low-paid workers bearing the brunt of the downturn?
In the past, I have demonstrated that the proportion of jobs in the total employment in sectors that pay below-average pay has increased.
But at that level of aggregation, we are unable to say whether these jobs in question were high-pay or low-pay.
The next table helps to expand on that understanding.
It shows the net job losses (in the downturn) and net job gains (in the recovery to date) for the major occupations in the BLS classification.
I have sorted the occupations relative to median weekly earnings as at the December-quarter 2019.
Low-pay is 75 per cent of the median.
GFC downturn
1. In the downturn, 90.6 per cent of the jobs lost were in occupations that paid below median weekly earnings (1.3 per cent of those were in low-paid occupations). Very few jobs (relatively) were lost in the higher paying occupations.
2. Given 86.1 per cent of the total jobs lost in the downturn were in sectors paying above average pay. The inference is that the jobs lost were predominantly the lower paying jobs in those sectors (although we cannot strictly compare mean and median in a wage distribution given the skewness).
GFC recovery to February 2020
1. In the upturn to February 2020, the net jobs added had not yet replaced those lost in the occupations with below median weekly earnings. 67 per cent of the net jobs added were in occupations with above median weekly earnings. That proportion has risen in the last three months to February 2020.
2. While only a small number and proportion of jobs were lost in the low-pay occupations in the downturn, the recovery saw a much larger number of those jobs added. Of the 33 per cent share of below median earning jobs added in the recovery, the proportion that were in low-pay occupations was currently 13.2 per cent.
3. This tells us that there is a polarisation going on in the occupational employment structure with a bias towards low-pay jobs in the below median weekly earnings occupations and towards jobs in the above median weekly earnings. This supports the evidence provided by the Job Quality Index data.
4. That is, over the recovery period a hollowing out around the overall median pay levels was going on.
The Covid downturn
The current crisis is very different to the GFC recession, given that a host of activities were forced to stop altogether ad authorities (slowly) enforced shutdowns and isolation.
The areas that are most affected include hospitality, sports, entertainment, restaurants and cafes, travel, and similar, which are major employers of low-paid, precarious workers.
So I expect the patterns of job loss to be somewhat different as a result.
The summary results are that:
1. Low-paid work has slumped by 3.41 per cent in March 2020.
2. In just one month, service sector occupations have shed 36.7 per cent of the total jobs that were added in the period between January 2010 and February 2020. Think about that!
2. Below-median pay jobs slumped by 2.88 per cent.
3. Above-median pay jobs fell by 0.48 per cent.
4. In terms of total numbers of jobs lost:
(a) 12 per cent (341 thousand) have been in above-median pay occupations.
(b) 88 per cent (2,507 thousand) in below-median pay occupations.
(c) 32.8 per cent of the total (933 thousand) have been in low-pay occupations (in the GFC downturn only 1.3 per cent of the jobs lost were low-paid).
The initial analysis, based on one-month’s data (March 2020) for the occupational sub-gropus is presented in the following Table.
| Occupational Group | Jobs lost/gained (000s) | Proportion of total jobs lost (%) |
| Above-median pay | -341.0 | 12.0 |
| Management, business, and financial operations occupations | +92.0 | n/a |
| Professional and related | -301.0 | 10.6 |
| Installation, maintenance, and repair | -132.0 | 3.2 |
| Below-median pay but not low pay | -1,574 | 55.0 |
| Sales and related | -490.0 | 17.2 |
| Office and administrative support | -2.0 | 0.1 |
| Construction and extraction | -120.0 | 4.2 |
| Production | -375.0 | 13.2 |
| Transportation and material moving | -587.0 | 20.6 |
| Low pay | -933.0 | 32.8 |
| Service | -897.0 | 31.5 |
| Farming, fishing, and forestry | -36.0 | 1.3 |
| Total | 2,848.0 | 100.0 |
Conclusion
It is quite obvious that this crisis is impacting heavily and disproportionately on the least-advantaged workers and communities in the US.
This cohort always suffers during a recession.
But this time, the specific occupation biases are exacerbating the problem and inequity, given the nature of the economic shock (closures, shutdowns etc).
It means the fiscal support should be heavily weighted to assisting the most impacted both in terms of people, their families and the regions they live in.
The maps show that the spatial impact of the downturn to date is also very uneven.
As yet, I have not seen a commensurate response from the US government.
The fiscal support funds so far announced do very little for the most impacted communities and people. They certainly shore up the top-end-of-town which, while predictable, will come back to haunt the nation in the years to come.
That is enough for today!
(c) Copyright 2020 William Mitchell. All Rights Reserved.
Great analysis Bill….
And so it begins in the Guardian after showing how to pay for stuff
“Call to scrap ‘triple lock’ on UK pensions after coronavirus crisis”
I hope MMT economists and activists are all over this like a rash.
@Derek Henry,
Hardly surprising considering the source.
SMF is based in Tufton St, alongside the Taxpayers’ Alliance and IEA, and forms part of the far right libertarian nexus that has unfortunately infiltrated the current government.
How it can possibly make any sense at all to suck spending power from the post-Covid economy beggars belief. These people are dangerous idiots.
Hi Derek,
Not an issue (yet) here in Australia, although an “academic tax expert”, one Professor Robert Breunig says we should raise the level of GST to take the burden off young people for paying off the debt.
I think that’s a bit of an over-reaction as our Treasurer, Josh Frydenberg, just told us he’d set the country up for just this event by “balancing the budget”.
Phew!
As they often say in the blogosphere, you couldn’t make this up.
So, in Aust. after the covid-19 crisis all over, and the Gov. wants to Pay back the money it borrowed in the crisis, just who the h*ll does the Gov. is going to have excess income to be taxed away to pay off the bonds that are held by the RBA and some rich people?
To me it is obvious that the Gov. leaders don’t give a sh*t. They are going to tax the powerless to give money to the really rich. As in “never let a crisis go to waste”.
As I see it, this is evil.
This tuns the ‘gifts’ into loans. Loans that can’t be paid back. Just like the Troyka did to Greece in 2009 or so.
This policy will destroy Aust. and then AGW aka ACC will finish the job.
The people of Aust. really, really need new leaders. Leaders with some brains.
I apologize to Australians, I know America’s leaders are just as blind.
I’d be quite happy for them to remove the triple lock.
As long as they drop the state retirement age to 60 while doing so.
The other approach to unemployment is to retire people earlier. Then everybody can shuffle up – which frees up jobs at the other end for younger people.
A very heartening discussion of just how badly the EU has handled the coronavirus crisis.
It is at the start of a video.
The title is — “Can the EU survive coronavirus?” — by the spiked podcast
25,943 views•Apr 4, 2020
I’d add a link but Bill delays it then. I’m sure you can find it.
It is ironic that the best analysis of the US labor situation comes from a man on the opposite side of the world from the US. Thanks Bill. Rather grim news though.
@Neil Wilson
Haha! Yes I can see the SMF suggesting reducing the pension age considering their founder is the revolting, right wing shill, Danny Finkelstein and its current luminaries include Chuka Ummuna. 🙂
When the frenzied scramble to exploit this pandemic is over, and the plutocrats have consolidated and expanded their elite oppression of the masses, then and only then will this revolutionary opening that has appeared so suddenly and unexpectedly be recognized and potentially seized. Even more vividly than in the bailout of the plutocrats in the 2008 GFC, it will become crystal clear, dazzling bright, to almost everyone that if the government can create trillions, at the drop of a hat, to protect the big shots, it can do the same to protect average citizens, the marginalized who must struggle even harder to survive, and the precious, irreplaceable planet that sustains us and all living things. In other words, at some point in the near future, not now amidst all the panic and confusion but SOON, the masses in every country will come to a fork in the road, one leading to socioeconomic evolution (eventually, some form of eco-socialism), the other leading to socioeconomic devolution (likely a combination of plutocracy and techno-totalitarianism). And the masses will, by virtue of their sheer overwhelming numbers, have the agency to take one fork or the other, to push things in the evolutionary direction–non-violently where possible, with adequate force where necessary–or to acquiesce in being pushed in the elite devolutionary direction. This will likely be humanity’s defining moment, given that our future looks increasingly bleak if we opt to be herded by the plutocrats further down the road of oppression and ecocide. In a scene from the classic movie, “The Hustler,” Fast Eddie, playing Minnesota Fats for the first time, loses the lag and has to break. The cue ball barely touches a corner ball in the rack and Eddie smirks to Fats, “Didn’t leave you much.” Fats examines the rack, says to Eddie, “You left enough,” and proceeds to run the table. Shortly, my friends, after all of this mad scrambling subsides, the cue will be in our hands and it will be our turn. The question will be whether decades of neoliberal existential erosion have left enough of the human spirit–enough hope and confidence and vision and belief in ourselves–for us to begin pocketing those revolutionary political balls, one after the other, until we not only win this game of life we live together but change it forever into the better, more beautiful one our hearts know is both possible and necessary.
@ Neil Wilson:
“I’d be quite happy for them to remove the triple lock.
As long as they drop the state retirement age to 60 while doing so.”
Successive UK govs let the State Pension wither over many years in the 80s and 90s, to the point where it was amongst the lowest pension rates in Europe. This caused appalling pensioner poverty, which has only recently been addressed to some degree – but it’s still relatively fairly low. The risk in decoupling from the Triple Lock is that the same thing would happen again, and whilst a retirement age of 60 is certainly desirable, especially for manual workers, it may mean living in penury for longer if the State Pension is the only source of income. In fact, rather than be tripley-unlocked, it should be considerably raised, whilst at the same time removing the tax incentive for private pensions. Let the private pension industry wither, and the guarantee of a decent State Pension remove the impetus for Buy-to-Let as an alternative pension savings activity. BTL distorts the market and is unfair to younger homeseekers.
“The other approach to unemployment is to retire people earlier. Then everybody can shuffle up – which frees up jobs at the other end for younger people.”
This argument would seem to suffer from the the “Lump of Labour Fallacy”; are older workers really hogging a fixed amount of jobs? They often tend to be the ones made redundant as their experience and commensurate higher wages means that they are more expensive to retain than younger workers. Compared to eg Japan, the UK already has a noticeably young workforce. You still see workers in their 70s in Japan, a rare sight in the UK.
I’m all in agreement of an earlier retirement age, but the level of State Pension must be high enough to avoid the ongoing fallout from historic pensioner poverty in the UK.
Productivity is the key.
If we cut the pension age and increase the pension.
I wonder what is at the heart of MMT that would kick start productivity to meet the spending habits of those pensioners who would have more spending power and there would be more of them. It begins with J and ends with a G.
@John Armour…
Gday John. In the interview I was, Frydenberg seemed to be dodging the question of “how will be pay for this”, not giving an answer on the proposition of hiking the GST (which would surely suck demand out of the economy and offset any recovery) and insisting that the “debt” will be dealt with by “growing the economy” instead. It’s almost as though for a moment, he seemed to actually understand what he’s in charge of. Not that I really expect it to last.
@Steve_American – no need to apologise to Australians Steve………..we already know our leaders are complete t**ts 🙂
“This argument would seem to suffer from the the “Lump of Labour Fallacy”; are older workers really hogging a fixed amount of jobs?”
That’s the Lump of Labour Fallacy Fallacy – that jobs are infinitely elastic.
If that was the case there would never be any unemployment ever. You need a Job Guarantee to get full elasticity – something that creates jobs for square peg people who will not fit into the round holes of the private job market. Until you have a “find jobs for the people” system you will always circulate around a sub-optimal equilibrium point. A “find people for the jobs” system will never clear the labour market.
So at a set level of activity there are a certain amount of jobs – but there is still expansion capacity there if you could only tease up demand. You have a 25 year old on a “pension” and a 65 year old on a “salary”, so they essentially swap positions – (via a bunch of intermediate jobs shuffles up the age range). But because the 65 year old pension is higher than the 25 year old pension you get an injection of state funds into the system.
Plus, as you point out, those older people discarded by the job market get a boost as their unemployment benefit is upgraded to a state pension, and those with private pensions get to start drawing them down – more people will do that if “topped up” with the state pension. Both of which are demand injections.
The corollary of this, of course, is that putting up the age of the state pension will tend to suck demand out of the economy. Another victim of the “what about the debt” obsession.
“and insisting that the “debt” will be dealt with by “growing the economy” instead.”
Eventually they’ll get to the actual answer which is that the “government credit” will be dealt with when the person “in credit” decides to spend their money.
Just as the “bank credit” the bank is in to you is reduced automatically when you go to the cash point and draw out your “in credit” money.
Again if we change the language to “government credit” then that makes the private sector “in credit” with the government.
Let’s start a “it’s not debt, its credit” movement.
“Let’s start a “it’s not debt, its credit” movement.” – i.e. MMT as electric circuit analogy …? e.g.
frugalphysics [fwd slash] electricity-analogy
(Replace “jewels from the bank” with “credit” and “lost jewels” with “energy lost harvesting energy [of which the economy is a subset]” )