Here are the answers with discussion for this Weekend’s Quiz. The information provided should help you work out why you missed a question or three! If you haven’t already done the Quiz from yesterday then have a go at it before you read the answers. I hope this helps you develop an understanding of Modern…
The Weekend Quiz – May 25-26, 2019 – answers and discussion
Here are the answers with discussion for this Weekend’s Quiz. The information provided should help you work out why you missed a question or three! If you haven’t already done the Quiz from yesterday then have a go at it before you read the answers. I hope this helps you develop an understanding of modern monetary theory (MMT) and its application to macroeconomic thinking. Comments as usual welcome, especially if I have made an error.
Question 1:
As long as employment growth keeps pace with labour force growth, unemployment will not rise.
The answer is False.
If you didn’t get this correct then it is likely you lack an understanding of the labour force framework which is used by all national statistical offices.
The labour force framework is the foundation for cross-country comparisons of labour market data. The framework is made operational through the International Labour Organization (ILO) and its International Conference of Labour Statisticians (ICLS). These conferences and expert meetings develop the guidelines or norms for implementing the labour force framework and generating the national labour force data.
The rules contained within the labour force framework generally have the following features:
- an activity principle, which is used to classify the population into one of the three basic categories in the labour force framework;
- a set of priority rules, which ensure that each person is classified into only one of the three basic categories in the labour force framework; and
- a short reference period to reflect the labour supply situation at a specified moment in time.
The system of priority rules are applied such that labour force activities take precedence over non-labour force activities and working or having a job (employment) takes precedence over looking for work (unemployment). Also, as with most statistical measurements of activity, employment in the informal sectors, or black-market economy, is outside the scope of activity measures.
Paid activities take precedence over unpaid activities such that for example ‘persons who were keeping house’ as used in Australia, on an unpaid basis are classified as not in the labour force while those who receive pay for this activity are in the labour force as employed.
Similarly persons who undertake unpaid voluntary work are not in the labour force, even though their activities may be similar to those undertaken by the employed. The category of ‘permanently unable to work’ as used in Australia also means a classification as not in the labour force even though there is evidence to suggest that increasing ‘disability’ rates in some countries merely reflect an attempt to disguise the unemployment problem.
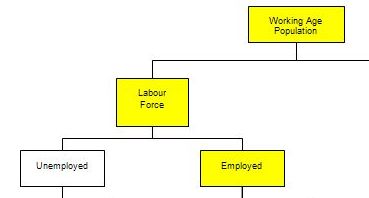
The following diagram shows a partial view of the Labour Force framework used by the statisticians in this context.
The Working Age Population (WAP) is usually defined as those persons aged between 15 and 65 years of age or increasing those persons above 15 years of age (recognising that official retirement ages are now being abandoned in many countries).
As you can see from the diagram the WAP is then split into two categories: (a) the Labour Force (LF) and; (b) Not in the Labour Force – and this division is based on activity tests (being in paid employed or actively seeking and being willing to work).
The Labour Force Participation Rate is the percentage of the WAP that are active.
You can also see that the Labour Force is divided into employment and unemployment. Most nations use the standard demarcation rule that if you have worked for one or more hours a week during the survey week you are classified as being employed.
If you are not working but indicate you are actively seeking work and are willing to currently work then you are considered to be unemployed.
If you are not working and indicate either you are not actively seeking work or are not willing to work currently then you are considered to be
Not in the Labour Force.
So you get the category of hidden unemployed who are willing to work but have given up looking because there are no jobs available. The statistician counts them as being outside the labour force even though they would accept a job immediately if offered.
Now trace through the yellow boxes which are linked by the following formulas:
Labour Force = Employment + Unemployment = Labour Force Participation Rate times the Working Age Population
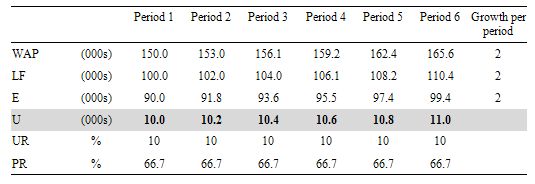
Consider the following Table which shows the Labour Force aggregates for a stylised nation and the WAP, Labour Force and Employment are all growing at a constant rate (in this case 2 per cent).
You observe unemployment rising although the unemployment rate is constant as is the participation rate.
The reason is that the Labour Force is a larger aggregate than Employment because it would be impossible for unemployment to be zero (frictions alone – people moving between jobs – will deliver some small positive unemployment).
So although both the Labour Force and Employment grow at a constant rate, the gap between them (Unemployment) gets larger each period although the proportion of the Labour Force that is unemployed remains constant.
You may wish to read the following blog posts for more information:
Question 2:
The non-government sector is immediately wealthier if the government matches it deficit with new debt issues compared to a situation where no debt was issued.
The answer is False.
Within a fiat monetary system we need to understand the banking operations that occur when governments spend and issue debt. That understanding allows us to appreciate what would happen if a sovereign, currency-issuing government (with a flexible exchange rate) ran a fiscal deficit without issuing debt?
Like all government spending, the Treasury would credit the reserve accounts held by the commercial bank at the central bank. The commercial bank in question would be where the target of the spending had an account. So the commercial bank’s assets rise and its liabilities also increase because a deposit would be made.
The transactions are clear: The commercial bank’s assets rise and its liabilities also increase because a new deposit has been made. Further, the target of the fiscal initiative enjoys increased assets (bank deposit) and net worth (a liability/equity entry on their balance sheet). Taxation does the opposite and so a deficit (spending greater than taxation) means that reserves increase and private net worth increases.
This means that there are likely to be excess reserves in the “cash system” which then raises issues for the central bank about its liquidity management. But at this stage, M1 (deposits in the non-government sector) rise as a result of the deficit without a corresponding increase in liabilities. In other words, fiscal deficits increase net financial assets in the non-government sector.
What would happen if there were bond sales? All that happens is that the banks reserves are reduced by the bond sales but this does not reduce the deposits created by the net spending. So net worth is not altered. What is changed is the composition of the asset portfolio held in the non-government sector.
The only difference between the Treasury “borrowing from the central bank” and issuing debt to the private sector is that the central bank has to use different operations to pursue its policy interest rate target in the absence of paying a return on excess reserves.
If it debt is not issued to match the deficit then it has to either pay interest on excess reserves (which most central banks are doing now anyway) or let the target rate fall to zero (the Japan solution).
There is no difference to the impact of the deficits on net worth in the non-government sector. Later as interest payments flow from the outstanding debt, then incomes rise in the non-government sector, which may translate into higher saving and more wealth.
You may wish to read the following blog posts for more information:
- Why history matters
- Building bank reserves will not expand credit
- Building bank reserves is not inflationary
- The complacent students sit and listen to some of that
- Saturday Quiz – February 27, 2010 – answers and discussion
Question 3:
If net exports are running at 2 per cent of GDP, and the private domestic sector overall is saving an equivalent of 3 per cent of GDP, the government must:
(a) Be running a surplus equal to 1 per cent of GDP.
(b) Be running a surplus equal to 5 per cent of GDP.
(c) Be running a deficit equal to 1 per cent of GDP.
(d) Be running a deficit equal to 1 per cent of GDP.
The answer is Option C Be running a deficit equal to 1 per cent of GDP.
This question tests your knowledge of the sectoral balances that are derived from the National Accounts.
To refresh your memory the sectoral balances are derived as follows. The basic income-expenditure model in macroeconomics can be viewed in (at least) two ways: (a) from the perspective of the sources of spending; and (b) from the perspective of the uses of the income produced. Bringing these two perspectives (of the same thing) together generates the sectoral balances.
From the sources perspective we write:
GDP = C + I + G + (X – M)
which says that total national income (GDP) is the sum of total final consumption spending (C), total private investment (I), total government spending (G) and net exports (X – M).
Expression (1) tells us that total income in the economy per period will be exactly equal to total spending from all sources of expenditure.
We also have to acknowledge that financial balances of the sectors are impacted by net government taxes (T) which includes all taxes and transfer and interest payments (the latter are not counted independently in the expenditure Expression (1)).
Further, as noted above the trade account is only one aspect of the financial flows between the domestic economy and the external sector. we have to include net external income flows (FNI).
Adding in the net external income flows (FNI) to Expression (2) for GDP we get the familiar gross national product or gross national income measure (GNP):
(2) GNP = C + I + G + (X – M) + FNI
To render this approach into the sectoral balances form, we subtract total taxes and transfers (T) from both sides of Expression (3) to get:
(3) GNP – T = C + I + G + (X – M) + FNI – T
Now we can collect the terms by arranging them according to the three sectoral balances:
(4) (GNP – C – T) – I = (G – T) + (X – M + FNI)
The the terms in Expression (4) are relatively easy to understand now.
The term (GNP – C – T) represents total income less the amount consumed less the amount paid to government in taxes (taking into account transfers coming the other way). In other words, it represents private domestic saving.
The left-hand side of Equation (4), (GNP – C – T) – I, thus is the overall saving of the private domestic sector, which is distinct from total household saving denoted by the term (GNP – C – T).
In other words, the left-hand side of Equation (4) is the private domestic financial balance and if it is positive then the sector is spending less than its total income and if it is negative the sector is spending more than it total income.
The term (G – T) is the government financial balance and is in deficit if government spending (G) is greater than government tax revenue minus transfers (T), and in surplus if the balance is negative.
Finally, the other right-hand side term (X – M + FNI) is the external financial balance, commonly known as the current account balance (CAD). It is in surplus if positive and deficit if negative.
In English we could say that:
The private financial balance equals the sum of the government financial balance plus the current account balance.
We can re-write Expression (6) in this way to get the sectoral balances equation:
(5) (S – I) = (G – T) + CAB
which is interpreted as meaning that government sector deficits (G – T > 0) and current account surpluses (CAB > 0) generate national income and net financial assets for the private domestic sector.
Conversely, government surpluses (G – T < 0) and current account deficits (CAB < 0) reduce national income and undermine the capacity of the private domestic sector to add financial assets.
Expression (5) can also be written as:
(6) [(S – I) – CAB] = (G – T)
where the term on the left-hand side [(S – I) – CAB] is the non-government sector financial balance and is of equal and opposite sign to the government financial balance.
This is the familiar MMT statement that a government sector deficit (surplus) is equal dollar-for-dollar to the non-government sector surplus (deficit).
The sectoral balances equation says that total private savings (S) minus private investment (I) has to equal the public deficit (spending, G minus taxes, T) plus net exports (exports (X) minus imports (M)) plus net income transfers.
All these relationships (equations) hold as a matter of accounting and not matters of opinion.
Thus, when an external deficit (X – M < 0) and public surplus (G – T < 0) coincide, there must be a private deficit. While private spending can persist for a time under these conditions using the net savings of the external sector, the private sector becomes increasingly indebted in the process.
Second, you then have to appreciate the relative sizes of these balances to answer the question correctly.
The rule is that the sectoral balances have to sum to zero. So if we write the condition above as:
(S – 1) – (G – T) – (X – M) = 0
And substitute the values of the question we get:
3 – (G – T) – 2 = 0
We can solve this for (G – T) as
(G – T) = 3 – 2 = 1
Given the construction (G – T) a positive number (1) is a deficit.
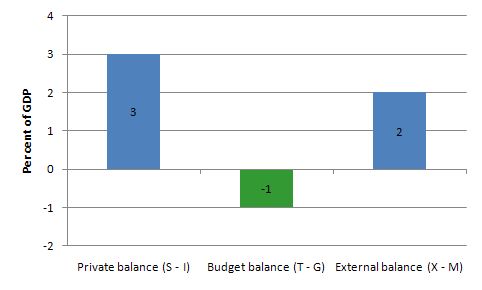
The outcome is depicted in the following graph.
This tells us that even if the external sector is growing strongly and is in surplus there may still be a need for public deficits. This will occur if the private domestic sector seek to save at a proportion of GDP higher than the external surplus.
The economics of this situation might be something like this. The external surplus would be adding to overall aggregate demand (the injection from exports exceeds the drain from imports). However, if the drain from private sector spending (S > I) is greater than the external injection then the only way output and income can remain constant is if the government is in deficit.
National income adjustments would occur if the private domestic sector tried to push for higher saving overall – income would fall (because overall spending fell) and the government would be pushed into deficit whether it liked it or not via falling revenue and rising welfare payments.
You may wish to read the following blog posts for more information:
- Back to basics – aggregate demand drives output
- Stock-flow consistent macro models
- Norway and sectoral balances
- The OECD is at it again!
- Barnaby, better to walk before we run
- Saturday Quiz – June 19, 2010 – answers and discussion
That is enough for today!
(c) Copyright 2019 William Mitchell. All Rights Reserved.


I got question 1 wrong because I confused unemployment with the unemployment rate. Must be more precise!