In the 1990s, a new industry was created in Australia. It produced nothing. But it…
Australian labour market stronger month but the underutilisation rate rises
The Australian Bureau of Statistics released the latest data today – Labour Force, Australia, March 2019 – which reveals a stronger labour market with notable growth in full-time employment. The unemployment rate rose by 0.1 points to 5.0 per cent, but, only because the participation rate rose by 0.1 points. However, there is still underlying weakness in the labour market with underemployment rising by 0.1 points to 8.2 per cent and the total labour underutilisation rate (unemployment plus underemployment) rising by 0.2 points to 13.2 per cent. There were a total of 1,782.8 thousand workers either unemployed or underemployed. The other disturbing outcome was that, despite the stronger overall employment growth, the teenage labour market deteriorated further (particularly full-time work). My overall assessment is the current situation can best be characterised as in a moderate state. The Australian labour market remains a considerable distance from full employment. There is clear room for some serious policy expansion at present. In the current federal election campaign there is only talk of bigger fiscal surpluses.
The summary ABS Labour Force (seasonally adjusted) estimates for March 2019 are:
- Employment increased by 25,700 (0.2 per cent) – full-time employment increased 48,300 and part-time employment decreased 22,600.
- Unemployment increased 17,100 to 680,000.
- The official unemployment rate increased 0.1 points to 5.0 per cent.
- The participation rate increased 0.1 points to 65.7 per cent.
- Aggregate monthly hours worked increased 13.2 million hours (0.74 per cent).
- The monthly broad underutilisation estimates for March 2019 show that underemployment increased by 0.1 points to 8.2 per cent (1,102.8 thousand). The total labour underutilisation rate (unemployment plus underemployment) increased by 0.2 points to 13.2 per cent. There were a total of 1,782.8 thousand workers either unemployed or underemployed.
Employment increased by 25,700 in March 2019
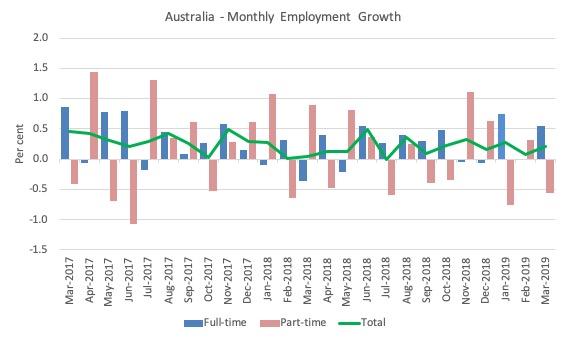
Employment growth rebounded somewhat in March 2019 with full-time employment increasing 48,300 and part-time employment decreasing by 22,600.
The following graph shows the month by month growth in full-time (blue columns), part-time (grey columns) and total employment (green line) for the 24 months to March 2019 using seasonally adjusted data.
The zig-zag pattern where employment growth has regularly been around zero remains evident.
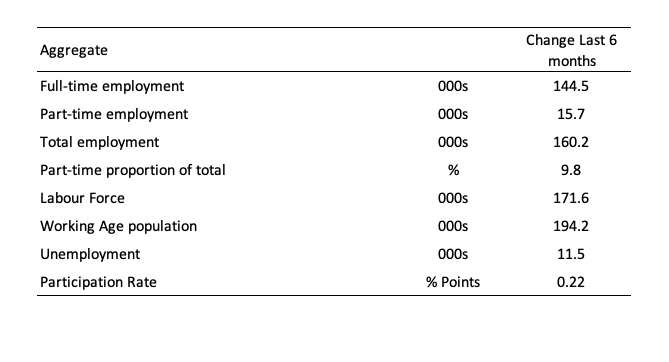
The following table provides an accounting summary of the labour market performance over the last six months. As the monthly data is highly variable, this Table provides a longer view which allows for a better assessment of the trends.
Assessment:
1. The strong contribution by full-time employment to total net employment change is notable.
2. Also participation has been rising over the period.
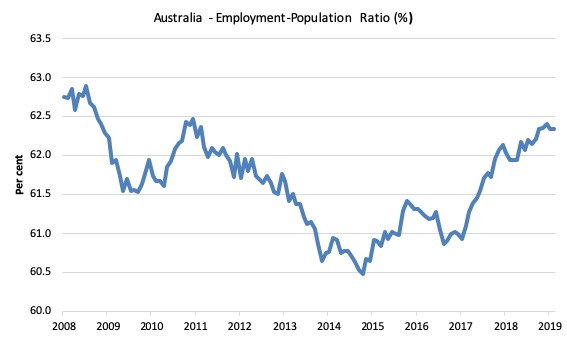
Given the variation in the labour force estimates, it is sometimes useful to examine the Employment-to-Population ratio (%) because the underlying population estimates (denominator) are less cyclical and subject to variation than the labour force estimates. This is an alternative measure of the robustness of activity to the unemployment rate, which is sensitive to those labour force swings.
The following graph shows the Employment-to-Population ratio, since February 2008 (the low-point unemployment rate of the last cycle).
It dived with the onset of the GFC, recovered under the boost provided by the fiscal stimulus packages but then went backwards again as the last Federal government imposed fiscal austerity in a hare-brained attempt at achieving a fiscal surplus.
The ratio began rising in December 2014 which suggested to some that the labour market had bottomed out and would improve slowly as long as there are no major policy contractions or cuts in private capital formation.
The series turned again as overall economic activity weakened.
The ratio was unchanged in March 2019 to 62.3 per cent and remains well below pre-GFC peak in April 2008 of 62.9 per cent.
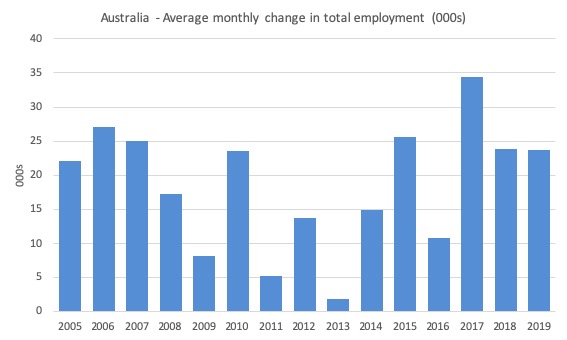
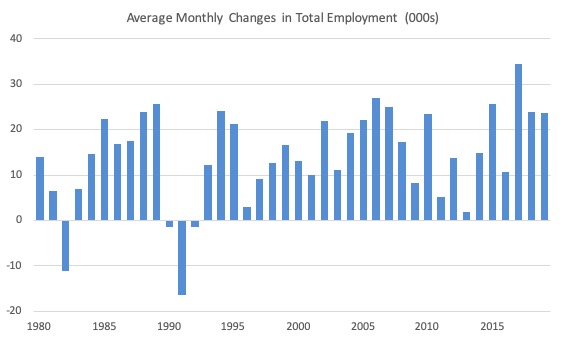
To put the current monthly performance into perspective, the following graph shows the average monthly employment change for the calendar years from 2005 to 2019 (the current year having only 3 observations in the average so far – so caution in interpretation is necessary).
It is clear that after some lean years, 2017 was a much stronger year if total employment is the indicator.
It is also clear that the labour market weakened considerably over 2018.
And that weakness now appears to be carrying over into 2019.
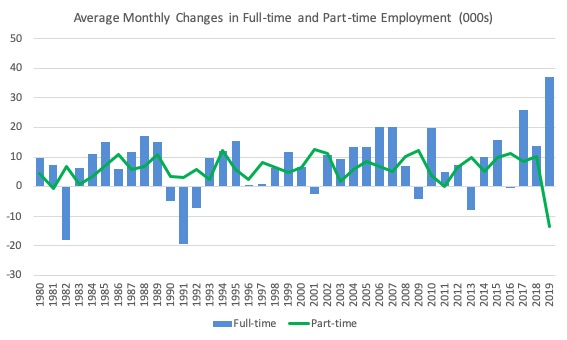
To provide a longer perspective, the following graphs shows the average monthly changes in Total employment (upper panel), and Full-time and Part-time employment (lower panel) in thousands since 1980.
The interesting result is that during recessions or slow-downs, it is full-time employment that takes the bulk of the adjustment. Even when full-time employment growth is negative, part-time employment usually continues to grow.
Unemployment increased 17,100 to 680,000
The official unemployment rate rose 0.1 points to 5.0 per cent although that was due to the increase in the participation rate.
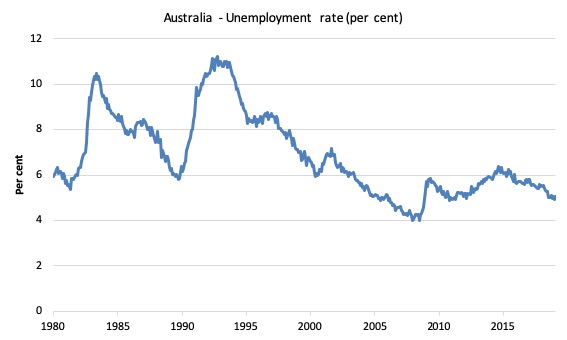
The following graph shows the national unemployment rate from January 1980 to March 2019. The longer time-series helps frame some perspective to what is happening at present.
Assessment:
1. It is still 0.1 points above the level it fell to as a result of the fiscal stimulus (which was withdrawn too early) and 1.1 point above the level reached before the GFC began.
2. There is clearly still considerable slack in the labour market that could be absorbed with fiscal stimulus.
Broad labour underutilisation increased 0.2 points to 13.2 per cent
The results based on the Monthly data for March 2019 are (seasonally adjusted):
1. Underemployment rose by 0.1 points to 8.6 per cent (1,102.8 thousand)
2. The total labour underutilisation rate (unemployment plus underemployment) increased by 0.2 points to 13.2 per cent.
3. There were a total of 1,782.8 thousand workers either unemployed or underemployed.
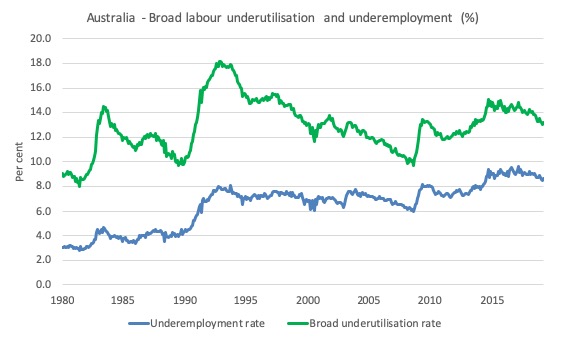
The following graph plots the seasonally-adjusted underemployment rate in Australia from January 1980 to the March 2019 (blue line) and the broad underutilisation rate over the same period (green line).
The difference between the two lines is the unemployment rate.
The three cyclical peaks correspond to the 1982, 1991 recessions and the more recent downturn.
The other difference between now and the two earlier cycles is that the recovery triggered by the fiscal stimulus in 2008-09 did not persist and as soon as the ‘fiscal surplus’ fetish kicked in in 2012, things went backwards very quickly.
The two earlier peaks were sharp but steadily declined. The last peak fell away on the back of the stimulus but turned again when the stimulus was withdrawn.
If hidden unemployment (given the depressed participation rate) is added to the broad ABS figure the best-case (conservative) scenario would see a underutilisation rate well above 15 per cent at present. Please read my blog post – Australian labour underutilisation rate is at least 13.4 per cent – for more discussion on this point.
Aggregate participation rate – rose by 0.1 points to 65.7 per cent
Unemployment rose this month largely due to the rise in participation, which meant that despite the relatively strong employment growth, the labour force expanded by more.
What would have happened to unemployment if the participation rate had not risen?
The labour force is a subset of the working-age population (those above 15 years old). The proportion of the working-age population that constitutes the labour force is called the labour force participation rate. Thus changes in the labour force can impact on the official unemployment rate, and, as a result, movements in the latter need to be interpreted carefully. A rising unemployment rate may not indicate a recessing economy.
The labour force can expand as a result of general population growth and/or increases in the labour force participation rates.
The following Table shows the breakdown in the changes to the main aggregates (Labour Force, Employment and Unemployment) and the impact of the rise in the participation rate.
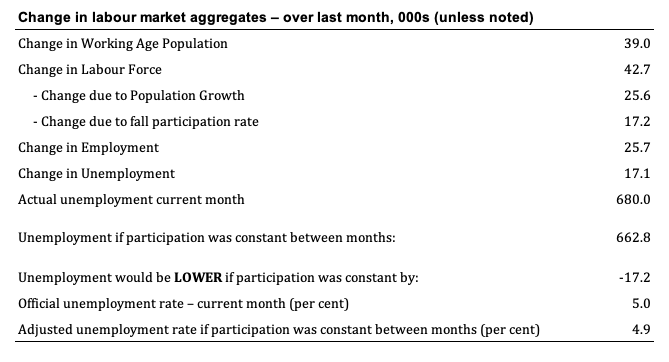
The change in the labour force in March 2019 was the outcome of two separate factors:
- The underlying population growth added 25.6 thousand persons to the labour force. The population growth impact on the labour force aggregate is relatively steady from month to month but has slowed in recent months; and
- The rise in the participation rate meant that there were 17.2 thousand workers came into the labour force (relative to what would have occurred had the participation rate remained unchanged).
- The net result was that the labour force rose by 42.7 thousand (rounded).
Note that the change in employment was almost exactly the same as the growth in the labour force as a result of the underlying population change.
And, that the rise in unemployment was almost exactly the same as the growth in the labour force arising from the increase in participation.
If the participation rate had not have risen, total unemployment, at the current employment level, would have been 662.8 thousand rather than the official count of 680.0 thousand as recorded by the ABS – a difference of 17.2 thousand workers (the ‘participation effect’).
Thus, without the rise in the participation rate in March 2019, the unemployment rate would have been 4.9 per cent (rounded) rather than its current value of 5.0 per cent (rounded).
Teenage labour market goes backwards in March 2019
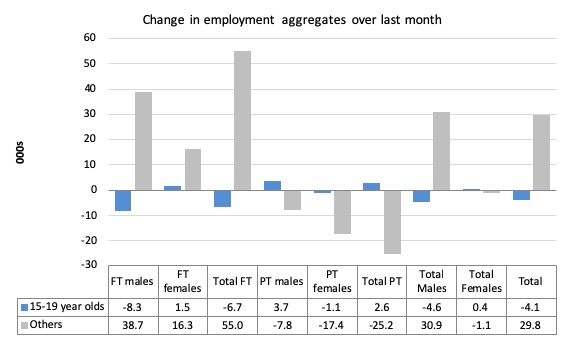
Despite the weak relatively strong employment growth, total teenage net employment fell by 4.1 thousand jobs in March 2019.
Full-time teenage employment fell by 6.7 thousand and total part-time employment rose by 2.6 thousand.
It is amazing that with the robust overall growth in full-time employment, the teenage segment went backwards.
The following graph shows the distribution of net employment creation in the last month by full-time/part-time status and age/gender category (15-19 year olds and the rest)
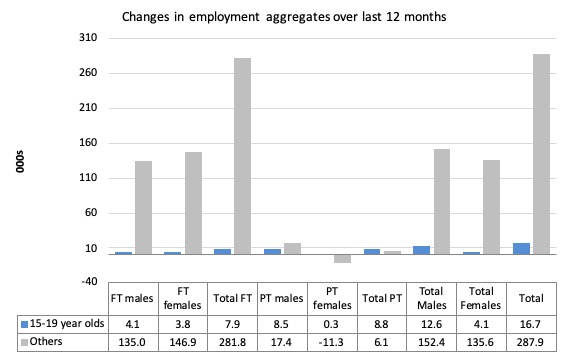
Over the last 12 months, teenagers have gained 16.7 thousand (net) jobs overall while the rest of the labour force have gained 287.9 thousand net jobs.
Teenagers have gained around 5.5 per cent of the total net employment growth over the last 12 months but represent around 7.3 per cent of the total labour force. So they are doing slightly worse in relative terms.
The following graph shows the change in aggregates over the last 12 months.
In terms of the current cycle, which began after the last low-point unemployment rate month (February 2008), the following results are relevant:
1. Since February 2008, there have been 2,144 thousand (net) jobs added to the Australian economy but teenagers have lost 64.6 thousand over the same period.
2. Since February 2008, teenagers have lost 101.6 thousand full-time jobs (net).
3. Even in the traditionally, concentrated teenage segment – part-time employment, teenagers have gained only 37 thousand jobs (net) even though 1,014 thousand part-time jobs have been added overall.
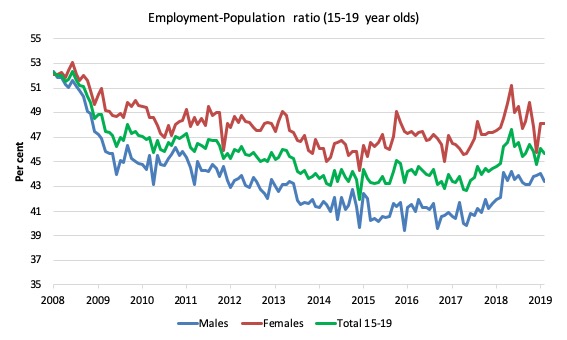
To put the teenage employment situation in a scale context (relative to their size in the population) the following graph shows the Employment-Population ratios for males, females and total 15-19 year olds since February 2008.
You can interpret this graph as depicting the loss of employment relative to the underlying population of each cohort. We would expect (at least) that this ratio should be constant if not rising somewhat (depending on school participation rates).
The absolute loss of jobs reported above has impacted more on males than females.
The male ratio has fallen by 8.9 percentage points since February 2008, the female ratio has fallen by 4.0 percentage points and the overall teenage employment-population ratio has fallen by 6.6 percentage points.
The other statistic relating to the teenage labour market that is worth highlighting is the decline in the participation rate since the beginning of 2008 when it peaked in February at 61.4 per cent.
In March 2019, the participation rate was 54.8 per cent (up 5 points on the previous month). This is a very unreliable statistic overall – it fluctuates widely on a monthly basis.
However, the difference between the 2008 level, amounts to an additional 90.8 thousand teenagers who have dropped out of the labour force as a result of the weak conditions since the crisis.
If we added them back into the labour force the teenage unemployment rate would be 24.8 per cent rather than the official estimate for March 2019 of 16.6 per cent.
Some may have decided to return to full-time education and abandoned their plans to work. But the data suggests the official unemployment rate is significantly understating the actual situation that teenagers face in the Australian labour market.
Overall, the performance of the teenage labour market leaves a lot to be desired. The decline in full-time employment for teenagers was particularly worrying.
This situation doesn’t rate much priority in the policy debate, which is surprising given that this is our future workforce in an ageing population. Future productivity growth will determine whether the ageing population enjoys a higher standard of living than now or goes backwards.
I continue to recommend that the Australian government immediately announce a major public sector job creation program aimed at employing all the unemployed 15-19 year olds, who are not in full-time education or a credible apprenticeship program.
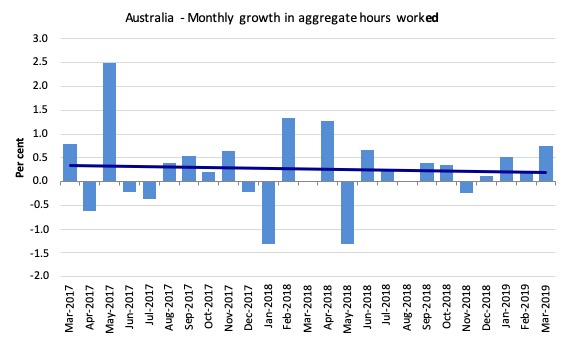
Hours worked increased 13.2 million hours (0.74 per cent) in March 2019
A fairly strong increase driven by the strong growth in full-time work.
The following graph shows the monthly growth (in per cent) over the last 24 months.
The dark linear line is a simple regression trend of the monthly change – which depicts a slight downward trend – understated distorted somewhat by the outlier in May 2017.
Conclusion
My standard monthly warning: we always have to be careful interpreting month to month movements given the way the Labour Force Survey is constructed and implemented.
The February data reveals a stronger labour market in March evidenced by the relatively robust net increase in full-time work.
Adjusting for the rising participation suggests that the unemployment rate would be 4.9 per cent rather than the official estimate of 5 per cent.
My overall assessment is:
1. The current situation can best be characterised as moderate.
2. The Australian labour market remains a considerable distance from full employment. There is clear room for some serious policy expansion at present
That is enough for today!
(c) Copyright 2019 William Mitchell. All Rights Reserved.
The curious divergence between employment growth and all other indicators that should be travelling in the same direction but generally are not, appears to be starting to become a trend.