Today (January 22, 2026), the Australian Bureau of Statistics (ABS) released the latest labour force…
Australian labour underutilisation rate is at least 13.4 per cent
The Australian Bureau of Statistics released their latest – Persons Not in the Labour Force, Australia – release for September 2012 last week (March 7, 2013). This is an annual publication and provides a detailed breakdown of the demographics of those not in the labour force and the reasons for that status. In particular interest to me is the information the data provides on discouraged and marginal workers. The data allows us to reconstruct the labour force data, under certain assumptions, to generate a very broad indicator of labour underutilisation in Australia, which includes official unemployment, underemployment, and hidden unemployment. What this indicator reveals is that Australia is enduring massive wastage of labour and statements by the Federal Treasurer and other Ministers that we are close to full employment should be treated with the contempt they deserve. That is the subject of this blog.
In the – 2010-11 Budget Speech – the Federal Treasurer defined full employment in this way:
Best of all, the unemployment rate is expected to fall further from 5.3 per cent today to 4¾ per cent by mid-2012, around the level consistent with full employment.
That was nearly two years ago and since then unemployment has risen as has underemployment.
The estimate of an unemployment rate of 4.75 per cent constituting “full employment” is contestable enough. That would mean that 580 thousand workers would remain unemployed. It is a strange definition given that in February 2008 the unemployment rate was 4 per cent and falling without any particular inflationary issues emerging.
But it becomes truly obscene when you starting adding to those 580 thousand workers. First, the underemployed workers – currently estimated by the ABS to be 878.9 thousand. Second, the hidden unemployed – currently estimated by the ABS to be between between 107 thousand to 891 thousand, depending how we define the marginal worker categories not classified in the labour force.
We can thus generate some narrow and broader indicators of how much labour is being wasted in Australia at present, largely as a result of deficient macroeconomic policy. That policy is conditioned by the Treasurer’s incredible claim that if we get the unemployment rate down to 4.75 per cent then we have full employment.
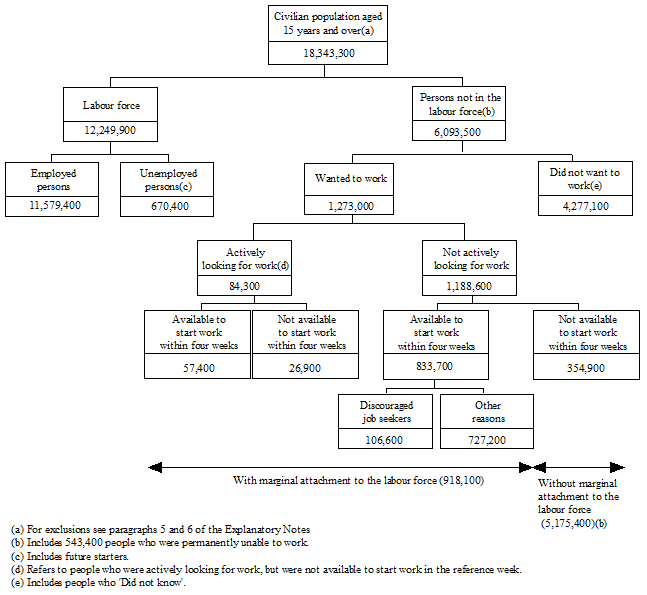
The ABS provide this diagram to summarise the way the civilian working age population (over 15 years of age) is divided into the labour force and not in the labour force categories.
The focus of interest in this blog are the Not in the Labour Force categories, where the respondents indicated to the ABS that they Wanted to Work (there were 1,273,000 people in this category).
The first question that you might ask: Why are there more than 1.2 million workers who want to work who are neither employed or unemployed (that is, in the labour force)? What could these people who want to work be doing and under what conditions would they work?
The sub-categories of this cohort provides us with further information. The “wanted to work” fall into those who are Actively looking for work (84,300) and the vast majority who are Not actively looking for work (1,188,600).
With the former category, there were 57,400 workers who were both actively looking for work and were Available to start work within four weeks. The remainder were not available to start work within four weeks.
With the cohort who failed the ABS activity test (that is, they were not actively looking for work), 833,700 were available to start work within four weeks. The remainder were not.
Ignoring activity (looking), the workers who were wanting to work and were available to start work within four weeks is thus:
- Actively looking for work, available to start work within four weeks = 57,400.
- Not actively looking for work, Discouraged workers = 106,600.
- Not actively looking for work, Other reasons = 727,200.
Some conceptual context
Recessions impact on a number of economic aggregates in addition to the most visible impact – the rise in unemployment. The great American economist Arthur Okun coined the term “The Tip of the Iceberg” to describe the costs of running the economy below full employment (below “high pressure”). These costs went well beyond the loss of jobs. Productivity is lower, participation rates are lower, the quality of work suffers and real wages typically fall.
Within this context, Okun outlined his upgrading hypothesis (in the 1960s and 1970s) and the related high-pressure economy model, which provided a coherent rationale for Keynesian demand-stimulus policy positions. Two references are Okun, A.M. (1973) ‘Upward Mobility in a High-Pressure Economy’, Brookings Papers on Economic Activity, 1: 207-252 and Okun, A.M. (1983) Economics for Policymaking, Cambridge, MIT Press.
Okun (1983: 171) believed that:
… unemployment was merely the tip of the iceberg that forms in a cold economy. The difference between unemployment rates of 5 percent and 4 percent extends far beyond the creation of jobs for 1 percent of the labor force. The submerged part of the iceberg includes (a) additional jobs for people who do not actively seek work in a slack labor market but nonetheless take jobs when they become available; (b) a longer workweek reflecting less part-time and more overtime employment; and (c) extra productivity – more output per man-hour – from fuller and more efficient use of labor and capital.
Of significance for this blog is the way in which participation rates vary with the economic cycle.
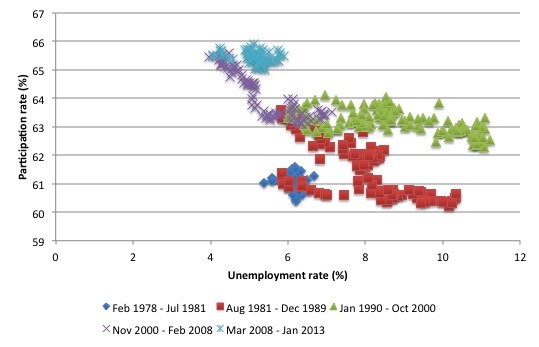
The following graph shows the relationship between the unemployment rate and the labour force participation rate from February 1978 to January 2013. That sample is divided into four sub-samples reflecting the cycle in the unemployment rate over the time.
The first period is from February 1978 (when the current comparable monthly date starts) to July 1981 – the low-point unemployment rate for that period of 5.4 per cent.
The second period, incorporating the 1981-82 recession, saw the unemployment rate peak at 10.3 per cent in February 1993 and fall to a low-point for the cycle of 5.6 per cent in December 1989.
The third period, incorporating the 1991 recession, saw the unemployment rate peak at 11.1 per cent in September 1983 and fall to a low-point for the cycle of 4 per cent in February 2008.
The final period runs from March 2009 to January 2013. The unemployment reached a recent peak of 5.9 per cent in June 2009, fell back to 4.9 per cent in April 2011 on the back of the fiscal stimulus and is now rising again (5.4 per cent in January 2013) as the stimulus is withdrawn and fiscal austerity is imposed.
The most recent period is depicted by the aqua crosses in the top left-hand part of the observation sample.
There are two interesting patterns. First, there is a strong negative relationship between movements in the unemployment rate and the participation rate over each of the cycles. When unemployment rises and job vacancies fall, workers drop out of the labour force due to the scant job opportunities.
Second, there was a structural shift in participation underway in the 1970s which endured into the 1980s as a result of the rising female participation rates. This reflected changing social attitudes towards females working (particularly married females) and more recently the need for families to have two incomes to meet the debt servicing obligations following the housing market surges in the 1990s and 2000s.
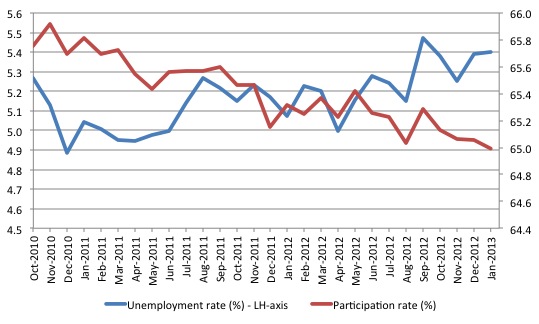
On the back of the stimulus-led recovery, participation rates rose to 65.8 per cent (in October 2010) after falling to 65.1 per cent in May 2010. In January 2013, as the Australian economy has faltered again due to the fiscal austerity, the participation rate has fallen back to 65 per cent.
Each one percentage point fall is equivalent to around 187 thousand workers leaving the labour force. The decline of 0.8 percentage points given the underlying population means that 150.3 thousand workers are not active compared to a situation that would have eventuated had participation rate not fall from their recent October 2010 peak.
This decline is mostly cyclical (due to a downturn in economic activity) rather than a structural shift reflecting demographic changes.
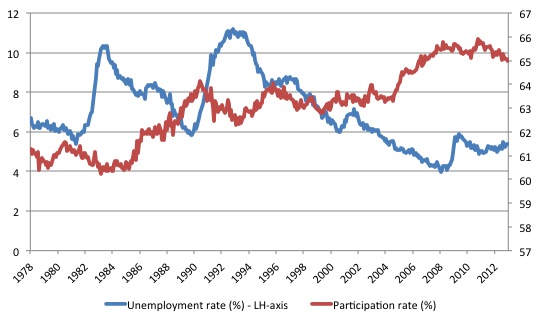
The following graph shows the evolution of the national unemployment rate (left-hand axis) and the labour force participation rate (right-hand axis) from February 1978 to January 2013.
The next graph zooms in on the period between October 2010 (labour force participation rate peak at 65.8 per cent) and January 2013 (labour force participation rate = 65 per cent).
The labour force framework is the foundation for cross-country comparisons of labour market data and is made operational through the International Labour Organization (ILO) and its International Conference of Labour Statisticians (ICLS). These conferences and expert meetings develop guidelines or norms for implementing the framework and generating national labour force data.
The rules contained within the framework generally have the following features:
- an activity principle, which is used to classify the population into one of the three basic categories in the labour force framework -employment, unemployment, not in the labour force;
- a set of priority rules, which ensure that each person is classified into only one of the three basic categories in the labour force framework; and
- a short reference period to reflect the labour supply situation at some point in time – usually what is referred to as the “reference week” (the week of the survey).
The system of priority rules ensure that labour force activities take precedence over non-labour force activities and working or having a job (employment) takes precedence over looking for work (unemployment). As with most statistical measurements of activity, employment in informal sectors lies outside the scope of measurement.
Paid activities take precedence over unpaid activities. For example, ‘persons who were keeping house’ as used in Australia, on an unpaid basis are classified as not in the labour force while those who receive pay for this activity are in the labour force as employed.
Similarly persons who undertake unpaid voluntary work are not in the labour force, even though their activities may be similar to those undertaken by the employed.
The category of ‘permanently unable to work’ as used in Australia also means a classification as not in the labour force even though there is evidence to suggest that increasing ‘disability’ rates in some countries merely reflect an attempt to disguise the unemployment problem.
In terms of those out of the labour force, but marginally attached to it, the ILO considers that persons marginally attached to the labour force are those not economically active under standard definitions of employment and unemployment, but who, following a change in one of the standard definitions of employment or unemployment, would be reclassified as economically active.
For example, changes in criteria used to define availability for work (whether defined as this week, in the next 4 weeks etc.) will change the numbers of people classified to each group.
Underutilisation is a general term describing wastage of willing labour resources. It arises from a number of different reasons that can be subdivided into two broad functional categories.
First, there is a category involving unemployment or its near equivalent.
In this group, we include the official unemployed under ILO criteria and those classified as being not in the labour force on search criteria (discouraged workers), availability criteria (other marginal workers), and more broad still, those who take disability and other pensions as an alternative to unemployment (forced pension recipients).
These workers share the characteristic that they are jobless and desire work if there were available vacancies. They are however separated by the statistician on other grounds.
Second, we can define a category that involves sub-optimal employment relations. Workers in this category satisfy the ILO criteria for being classified as employed but suffer “time related underemployment”.
For example, full-time workers who are currently working less than 35 hours for economic reasons or part-time workers who prefer to work longer hours but are constrained by the demand-side.
Sub-optimal employment can also arise from “inadequate employment situations” where skills are wasted, income opportunities denied and/or where workers are forced to work longer than they desire.
Unemployed
According to ILO concepts, a person is unemployed if they are over a particular age, they do not have work, but they are currently available for work and actively seeking work. Unemployment is defined as the difference between the economically active population (civilian labour force) and employment.
The inference is that the economy is wasting resources and sacrificing income by not having the unemployed involved in productive activity.
There are, however, other avenues of labour resource wastage that are not captured by the unemployment rate as defined in this manner. The persons represented in these other avenues of resource wastage may be either in or out of the labour force.
Underemployment
Underemployment may be time-related, referring to employed workers who are constrained by labour demand to work fewer hours than they desire, or to workers in inadequate employment situations, including skill mismatch. If society invests resources in education, then skills developed should be used appropriately. However, it is very difficult to quantify this wastage.
Time-related underemployment is defined in terms of an individual who is willing to work additional hours, is available to work additional hours, but is unable to find the desired extra hours.
In Australia, in line with the standard measurement of unemployment, persons actively seeking additional hours of work are distinguished from those who are not.
An economy with rising underemployment is less efficient than an economy which meets the labour preferences for working hours. In this regard, involuntary part-time workers share characteristics with the unemployed.
A part of an underemployed worker is employed and a part is unemployed, even though they are wholly classified among the employed.
Marginally attached workers and others outside the labour force
It is this category that last week’s ABS data release provides relatively updated information about. The ABS provide the following definition:
Persons not in the labour force are considered to be marginally attached to the labour force if they:
- wanted to work and were actively looking for work but were not available to start work in the reference week (84,300); or
- wanted to work and were not actively looking for work but were available to start work within four weeks (833,700).
From a statistical consideration, discouraged workers (also called hidden unemployed) are classified as being not in the labour force. The international guidelines from the ILO suggest, however, that for persons not in the labour force, the relative strength of attachment to the labour market be measured.
From the perspective of underutilisation, the issue is whether those classified as being out of the labour force have characteristics similar to those who are classified as being in the labour force but unemployed.
The ABS issued the following press statement with its data release last week – 100,000 Discouraged Job Seekers.
They said:
In September 2012, there were 106,600 discouraged job seekers … These are people who wanted to work and were available to start within the next four weeks if offered a job, but were not actively looking for a job because they believed they would not find one.
ABS Director of Labour Force, Cassandra Gligora said, “the number of discouraged job seekers increased 18 per cent from 90,700 in 2011, and is a return to the numbers prior to 2011. The increase was mostly driven by a rise in the number of male discouraged job seekers – up 31 per cent from 2011.
“Discouraged job seekers reported that their main reason for not looking for work was that they believed they were considered too old by employers (36 per cent) or that there were no jobs in their locality or line of work (20 per cent),” Ms Gligora said.
“These discouraged job seekers were part of the 833,700 people who were not in the labour force, who wanted work and were available to start work within four weeks, but were not actively looking for work. Of the 727,200 who were not discouraged job seekers, the most commonly reported reasons for men not actively looking for work were studying (35 per cent) and own long-term health condition or disability (15 per cent), while for women it was caring for children (31 per cent) and studying (19 per cent).
It is clear, that discouraged workers are a sub-group of the marginally attached. They want to work and are available for work (under the same terms as the unemployed) but believe that search activity is futile given the depressed labour market.
The discouraged worker is thus more like the unemployed worker than they are, for example, like a retired person or a child in full-time education.
However, what about the other workers who wanted to work and were available to work within four weeks but didn’t identify themselves as discouraged workers?
These workers said the reason for not working and not looking was that they believed they could not find a job. But given they wanted to work and would be available to work within four weeks suggests they share some of the characteristics to the discouraged workers.
Further, there were some 84,300 who wanted to work and were actively looking but were not available in the current reference week. Of those, 57,400 were available within four weeks.
So if we extended our definition of the relevant time-frame to four weeks from the current week, the picture would change rather dramatically. We would substantially increase the number of marginal workers who shared essential characteristics (wanted to work, available to work) with the unemployed.
From the viewpoint of Okun’s upgrading hypothesis, a cyclical rise in labour force participation (indicating that the discouraged worker effect is dominant) provides marginal workers with the chance to share in the benefits of the higher output and employment.
How many of the marginal workers would take jobs should they become available within the next four weeks? We don’t know exactly but the minimum would be the discouraged workers cohort.
Results
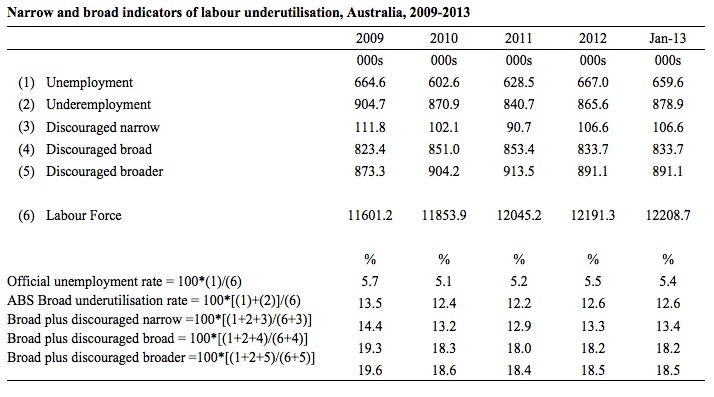
The following Table is the product of some very simple calculations using ABS Labour Force and Not in the Labour Force data from 2009 to January 2013. The annual Not in the Labour Force questionnaire was substantially revised for the 2009 sample and so the previous data is not strictly (or even reliably) comparable, which is a major shame given that the revision occurred just after the cycle turned.
The January 2013 column assumes that the Not in the Labour Force data in unchanged since September 2012, when the last survey finishes. In fact, given the slight deterioration in the labour market since then it is likely that the the discouraged workers and broader marginal worker numbers will have risen a little. But approximation is more than enough to make the point.
We start from the narrowest measure of labour wastage the official unemployment rate which is 100*(1)/(6), that is the proportion of workers in the labour force who are unemployed. In January 2013, it was 5.4 per cent (and had fallen below that since September 2012).
The more broader measure adds the official underemployment to the unemployment and expressed that as a percentage of the labour force. This is referred to as the ABS Broad underutilisation rate. The underemployed are part of the labour force given they are employed so there is no alteration required to the denominator.
In January 2013, this rate was 12.6 per cent. As you can see it means that 1.54 million workers are either not working at all or desire more work than they can current find, given the paucity of employment on offer.
If we broaden the measure further to include the discouraged workers (as defined by the ABS), the rate of underutilisation would rise to 13.4 per cent or 1.65 million workers.
To compute that rate we add the discouraged workers to the sum of the official unemployed and ABS underemployed and express that number as a percentage of a “modified” labour force. The modified labour force is the official labour force plus the discouraged workers. If we are going to consider them as being essentially identical to the unemployed then we also have to consider them part of the labour force.
The other two measures broaden the concept to include the other marginal workers who wanted to work and were available to work within four weeks. The worst-case shows that the broadest rate of labour underutilisation would be 18.5 per cent.
I am not suggesting that all these workers would accept a job now should one be offered even though they have said they are available to work within four weeks. But it is likely that a substantial number of them would.
The data release was covered by some commentators but usually from the angle of what the information conveyed about take-up of the disability support benefit.
Tim Colebatch wrote an article in the Sydney Morning Herald (March 9, 2013) – Many job seekers drop out of the market for good – where he noted that:
THE big surge in Australians dropping out of the labour market is mainly due to more older workers being classified as disabled, the Bureau of Statistics has found.
In a stunning finding, a Bureau survey reveals that while a net 121,000 people joined those on the sidelines of the workforce in the year to September, in net terms, almost all of the growth was among people who told interviewers they were ”permanently unable to work”.
Among people aged 45 to 64, based on the survey findings, there was a startling jump of 68,000 people, or almost a third, in those who define themselves as permanently unable to work.
This suggests that, rather than register for the unemployment benefit, many older workers who lose their jobs or have little hope of finding work are going onto disability support benefits as a form of early retirement.
Which means that the extent of labour underutilisation that I have identified here is also likely to be supplemented if we consider that disability pension receipt is often a last resort for an older worker unable to get work in a highly rationed labour market.
It won’t surprise you that with the unemployment benefit at a miserable $257.70 a week and a “disability support benefit … now 60 per cent higher, at $404.20 a week … [with] … easier income tests, significant fringe benefits and fewer work tests” that workers would take this option when they were unable to find work.
There is also anecdotal evidence that members of the medical profession are more humane that the government officials, the latter who appear intent on administering pernicious activity tests as part of a blame the victim approach to unemployment. The doctors do what they can to provide dignity to an unemployed worker who can fit into a disability category, even though they would prefer to work if such work was available.
Conclusion
So the reasonable conclusion is that the Australian economy is at least wasting the talents of 1.65 million workers (13.4 per cent of a broadened labour force) but somewhere between that number and 2.4 million workers (18.5 per cent) is likely to be closer to the truth. And, at least, a proportion of the disability support recipients would re-enter the labour force should a job be offered to them.
I wonder why the journalists don’t ask the Treasurer to comment on why these broader categories of wastage evade his scrutiny when he is making political statements about how close the Australian economy is to full employment and his role in creating the gap?
We will also get the February Labour Force data including the quarterly underemployment estimates this Thursday.
That is enough for today!
(c) Copyright 2013 Bill Mitchell. All Rights Reserved.
You’re spot on as usual, Bill. Data is, as data does. As much as the current government are clowns, I fear the Opposition (ie new government) will be worse. I’d like your take on their policies, given they are likely to make things considerably worse.